4527
Tractography based organization of the hyperdirect pathway to the subthalamic area in HCP subjects and parkinsonian patients
Gizem Temiz1, Sophie Sébille1, Chantal François1, Eric Bardinet1, and Carine Karachi1,2
1CENIR, Institut du Cerveau et de la Moelle Epinière, Paris, France, 2AP-HP, Hôpital de la Pitié-Salpêtrière, Department of Neurosurgery, Paris, France, Paris, France
1CENIR, Institut du Cerveau et de la Moelle Epinière, Paris, France, 2AP-HP, Hôpital de la Pitié-Salpêtrière, Department of Neurosurgery, Paris, France, Paris, France
Synopsis
The aim of this study is to analyze differences in the hyperdirect cortical connectivity between the subthalamic nucleus and its medial region, and the anatomo-functional organization of these regions using tractography. These analyzes were performed in healthy subjects and parkinsonian patients. Our results show that a dominant motor cluster was located in the posterolateral STN, a limbic cluster located medially in the MSR, and an intermediate motor-limbic cluster located in between for both cohorts. In conclusion, tractography based sub-parcellisation of subthalamic regions could be helpful to refine individual targeting for functional neurosurgery.
Introduction
The subthalamic nucleus (STN) receives direct cortical inputs which constitute the hyperdirect pathway of the basal ganglia circuitry, and which provide an anatomo-functional organization of the STN. In monkeys, it was shown that motor cortices innervate the whole extent of the STN whereas limbic cortices innervate only its anteromedial part extending more medially outside the nucleus [1,2]. Tractography studies in humans reported motor cortical inputs to the STN, but little is known about the associative and limbic cortical projections [3,4]. Due to its critical functions in motor ability, STN has become the main target for deep brain stimulation (DBS) in Parkinson’s disease (PD). The aim of this study is to investigate the anatomo-functional organization of the hyperdirect pathway originating from the whole cortex to the STN and its adjacent medial subthalamic region (MSR) in healthy subjects and in PD patients.Methods
We used DWI acquired at 3T: high resolution acquisition performed in 30 healthy subjects (1.25 mm iso-voxel resolution, TA = 55 min) from Human Connectome Project (HCP) [5], and acquisition clinical research protocol performed in 20 PD patients (1.76 mm iso-voxel resolution TA = 15 min, Siemens Prisma Magnet). HCP data were already pre-processed [6], PD data were pre-processed for the eddy current and susceptibility artefacts [7] using FSL.Fiber orientation distribution were estimated using multi-shell multi-tissue constrained spherical deconvolution [8] with MRtrix. Probabilistic whole-brain tractography was performed with the following parameters: 100 million tracks, step length of 0.1 mm, curvature threshold of 45°, minimum tract length of 6 mm, maximum tract length of 250 mm and fiber orientation distribution amplitude cut-off of 0.1. The spherical-deconvolution informed filtering of tractograms was run with 10 millions streamlines to reduce the reconstruction biases [9]. 78 tracts were extracted between 39 cortical areas, segmented using a Brodmann atlas from MRIcro). The STN was segmented using our in-house 3D histological and deformable atlas of the human basal ganglia [10], and the MSR was segmented manually on a template by anatomical experts and registered to the subjects spaces. Track-density (TD) maps were created for each track [11]. and overlapped with STN and MSR masks to observe the cortical projections onto the subthalamic regions. By using overlapped TD values, we then created connectivity profiles for each voxels located on this regions.Finally, agglomerative clustering was used to classify the voxels profiles of the subthalamic regions (STN and MSR) into 3 clusters.Results
In healthy subjects, we found that the STN receives major inputs from the sensorimotor cortices and little inputs from the limbic cortices, whereas the MSR receives mainly cortical projections from limbic cortices and little from sensorimotor cortices (Figure 1). Weak connections were found between the associative cortices and both the STN and the MSR (Figure 1). A dominant motor cluster was located in the posterolateral STN, a limbic cluster located medially in the MSR, and an intermediate motor-limbic cluster located in between (Figures 2, 3). Similar results were obtained in PD patients. Considering the differences in acquisition parameters between the two cohorts, we could not compare statistically their cluster profiles. We only observed a small difference for the third limbic cluster, which showed predominant connectivity with limbic BA 25 in PD patients, but with both limbic BA 25 and BA 34 in the HCP subjects .Discussion
Our findings, first obtained using high quality datasets from HCP, show differences in cortical connectivity between the STN and MSR, and provide an anatomo-functional gradient with 3 clusters. Similar results were obtained in PD patients using a different acquisition protocol, confirming that our results are coherent and reproducible. Overall, we found that the sensorimotor cortical projections are positively graded from the MSR to the posterolateral STN whereas limbic cortical projections are positively graded from the posterolateral STN to the MSR. Only weak connectivity was found between all associative cortices and both the STN and the MSR. The difference in limbic cluster profiles that was found between the two cohorts might be due to the impact of the image quality on the segmentations in PD patients. A greater PD population size is now needed to improve statistical analysis.Our data confirm that the posterolateral STN is a target to treat PD motor symptoms, and the anteromedial STN is a target to treat resistant obsessive-compulsive disorders. They also provide new evidence that the classical tripartite subdivision of the STN defined by the basal ganglia inputs does not match with the delineation of anatomo-functional territories based on cortical inputs since the associative cortical inputs to the STN were very weak. Differences with literature data may be explained by several methodological considerations, such as segmentation of Brodmann cortical areas, or exclusion masks that we performed to isolate the hyperdirect cortical inputs. Our data also highlight that the MSR, which is a target to treat patients with pathologically violent behavior, receives dense limbic cortical inputs.Conclusions
In the future, the use of each patient MRI with high quality DWI could be helpful to refine individual targeting and help to define the best personalized target for functional neurosurgery.Acknowledgements
This work was supported by ‘Investissements d’avenir’ (Investing in the future programme ANR-10-IAIHU-O6). G. Temiz was supported by the “Fondation pour la Recherche” Médicale (FRM) (Project:DIC20161236441) and by Boston Scientific.References
1. Nambu A, Takada M, Inase M, Tokuno H. Dual somatotopical representations in the primate subthalamic nucleus: evidence for ordered but reversed body-map transformations from the primary motor cortex and the supplementary motor area. J. Neurosci. 1996; 16 (8), 2671–26832. Haynes W, Haber S. The organization of prefrontal subthalamic inputs in primates provides an anatomical substrate for both functional specificity and integration: implications for basal ganglia models and deep brain stimulation. J Neuroscience, 2013; 33:4804–4814.3. Brunenberg EJL, Moeskops P, Backes WH, Pollo C, Cammoun L, Vilanova A, Janssen MLF, Visser-Vandewalle V, Romeny B, Thiran J, Platel B. Structural and Resting State Functional Connectivity of the Subthalamic Nucleus: Identification of Motor STN Parts and the Hyperdirect Pathway. Plos One. 2007.4. Petersen MV, Lund TE, Sunde N, Frandsen J, Rosendal F, Juul N, Ostergaad K. Probabilistic versus deterministic tractography for delineation of the cortico-subthalamic hyperdirect pathway in patients with Parkinson disease selected for deep brain stimulation. J Neurosurg. 2016; 8:1–12.5. Essen V, Smith SM, Barch DM, Behrens TE, Yacoub E, Ugurbil K. The WU-Minn Human Connectome Project : An overview. NeuroImage. 2013; 80:62-796. Sotiropoulos, S.N., Jbabdi, S., Xu, J., Andersson, J.L., Moeller, S., Auerbach, E.J., Glasser, M.F., Hernandez, M., Sapiro, G., Jenkinson, M., Feinberg, D.A., Yacoub, E., Lenglet, C., Van Essen, D.C., Ugurbil, K., Behrens, T.E.J., WU-Minn HCP Consortium, 2013. Advances in diffusion MRI acquisition and processing in the human connectome project. NeuroImage 80, 125–1437. Andersson, J.L.R., Sotiropoulos, S.N., 2016. An integrated approach to correction for off- resonance effects and subject movement in diffusion MR imaging. NeuroImage 125, 1063–1078. http://dx.doi.org/10.1016/j.neuroimage.2015.10.0198. Dhollander T, Raffelt D, Connelly A. Unsupervised 3-tissue response function estimation from single-shell or multi-shell diffusion MR data without a co-registered T1 image. ISMRM Workshop on Breaking the Barriers of Diffusion MRI, 2016, 5.9. Smith RE, Tournier JD, Calamante E, Connelly A. SIFT: Spherical-deconvolution informed filtering of tractograms. NeuroImage. 2013;67:298-312.10. Bardinet E, Bhattacharjee M, Dormont D, Pidoux B, Malandain G, Schüpbach M, Ayache N, Cornu P, Agid Y, Yelnik J. A three-dimensional histological atlas of the human basal ganglia. II. Atlas deformation strategy and evaluation in deep brain stimulation for Parkinson disease. J. Neurosurg. 2009;110, 208–219.11. Calamante F, Tournier JD, Jackson GD, Connelly A. Track-density imaging (TDI): Super-resolution white matter imaging using whole-brain track-density mapping. NeuroImage. 2010;53, 1233-1243Figures
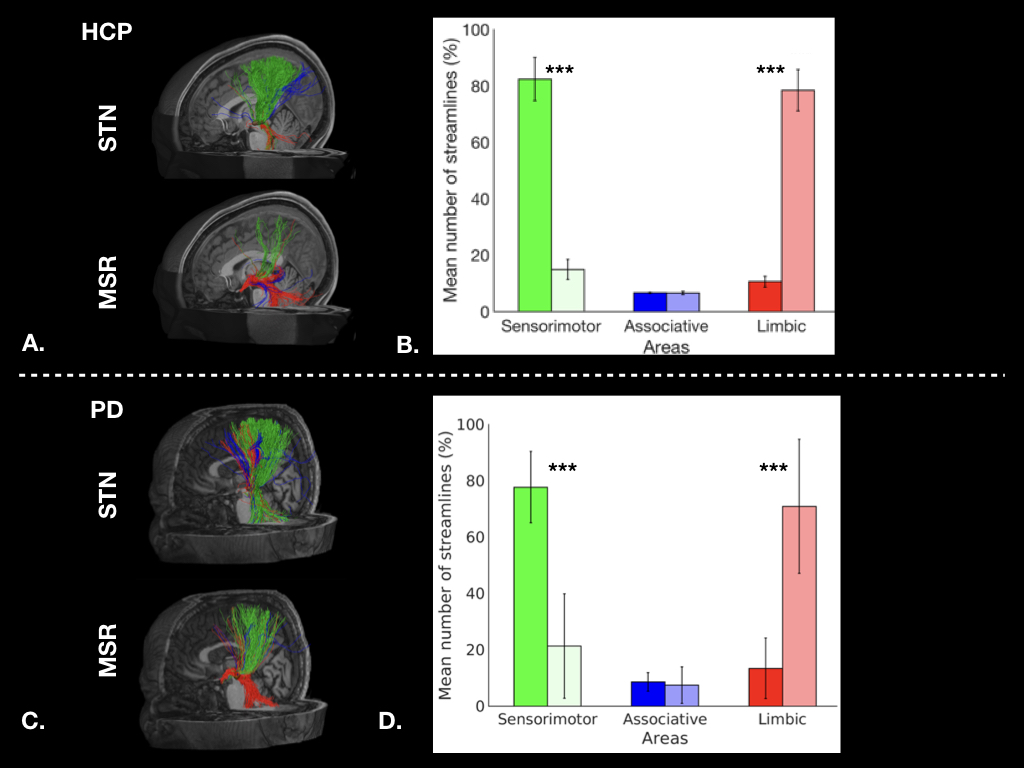
Figure 1: Cortical streamlines for STN and MSR: A. for a HCP subject, and C. for a PD patient. Histograms for HCP dataset (B.) and for PD dataset (D.) showing averaged connectivity of different cortical areas to the STN and MSR. The percentages of mean streamline numbers connecting the different sensorimotor (green), associative (blue) and limbic (red) cortical areas to the STN (dark bars) and to the MSR (bright bars) are shown for the left hemisphere (LH).
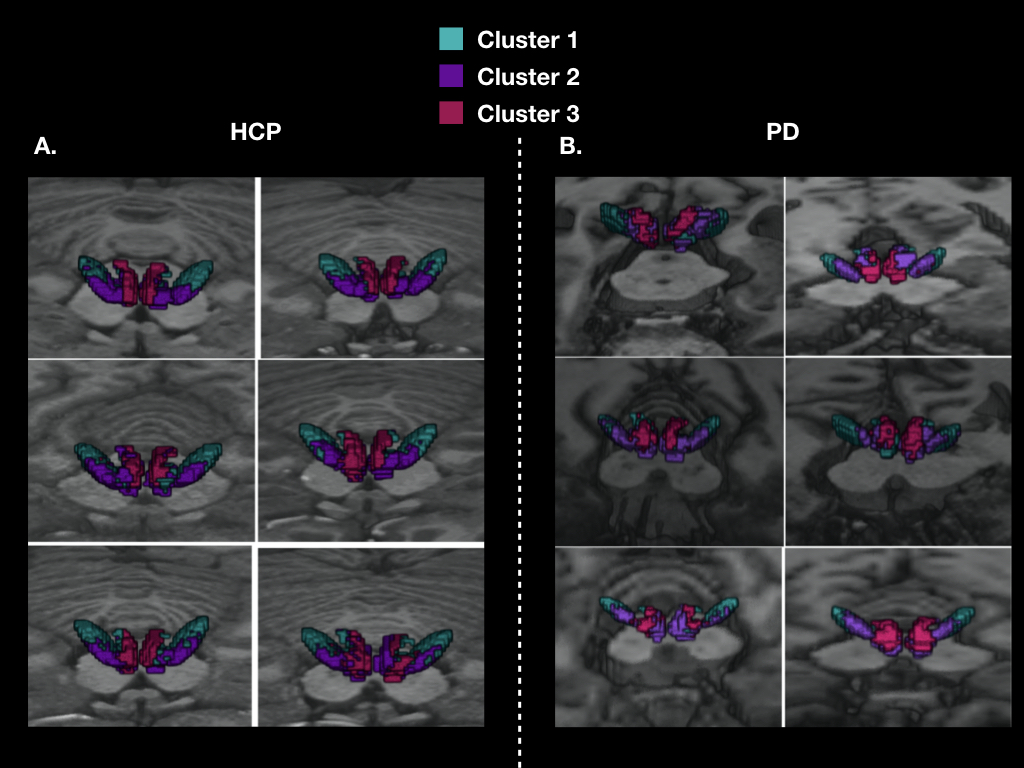
Figure 2: 3D localization of the three cortical clusters in both the STN and MSR in native spaces A. for 6 HCP subjects, and B. for 6 PD patients
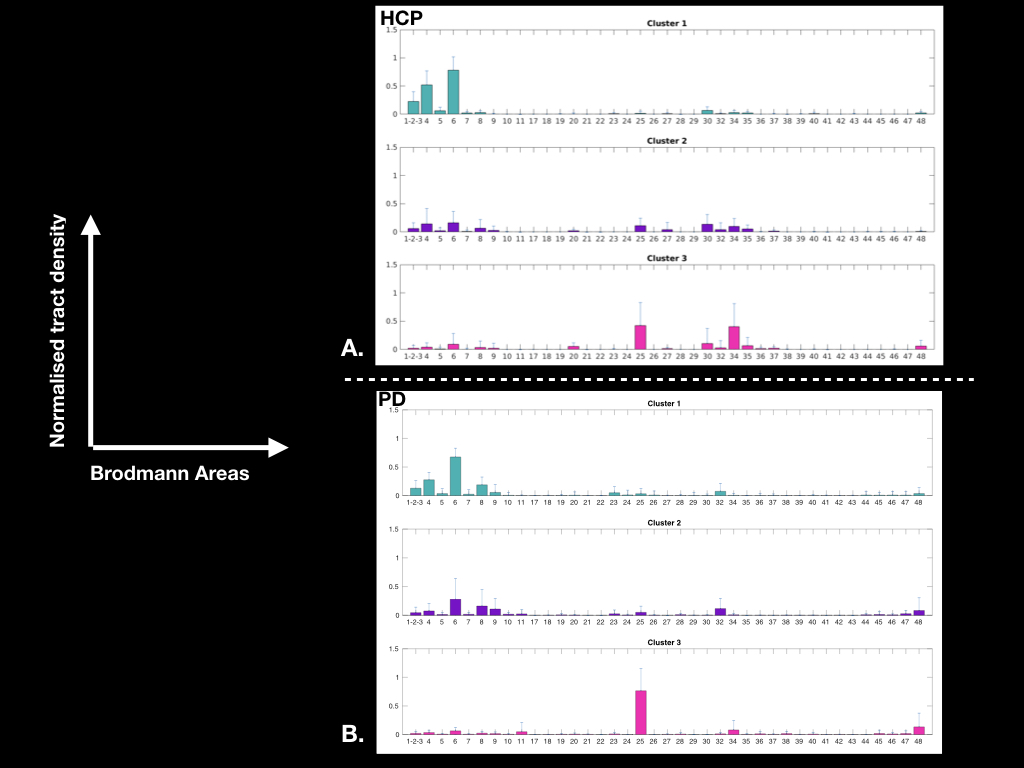
Figure 3: Graphs showing the average cluster profiles: A. for 30 HCP subjects (left hemisphere), and B. for 20 PD patients (left hemisphere)