4522
Along-tract correlation analysis of diffusion metrics and white matter lesions in a 70-year old birth cohort1King's College London, London, United Kingdom, 2University College London, London, United Kingdom, 3Massachusetts General Hospital, Boston, MA, United States
Synopsis
In a population of 260 elderly individuals presenting white matter hyperintensities of presumed vascular origin, lesion profile along reconstructed tracts correlated strongly with diffusion metrics obtained from multishell acquisition (notably intracellular volume fraction, orientation dispersion index, axial radial and mean kurtosis). Results appeared stronger when the tractography was performed using data from the highest b-value. Furthermore, changes to the diffusion signal was observed consistently on the reconstructed tracts at the vicinity of the lesions potentially indicative of tissue vulnerability beyond the lesion border identified from FLAIR images.
Introduction
White matter hyperintensities (WMH) of presumed vascular origin are commonly observed in ageing populations, with a prevalence above 80% in people over 601. The structural contrast of T2-weighted MR images is known to be non-specific to the lesion characteristics, while microstructural interpretation of the signal change is still poorly understood. In this work we investigated i) the correlation between diffusion derived metrics and the presence of lesions along 18 reconstructed WM bundles and ii) the sensitivity of diffusion measures in regions proximal to the lesions. The latter analysis is motivated by the hypothesis that microstructural changes surrounding lesions are undetectable using macrostructural MR imaging (T1, FLAIR).Methods
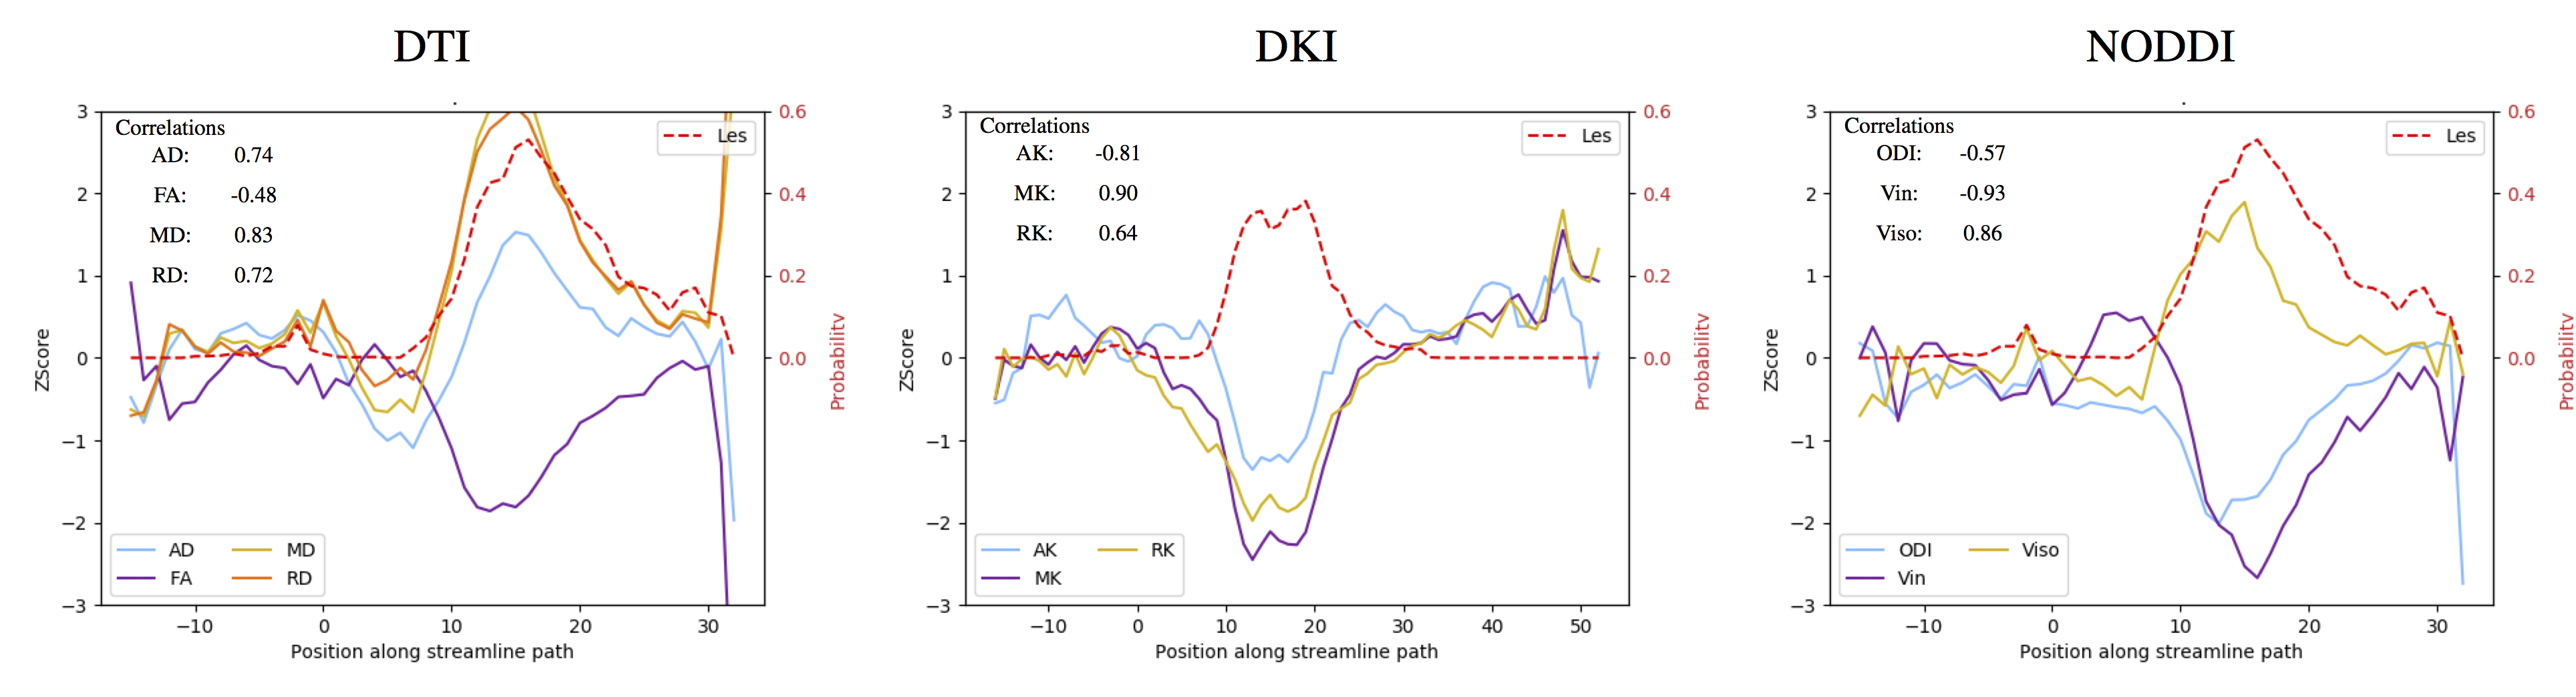
Participants come from Insigh46, a neuroscience sub-study of the MRC National Survey of Health and Development (NSHD; the British 1946 birth cohort)”2. Each participant underwent 3T MRI imaging that included volumetric T1-weighted and T2-FLAIR (1.1mm isotropic), as well as multi-shell DWI (b=700, 36 directions, b=2000, 64 directions, 2.5mm isotropic). WMH were automatically segmented using a Gaussian mixture framework (BaMoS)3. Eighteen WM bundles were reconstructed using TRACULA4 using the anatomical information extracted from the T1 data using the geodesic information flows framework5. After pre-processing, tractography was performed using either one or both shells. The following diffusion metrics were computed using the multi-shell data: diffusion tensor-based metrics (axial (AD), radial (RD), mean diffusivity (MD) and fractional anisotropy(FA)), diffusion kurtosis6 (axial(AK), radial(RK) and mean kurtosis(MK)) using Dipy7, and NODDI8 (intraneurite volume fraction (Vin), orientation dispersion index (ODI) and free water volume fraction (Viso)). There were 260 participants with usable tractography in all configurations, of which 39 were identified as lesion free. Subject-specific Z-Score maps for all derived diffusion metrics were created using the maps of the lesion-free subjects as normative database. Non linear registrations to the subject space were obtained from NiftyReg9. For each participant, tracts were individually investigated by gathering the streamlines crossing lesions and paths aligned to the tract mid-point. Profiles of lesion probability profile and of microstructural measure were generated by averaging each measure across relevant streamlines at successive cross-sections of the tract (see Figure 2 as an example); and the Pearson correlation between lesion burden and microstructure profile was derived. For each tract, the Cohen’s D measures of effect size for the population were calculated weighted by the lesion burden of each participant, excluding for each subject tracts with a lesion burden below 10 voxels. To assess the changes of diffusion metrics along the tracts proximal to the lesions, two probabilistic dilation zones (1 iteration: first crown, 2 iterations: 2nd crown) were further considered. Cohen’s D effect sizes were calculated over the Z-score maps in the three identified zones for each of the reconstructed tracts.Results
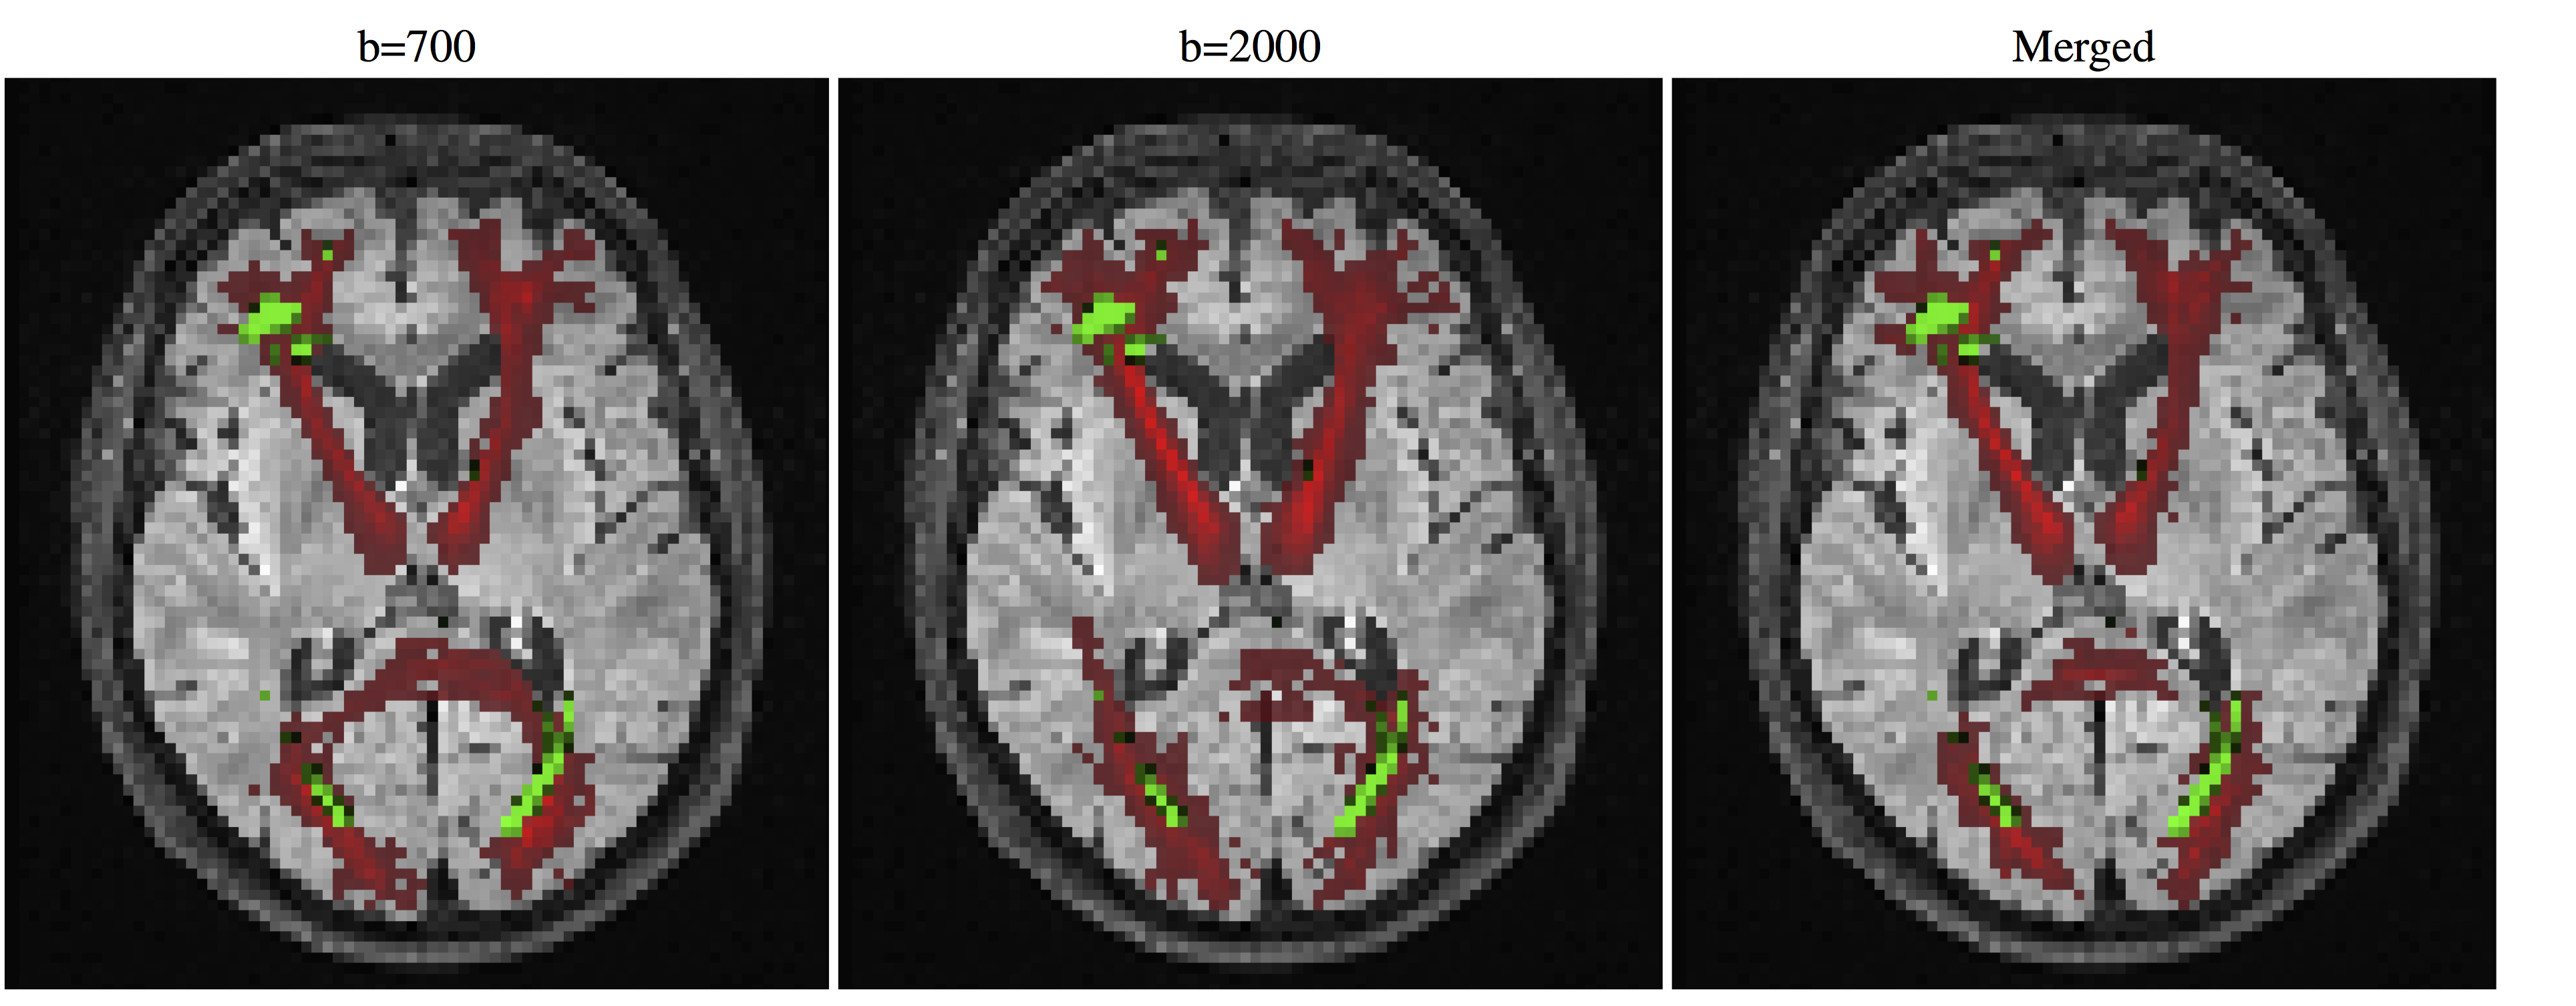
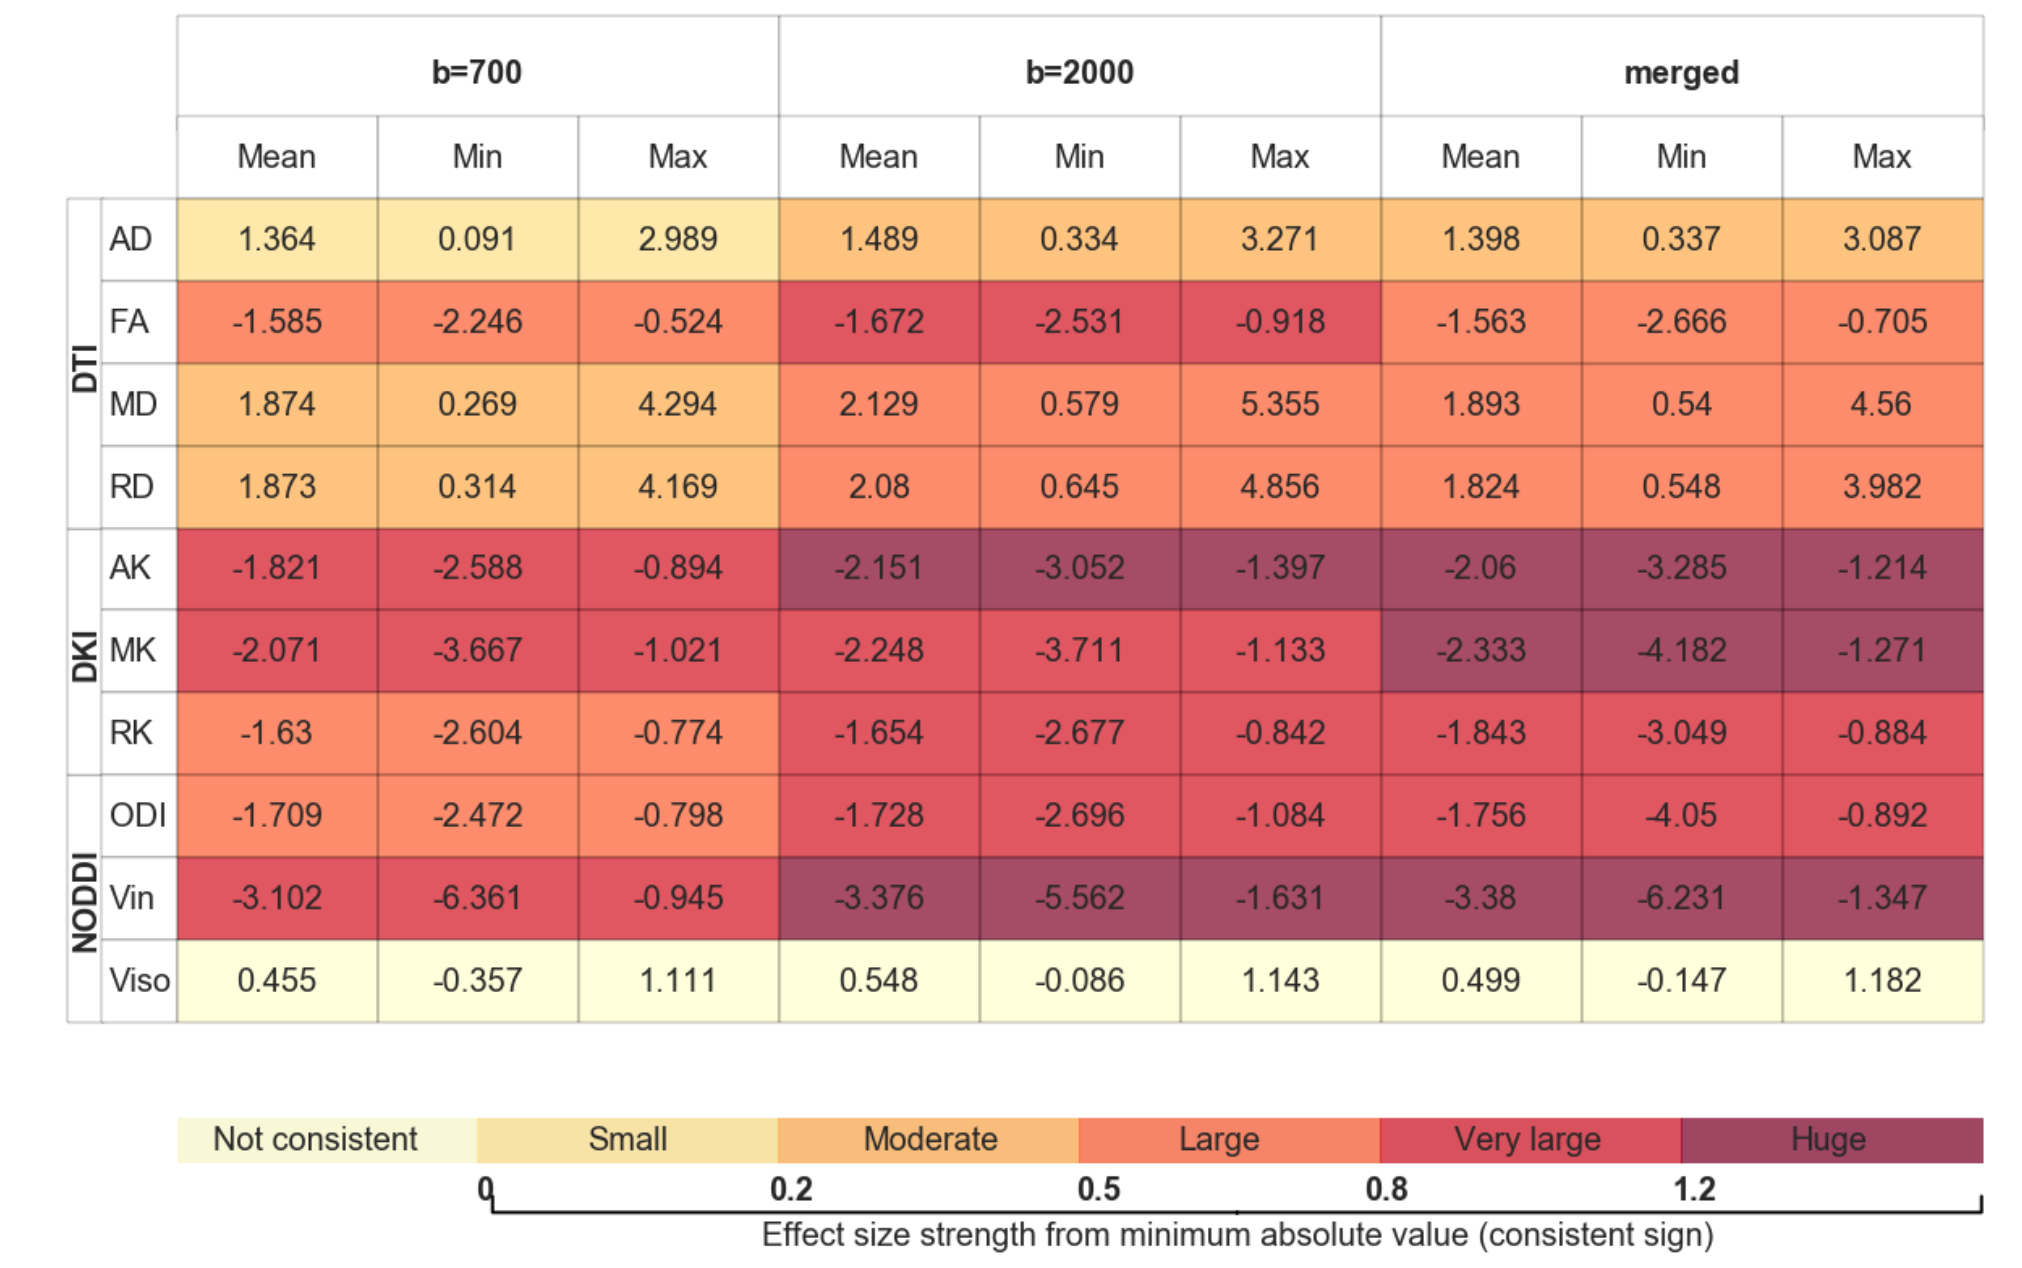
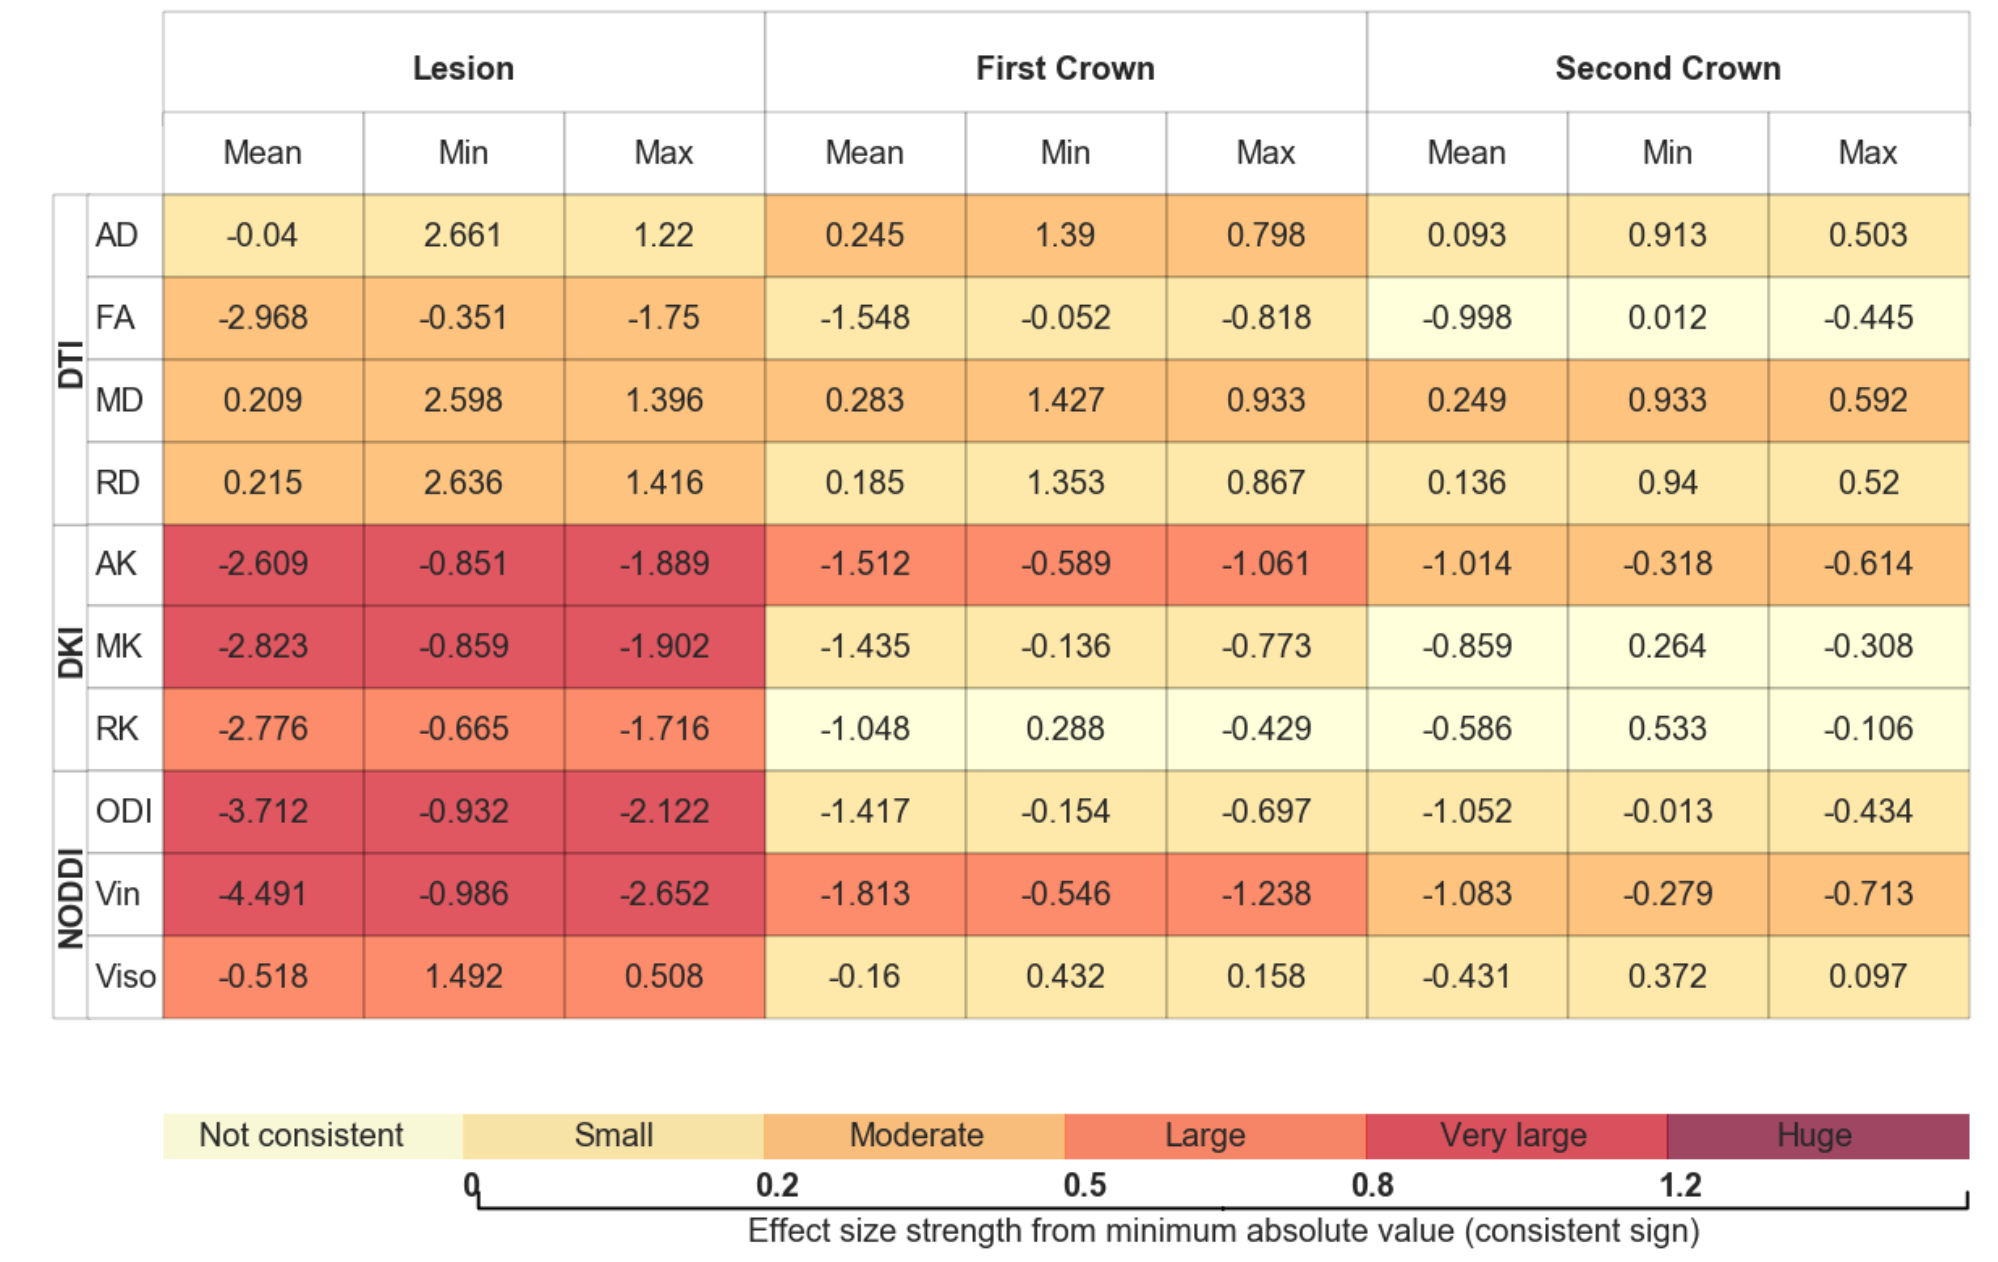
Figure 1 shows an example of the lesion maps overlaid onto the probability maps of selected reconstructed tracts for the three possible tractography configurations. Table 1 presents for the different tractography configurations the Cohen's D effects size of the correlation averaged across the 18 bundles, as well as the observed range; it shows that despite a slight increase in the range, reconstructions using b=2000 yielded stronger lesion-diffusion profile correlation effects. Multi-shell extracted metrics, in particular intra-neurite volume fraction, RK, and MK, appeared to be locally strongly correlated with the presence of lesions. Table 2 presents the evolution of the effect across the first and second crown for the different metrics on the tracts reconstructed using both shells showing different patterns of abnormality with distance to the lesion. For instance, the abnormality in intra-neurite volume fraction steadily decreased with distance from the lesion, but a moderate to large effect remained noticeable even 5 mm (2 dilation iterations with voxel size 2.5mm) away from the lesion border, as defined from FLAIR images. In turn, while on average a similar decreasing effect was observed for tensor-derived metrics (MD, RD and FA), the variation in effect size strength across bundles was larger.Discussion
Overall, performing the analysis with the tracts reconstructed including data acquired at the highest b-value yielded slightly more consistent results across tracts. In addition to the increased coverage of the sphere of directions at b=2000 and when combining the two acquisitions, this could be due to the reduced uncertainty in orientation distributions with b=2000 data and hence increased sharpness of the tract probability maps. Many of the multi-shell diffusion metrics based on diffusion kurtosis and NODDI appeared to be sensitive to both the presence of a lesion across all reconstructed tracts, as well as abnormal changes at the periphery of the lesions. Tensor-derived metrics (FA and MD) were sensitive to the lesions but had increased variability in the effect size. This could potentially be due to their non-lesion-related dependence on complex microstrucural architecture (crossing, kissing, fanning fibres).Conclusion
Microstructural measures derived from multi-shell data show abnormal changes correlating well with the presence of the lesions as defined in FLAIR images, but also in the vicinity of these lesions, along all reconstructed white matter tracts. Further work is needed to assess if such metrics could be used to describe or predict the longitudinal development of white matter lesions of presumed vascular origin along the brain pathways in the ageing population.Acknowledgements
This work received funding from the Alzheimer’s Society (AS-JF-17-011), King’s College London Global Mobility fund, Alzheimer’s Research UK, Wellcome/EPSRC Centre for Medical Engineering [WT 203148/Z/16/Z], the Medical Research Council Dementias Platform UK, and the Wolfson Foundation ( award PR/ylr/18575), UCL Hospitals Biomedical Research Centre, Wellcome Trust (WT213038/Z/18/Z) . Further acknowledgments go to the Insight46 support team and the study participants.References
[1] F.-E. E. de Leeuw et al., “Prevalence of cerebral white matter lesions in elderly people: a population based magnetic resonance imaging study. The Rotterdam Scan Study,” J. Neurol. Neurosurg. Psychiatry, vol. 70, no. 1, pp. 9–14, Jan. 2001.
[2] C. A. Lane et al., “Study protocol: Insight 46 – a neuroscience sub-study of the MRC National Survey of Health and Development,” BMC Neurol., vol. 17, no. 1, p. 75, Dec. 2017.
[3] C. H. Sudre, M. J. Cardoso, W. H. Bouvy, G. J. Biessels, J. Barnes, and S. Ourselin, “Bayesian Model Selection for Pathological Neuroimaging Data Applied to White Matter Lesion Segmentation,” IEEE Trans. Med. Imaging, vol. 34, no. 10, 2015.
[4] A. Yendiki et al., “Automated probabilistic reconstruction of white-matter pathways in health and disease using an atlas of the underlying anatomy,” Front. Neuroinform., vol. 5, p. 23, Oct. 2011.
[5] M. J. Cardoso et al., “Geodesic Information Flows: Spatially-Variant Graphs and Their Application to Segmentation and Fusion,” IEEE Trans. Med. Imaging, vol. 34, no. 9, pp. 1976–1988, Apr. 2015.
[6] Wu EX, Cheung MM. “MR diffusion kurtosis imaging for neural tissue characterization”. NMR Biomed vol 23: pp836–848 . July 2010;
[7] E. Garyfallidis et al., “Dipy, a library for the analysis of diffusion MRI data,” Front. Neuroinform., vol. 8, no. FEB, Feb. 2014.
[8] H. Zhang, T. Schneider, C. A. Wheeler-Kingshott, and D. C. Alexander, “NODDI: Practical in vivo neurite orientation dispersion and density imaging of the human brain,” 2012.
[9] M. Modat et al., “Fast free-form deformation using graphics processing units.,” Comput. Methods Programs Biomed., vol. 98, no. 3, pp. 278–284, Jun. 2010.
Figures