4519
Fourier analysis of dynamic diffusion changes during cardiac cycle in idiopathic normal pressure hydrocephalus1Graduate School of Medical Sciences, Kanazawa University, Kanazawa, Japan, 2Nagoya City University Hospital, Nagoya, Japan
Synopsis
In this study, we evaluated the frequency characteristics of the apparent diffusion coefficient (ADC) wave form in the cardiac cycle of the brain in idiopathic normal pressure hydrocephalus (iNPH). iNPH is associated with higher ADC amplitude with a wide frequency range. The Fourier analysis of ADC change in the cardiac cycle in iNPH makes it possible to noninvasively obtain a more detailed information regarding the intracranial state in iNPH.
Introduction
The apparent diffusion coefficient (ADC) of brain parenchyma significantly changed during the cardiac cycle despite the minimized bulk motion effect.1 We revealed that the maximum ADC change in the cardiac cycle (ΔADC) in patient with idiopathic normal pressure hydrocephalus (iNPH) was significantly higher than that in healthy subjects.2, 3 However, the mechanism and properties underlying the higher ΔADC in iNPH have not been completely clarified because only ΔADC was assessed in the previous studies. Therefore, we hypothesized that Fourier analysis of ADC wave form in the cardiac cycle increases the amount of information regarding ADC changes in iNPH. In this study, we evaluated the frequency characteristics of the ADC wave form in the cardiac cycle of the brain in iNPH.Materials and methods
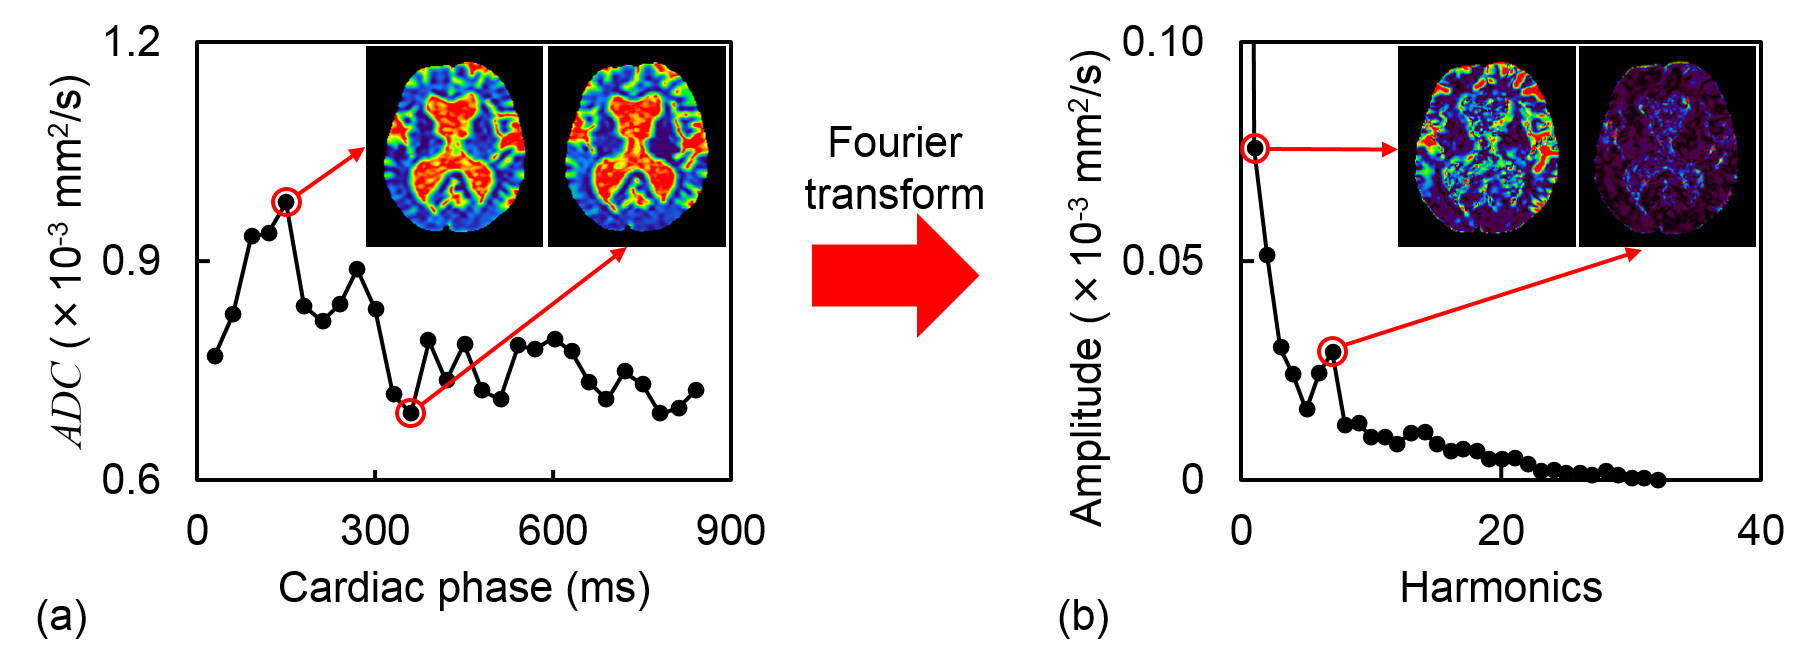
This study included 17 patients with iNPH (iNPH group; mean age, 77.2 ± 4.1 years), and nine healthy volunteers (control group; mean age, 71.0 ± 6.4 years). The purpose and protocol of our investigation were explained to all the patients, and the studies were performed only after informed consent was obtained from each patient. Using a 1.5-T MRI (Gyroscan Intera, Philips Medical Systems), ECG-synchronized single-shot diffusion echo-planer imaging was performed to acquire transverse multiphase diffusion weighted images at the basal ganglion level. The DWI scanning parameters were set as follows: echo time, 100 ms; repetition time, two R-R intervals; field of view, 256 mm; imaging matrix, 64 × 64; section thickness, 2 mm; b-values, 0 and 1000 s/mm2; half-scan factor, 0.6; and parallel imaging factor, two. The ADC maps of all the cardiac phases were constructed, and a Fourier transform was conducted on the pixel-by-pixel basis (Fig. 1). Then, the amplitudes and phases of the ADC in each frequency (from direct current to the seventh harmonic) in the frontal white matter, a critical region in iNPH, were assessed in both the groups. A P value of <0.05 was considered significant.Results and discussion
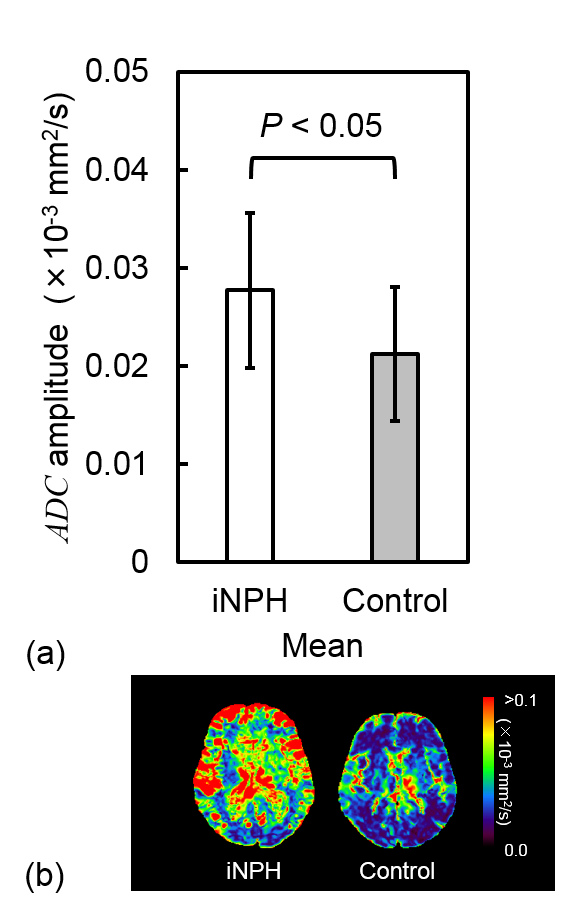
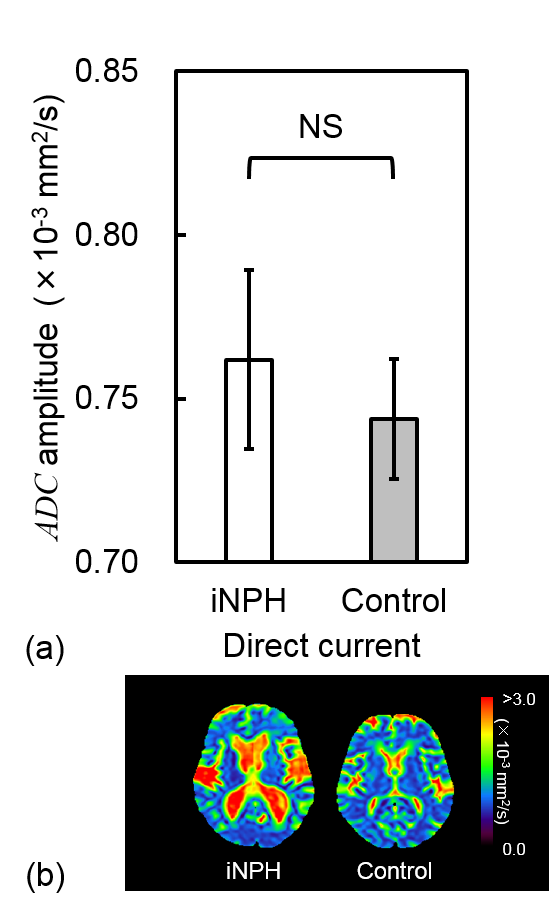
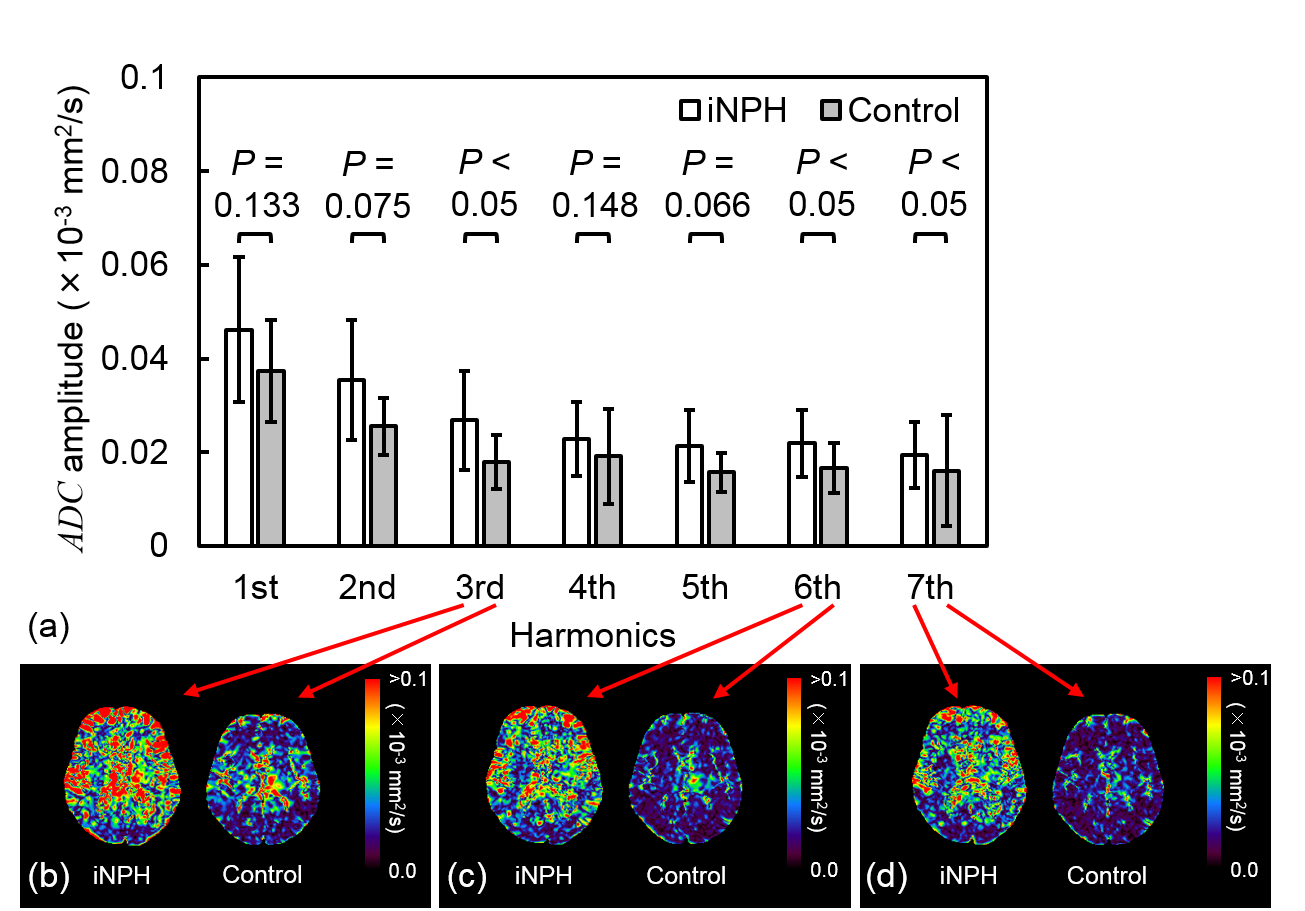
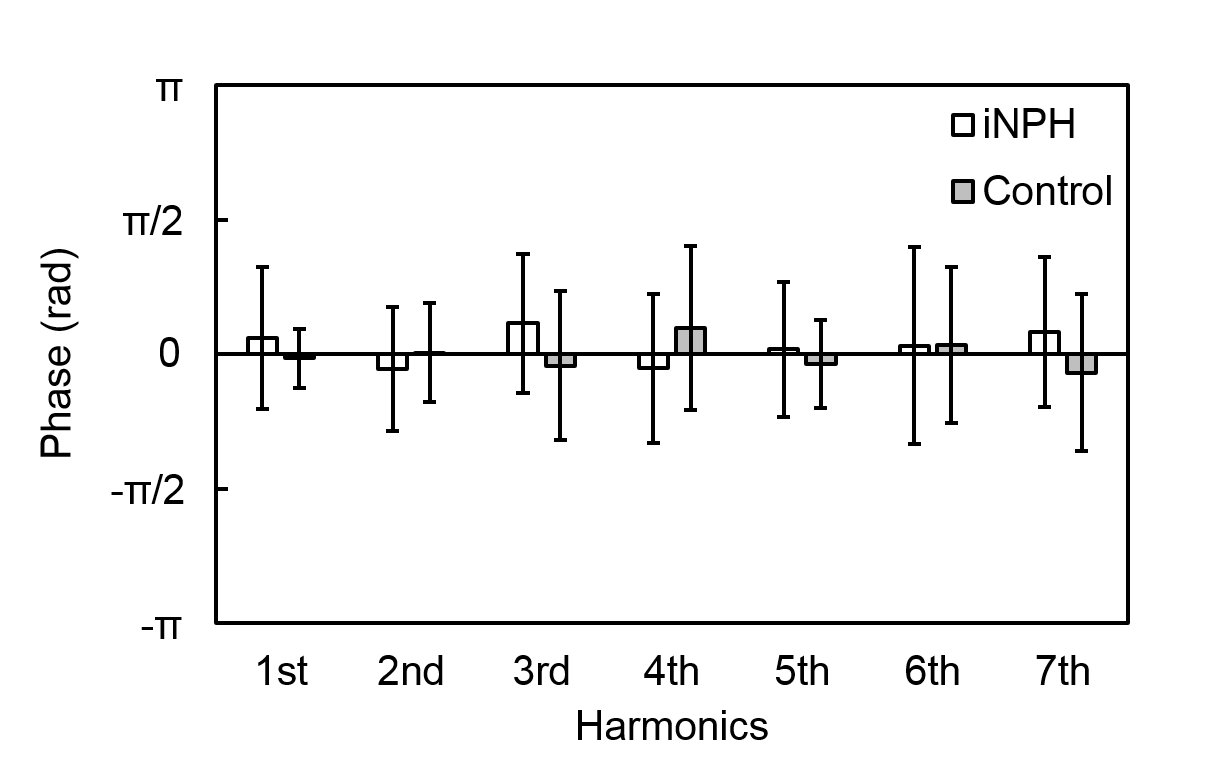
The mean ADC amplitude from the first to the seventh harmonic in the iNPH group was significantly higher than that in the control group (Fig. 2). We considered that decrease in intracranial compliance4 and increase in amount of water in the extracellular space5 in iNPH rendered the water molecular fluctuation greater, and the mean ADC amplitude higher. However, no significant difference was found in the ADC of the direct current between the iNPH and control groups (Fig. 3). These results suggest that the frequency analysis of ADC changes in the cardiac cycle provides additional diagnostic information regarding the fluctuation of the water molecules in the brain in iNPH when only the result of ADC analysis remains normal. In addition, a more robust ADC value can be obtained from the direct current component, because ADC changes, alternating current components, are excluded. The ADC amplitudes of the third, sixth, and seventh harmonics in the iNPH group were significantly higher than those in the control group (Fig. 4). The higher ADC amplitudes at a wide frequency range in the iNPH group indicate water molecules of the brain fluctuated by instantaneous power such as arterial pulsations as the driving force. However, there was no significant difference all of the phases between iNPH and control groups (Fig. 5).Conclusion
iNPH is associated with higher ADC amplitude with a wide frequency range. The Fourier analysis of ADC change in the cardiac cycle in iNPH makes it possible to noninvasively obtain a more detailed information regarding the intracranial state in iNPH.Acknowledgements
No acknowledgement found.References
1. Nakamura T, Miyati T, Kasai H, et al., Bulk motion-independent analyses of water diffusion changes in the brain during the cardiac cycle. Radiol Phys Technol. 2009; 2: 133-7.
2. Ohno N, Miyati T, Mase M, et al., Idiopathic normal-pressure hydrocephalus: temporal changes in ADC during cardiac cycle. Radiology. 2011; 261: 560-5.
3. Takatsuji-Nagaso M, Miyati T, Ohno N, et al., Hemodynamically self-corrected ΔADC analysis in idiopathic normal pressure hydrocephalus. Br J Radiol. 2019; 92: 20180553.
4. Miyati T, Mase M, Kasai H, et al., Noninvasive MRI assessment of intracranial compliance in idiopathic normal-pressure hydrocephalus. J Magn Reson Imaging. 2007; 26: 274-8.
5. Bradley WG Jr, Bahl G, Alksne JF. Idiopathic normal pressure hydrocephalus may be a "two hit" disease: benign external hydrocephalus in infancy followed by deep white matter ischemia in late adulthood. J Magn Reson Imaging. 2006; 24: 747-55.
Figures