4515
Are DKI Measures Relatively More Sensitive In Identifying HIV Infection Related Pathologies Than DTI Measures?1Postgraduate Institute of Medical Education and Research,, Chandigarh, India, 2University of Miami, Miami, FL, United States
Synopsis
DTI has shown evidence of alterations to the micro-structural integrity of the brain due to infection from HIV. However this finding is not consistent across all studies. In this work, we compare metrics obtained from DTI and diffusion kurtosis imaging (DKI) to determine if DKI can provide a more reliable and sensitive measurement of structural integrity.
Introduction
Human immunodeficiency virus (HIV) enters the brain early in the course of infection leading to low-level inflammation and alterations to the micro-structural integrity of the brain that is suspected to be associated with mild-to-moderate neurocognitive disorders in individuals with HIV infection. Multiple studies have identified altered brain micro-structure due to HIV infection using diffusion tensor imaging (DTI) derived metrics1. Yet this finding is not consistent across the literature as several studies also reported near normal structural integrity in HIV+ individuals2. There have been efforts to look at diffusion kurtosis imaging (DKI) derived metrics as a measure of tissue integrity in HIV infection. Since DKI is a better descriptor of the non-Gaussian diffusion that occurs in tissue water3,4, the goal of this study is to determine if DKI derived metrics can provide a more reliable and sensitive measurement of alterations to the micro-structure of the brain due to HIV infection.Methods
Data were collected at the Post Graduate Institute of Medical Education & Research (PGIMER) in India from 150 volunteers with 81 Clade-C HIV+ subjects (55/26 male/female; age: 32.23 ± 6), and 62 HIV- individuals as a control group (41/21 male/female; age: 29.6 ± 7). We acquired whole-brain diffusion-weighted MRI on a 3T Siemens scanner, and collected 9 b0 and 60 dual-shell (b = 1000/2000 s/mm2) DW-images using 30 gradient directions per shell for DTI and DKI analysis using the following parameters: 1.5 × 1.5 × 3.0 mm3 spatial resolution, TR = 1150 ms, TE = 98 ms, 54 axial slices. We also acquired T2 images that was used for extraction of the brain in images. We first use FSL’s eddy correction tool on the DW images, then co-register the resulting images to the first b0 as a reference. FSL’s Brain Extraction (BET) tool is applied on the T2 images to obtain brain masks that are subsequently registered and applied on the DW data. DTI and DKI tensor fitting was performed using the DIPY software6. From which, we obtain the relevant DTI and DKI parametric maps, i.e. the fractional anisotropy (FA), mean, axial, and radial diffusivity (MD, AD, RD), kurtosis fractional anisotropy (kFA), and mean, axial, and radial kurtosis (MK, AK, RK). We analyzed the data at the whole-brain level using the JHU-MNI-SS-type1 atlas7 containing 176 regions of interest (ROI), separated between grey matter (GM) and white matter (WM). We evaluated the metrics at each ROI, and applied an F-test to find significant differences between the control and HIV+ individuals, with a significance threshold set at p < 0.05 corrected for multiple comparisons using Bonferroni (α = 0.05/88 = 5.682 × 10⁻⁴). Finally, we compare the between-group percentage differences and count the number of regions with significant differences for each metric.Results
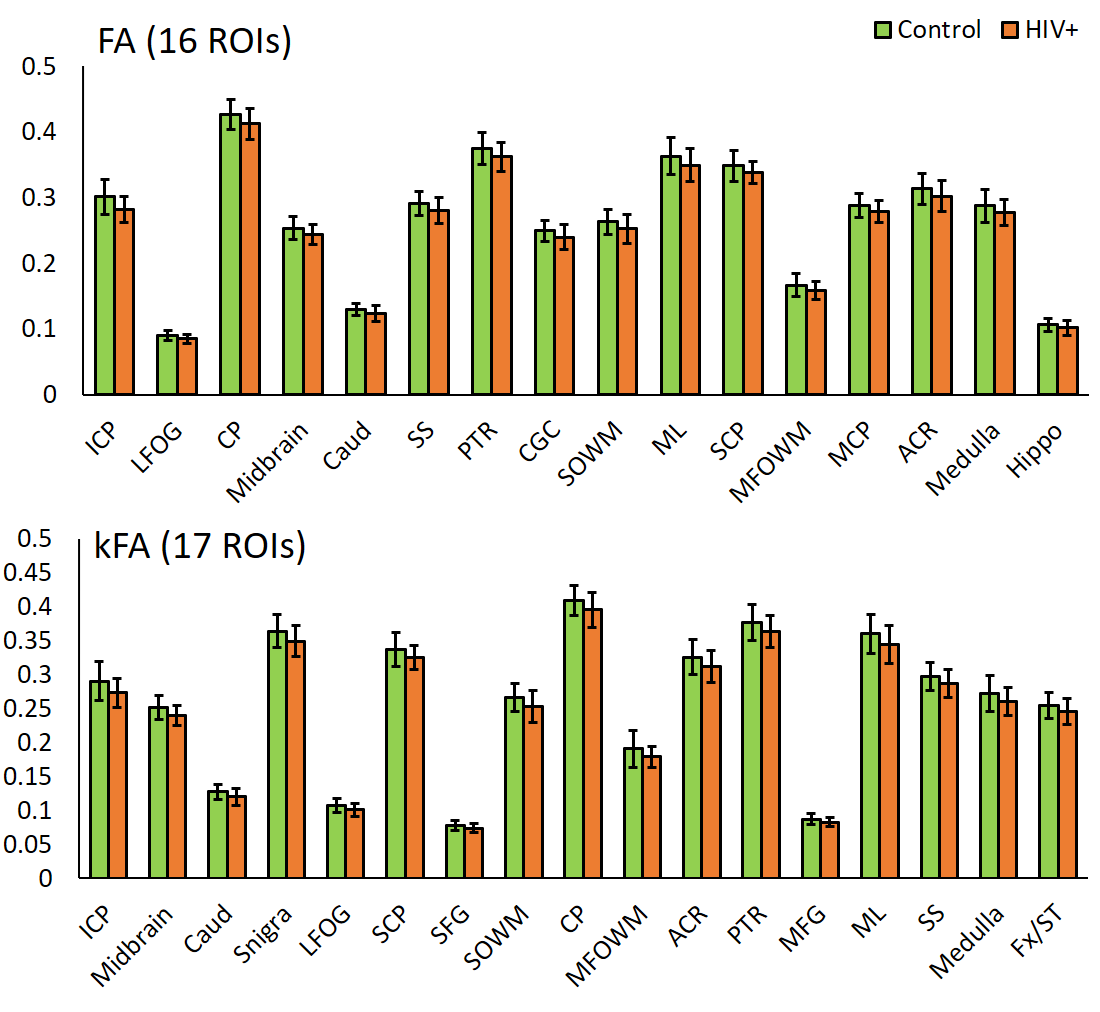
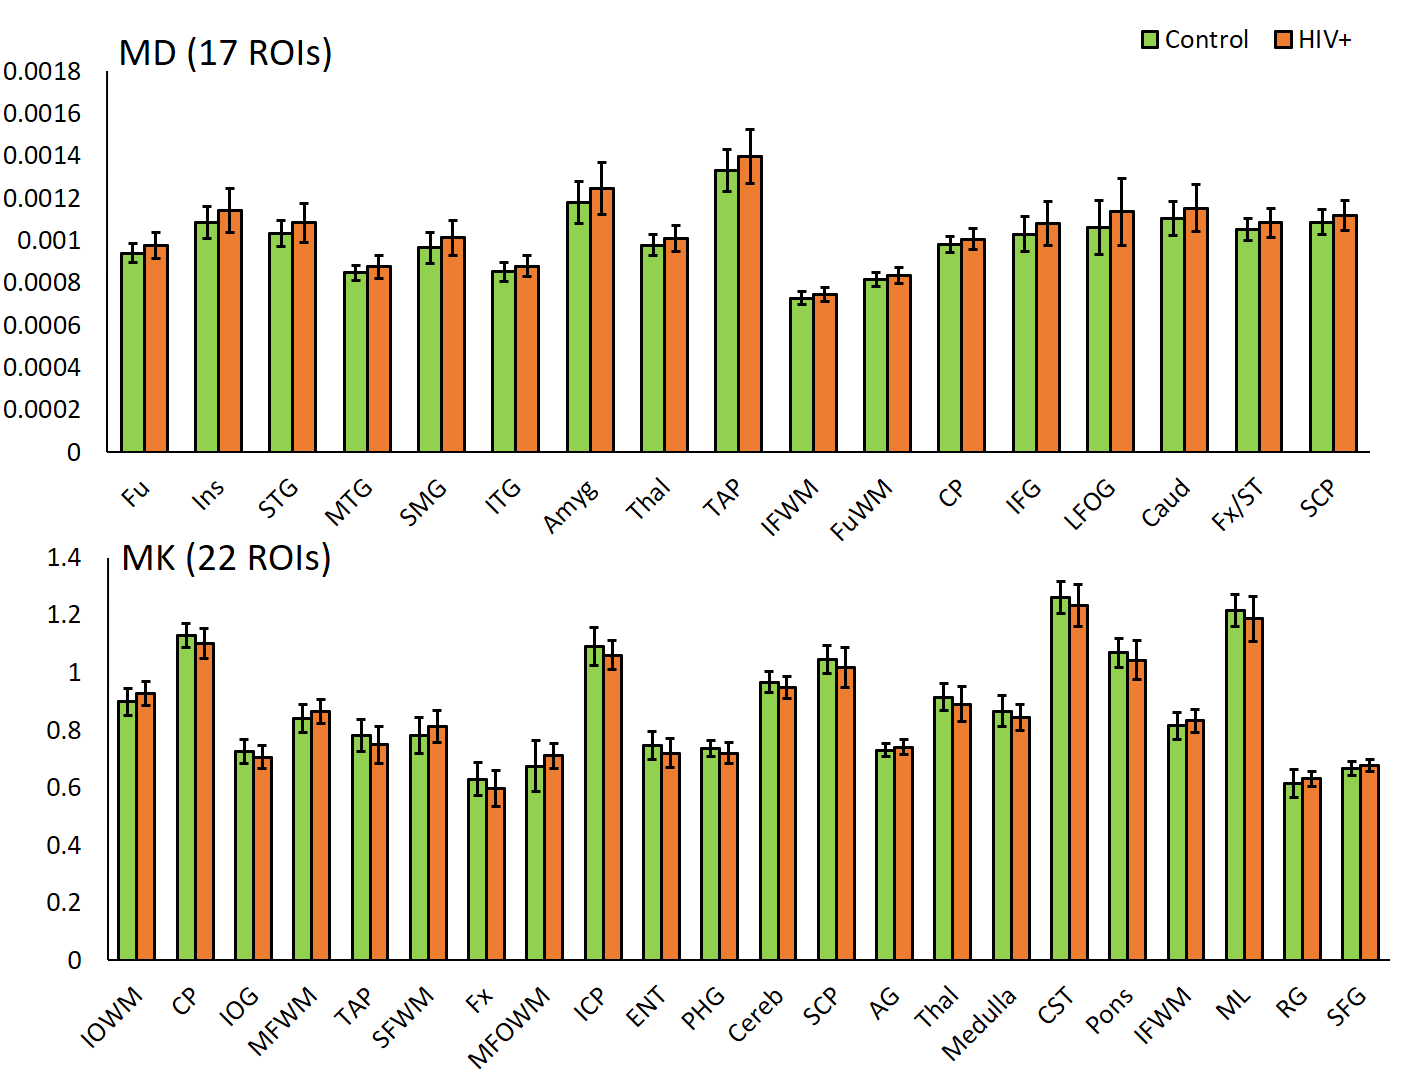
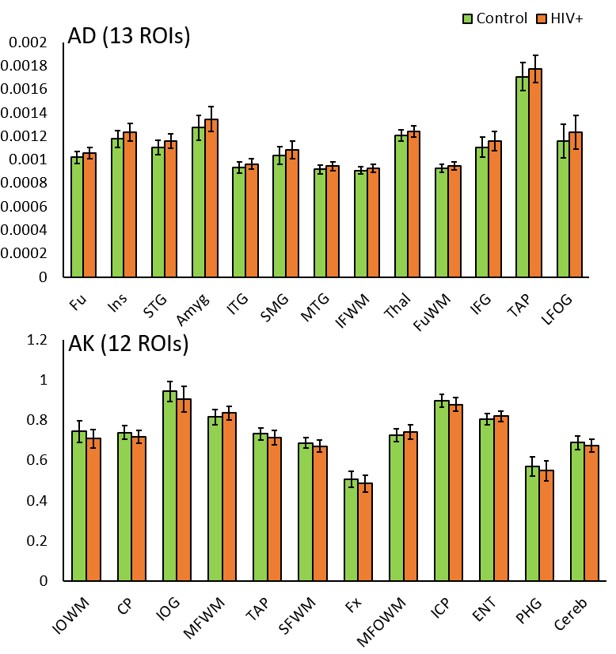
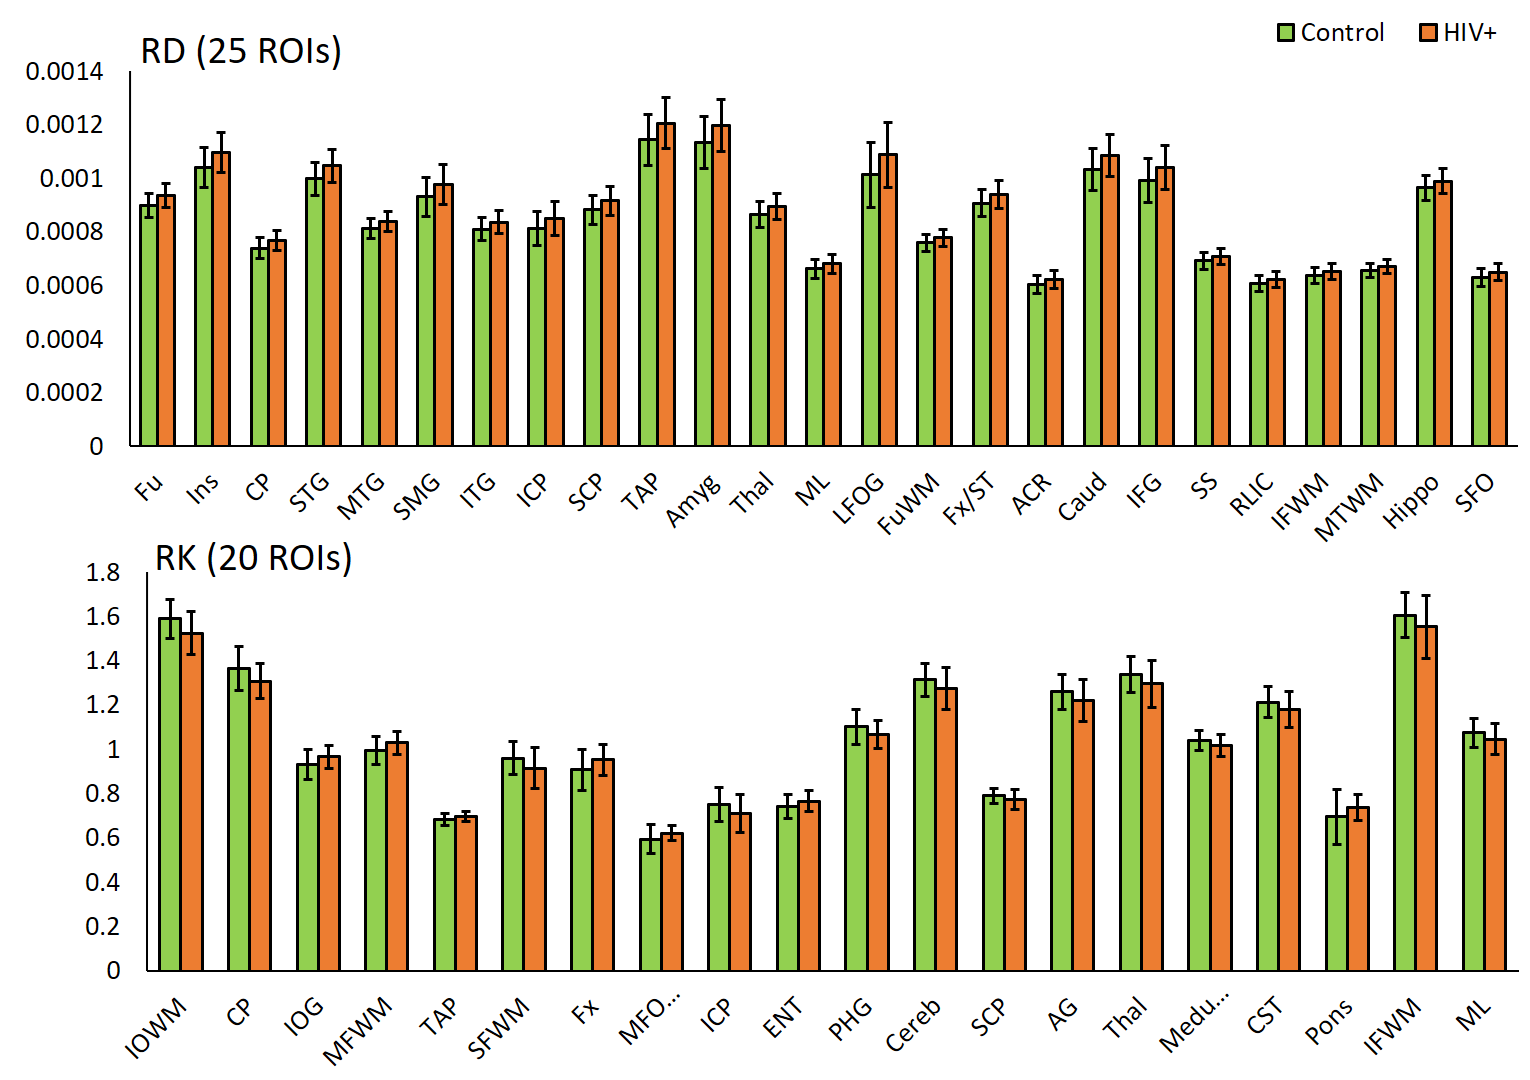
DTI derived metrics show a consistent trend across multiple regions with a decrease in FA in 16 ROIs (Fig. 1) and an increase in MD, AD, and RD in 17, 13, and 25 ROIs, respectively (Figs. 2-4) for the HIV+ group. These changes are observed mainly in WM and deep GM regions. For DKI metrics, we observed a decrease in kFA for HIV+ subjects in 17 brain regions (Fig. 1). For MK, AK, and RK, We observed a significant decrease for MK, AK and RK in 22, 12, and 10 ROIs, respectively. However, we noted an increase in some ROIs located at the boundary between WM and cortical GM. Between-group percentage differences for the metrics are: FA 3.8%, MD 3.19%, AD 3.46%, RD 3.54%, kFA 4.39%, MK 2.89%, AK 3.03%, RK 3.59%.Conclusion
For DTI, uniform trends of significantly decreased FA and increased diffusivity measures across all ROIs in HIV+ group are an indication of axonal damage due to HIV infection. This result is in agreement with most reports published. In comparison, kFA also shows a decreasing trend in all regions, and has the highest between-group percentage difference and a larger number of ROIs showing significant changes than FA. This result indicates that kFA may be more sensitive to micro-structural damage and pathologies related HIV. On the other hand, MK, AK, and RK seem to be less consistent and have a lower percentage difference compared to DTI metrics. This may be due to regions near the cortical GM, and would require re-evaluation of DKI metrics at WM regions only by excluding cortical GM contribution for analysis.Acknowledgements
Funding from NIH grant, R01 NS094043.References
1. Hoare J, et al. Clinical associations of white matter damage in cART-treated HIV-positive children in South Africa. J Neurovirol;2015;21(2):120-128.
2. O’Connor E, et al. Reliability of White Matter Microstructural Changes in HIV Infection: Meta-analysis and Confirmation. AJNR Am J Neuroradiol;2017;38(8):1510-1519.
3. Jensen JH, et al. Diffusional kurtosis imaging: the quantification of non-Gaussian water diffusion by means of magnetic resonance imaging. Magn Reson Med 2005;53(6):1432-1440.
4. Jensen JH and Helpern JA. MRI quantification of non-Gaussian water diffusion by kurtosis analysis. NMR in Biomedicine 2010;23(7):698-710.
5. Garyfallidis E, et al. DIPY, a library for the analysis of diffusion MRI data. Frontiers in Neuroinformatics;2014;8(8).
6. Oishi K, et al. Atlas-based whole brain white matter analysis using large deformation diffeomorphic metric mapping: application to normal elderly and Alzheimer's disease participants. Neuroimage;2009;46(2):486-99.
Figures