4514
Evaluation of longitudinal changes in white matter structural integrity and grey matter volume in Parkinson’s disease1Division of Neuroimaging Research, Barrow Neurological Institute, Phoenix, AZ, United States, 2Neuroscience Department, Arizona State University, Phoenix, AZ, United States, 3The Muhammad Ali Parkinson Center, Barrow Neurological Institute, Phoenix, AZ, United States
Synopsis
In this study, we investigated longitudinal changes in white matter (WM) structural integrity and gray matter (GM) volume in Parkinson’s disease (PD). More specifically, free-water diffusion tensor imaging (FW-DTI), generalized q-sampling imaging (GQI), and voxel-based morphometry (VBM) were assessed in data obtained from the Parkinson Progression Markers Initiative (PPMI) database. We hypothesize that the use of advanced DTI metrics and VBM analysis will improve the sensitivity and specificity for the detection of WM alterations and GM volumetric changes in PD over time.
INTRODUCTION
Parkinson's disease (PD) is a chronic and progressive neurodegenerative disorder, often defined by motor symptoms, such as akinesia, resting tremor, and rigidity, and numerous non-motor symptoms, such as depression, cognitive impairment, and olfactory dysfunction1. Diffusion tensor imaging (DTI)2 has been used cross-sectionally to analyze white matter (WM) microstructural integrity in PD subjects, but few studies have evaluated the longitudinal progression of PD using DTI3. In this study, DTI and voxel-based morphometry (VBM) were used to evaluate longitudinal changes in WM integrity and gray matter (GM) volume, respectively, in PD subjects over 12 months. Diffusion analysis was performed using both generalized Q-sampling imaging (GQI)4 and algorithms for free-water correction of DTI data (FW-DTI)5, as these methods may overcome limitations in standard DTI analysis related to crossing fibers and partial volume effects6.METHODS
Data used in this study were downloaded from the Parkinson’s Progression Markers Initiative (PPMI) database (www.ppmi-info.org/data). We included MRI data from 30 early-PD subjects (age at baseline: 61.6±5.9 years) and 30 healthy controls (HC) (62.6±5.7 years), acquired at baseline and after 12 months. For the PD group at baseline, the mean disease duration was 4.70±2.69 months and the MDS-Unified Parkinson's Disease Rating Scale (MDS-UPDRS) was 29.40±12.35. DTI data were acquired on 3-T Siemens scanners with 64 directions at b=1000 s/mm2 and one b0 image (TR/TE=7748/86 ms; voxel size: 2.0×2.0×2.0 mm3; field of view=224×224 mm). Acquisition parameters for T1-weighted (T1-w) images were TR = 2300 or 1900 ms; TE range= 2.27–2.98 ms; flip angle: 9°; 256×256 matrix; and 1×1×1 mm3 isotropic voxel. DTI data were preprocessed using FSL, corrected for eddy currents and motion7. Brain extraction was performed using BET8. FW-corrected maps were calculated using an in-house MATLAB script. GQI analysis was performed by DSI Studio. gFA and FW maps were normalized to MNI152 space using Advanced Normalization Tools (ANTs). A modified FSL-VBM pipeline was used for VBM analysis 9. Two-way ANOVA was performed using 3dANOVA3 (AFNI). For the generalized fractional anisotropy (gFA; GQI), FW metrics, and VBM images, the main effects for group and time-point (TP) and the interaction term group×TPs were evaluated. Post-hoc differences for each main effect were also evaluated. All results are reported with a significance threshold of p-value < 0.001 and cluster size>100 voxels.RESULTS
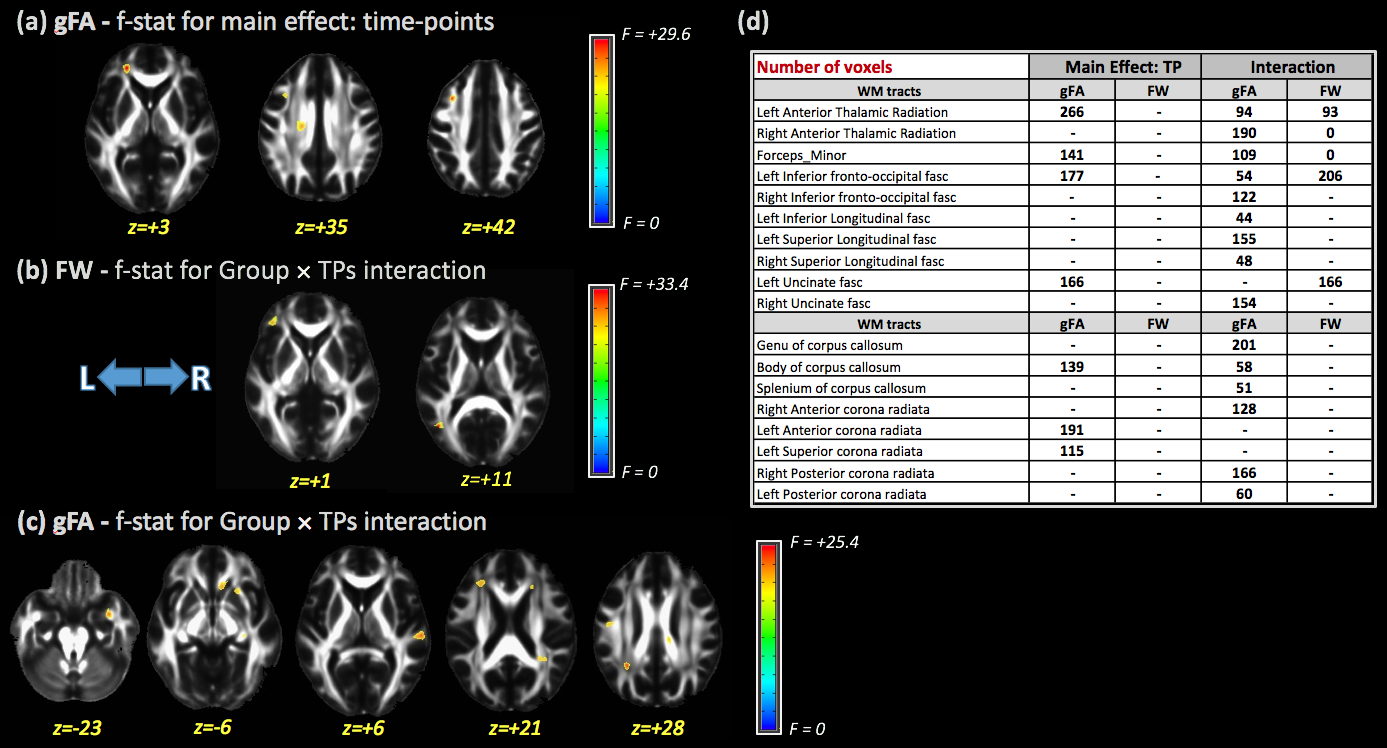
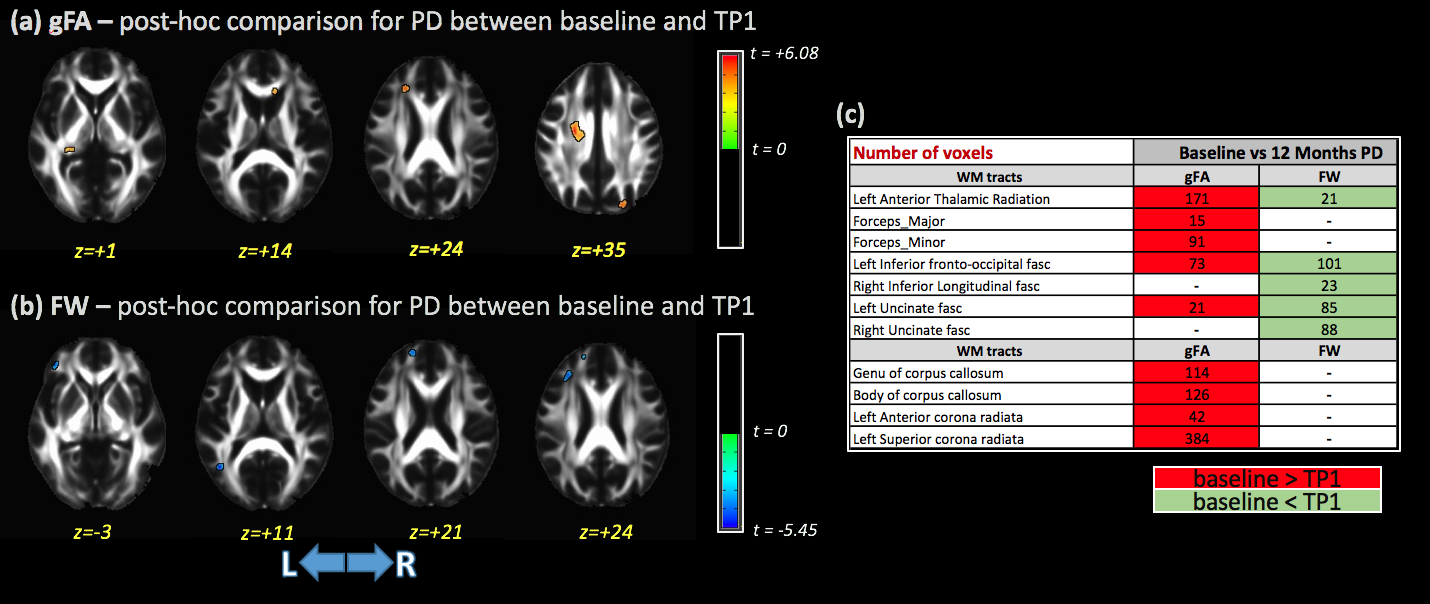
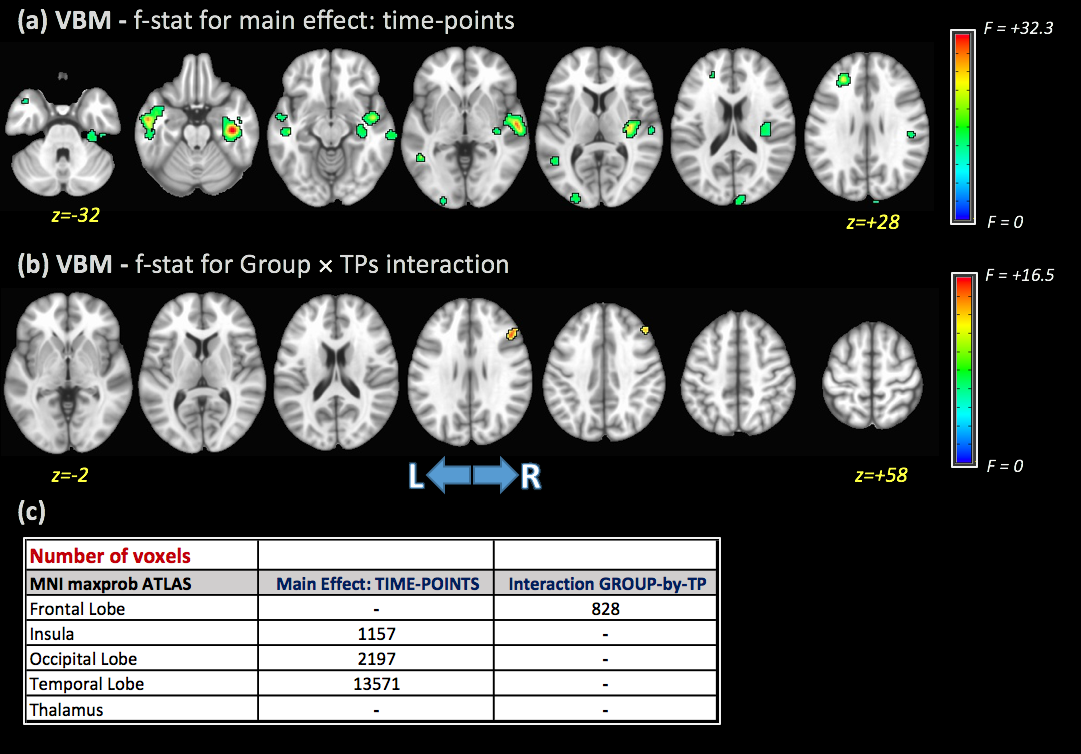
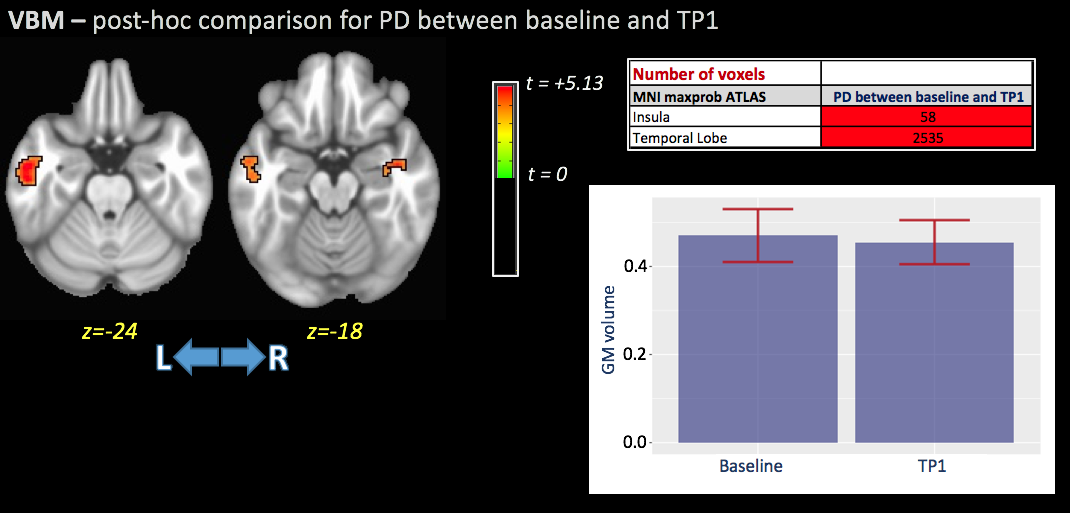
Significant differences in gFA for the main effect of TP were observed in the left anterior thalamic radiation (ATR), forceps minor, left inferior fronto-occipital fasciculus (IFOF), body of corpus callosum (CC), and left anterior and superior corona radiata (Figure 1). Additionally, no significant differences were found for the main effect of group for any DTI metrics. The interaction term (group×TPs) showed significant differences for gFA and FW metrics in several WM areas included left ATR, left IFOF, CC (Figure 1). Post-hoc analysis showed higher gFA values in PD than HCs at baseline, but lower gFA and higher FW values in PD than HCs at 12 months. Additionally, differences in gFA and FW between baseline and 12 months were observed in PD subjects (Figure 2). Figure 3 shows the significant differences for VBM for the main effect of TP and the group×TPs interaction. Similar to DTI, no significant group differences were found using VBM. For the main effect of TP, differences were observed mainly in the insula, occipital and temporal lobes, while differences for group×TPs interaction were found in the frontal lobe. Post-hoc analysis showed a significant decrease in GM volume in PD at 12 months compared to baseline (Figure 4).DISCUSSION
DTI has been used previously to assess WM integrity in PD subjects, with significantly reduced FA and increased MD most often found in the substantia nigra and CC, as well as cingulate cortex and temporal cortex10. However, some studies have reported increased FA and decreased MD in the corticospinal tract11, which may be attributable to compensatory fiber re-organization, though further study is warranted due to possible crossing fibers and partial volume effects near the corticospinal tract. To circumvent these known limitations of DTI, we investigated both GQI, which is less susceptible to fiber-crossing issues, and FW-DTI, which is less susceptible to partial volume effects. Additionally, VBM was used to evaluate GM volume changes longitudinally in PD. Using gFA, FW, and VBM, differences between PD and HC were found for the main effects of TP and the interaction term group×TPs. However, no group differences were observed in this study. These results are in contrast to a previously published report using a larger sub-set of PPMI data, which showed significant increases in FA and increased MD at baseline12. Taken together, these results may indicate limited statistical power in the current study and/or decreased specificity of standard DTI to biological mechanisms of complex white matter pathology in the previous publication. However, similar observations for the group×TPs interactions were reported - that is, FA decreased significantly over time.CONCLUSION
This study demonstrates that gFA metrics, FW index, and VBM technique can provide insight into the longitudinal trajectory of WM integrity and GM volumes in PD, though further study is warranted to better understand the complex spatiotemporal changes associated with progression in PD.Acknowledgements
This work was supported by the Barrow Neurological Foundation. Data used in the preparation of this abstract were obtained from the Parkinson's Progression Markers Initiative (PPMI) database (ppmi-info.org/data).References
1. de Lau LM, Breteler MM. Epidemiology of Parkinson's disease. Lancet Neurol. 2006;5(6):525-35.
2. Knossalla F, Kohl Z, Winkler J, et al. High-resolution diffusion tensor-imaging indicates asymmetric microstructural disorganization within substantia nigra in early Parkinson's disease. J Clin Neurosci. 2018;50:199-202
3. Rossi ME, Ruottinen H, Saunamäki T, et al. Imaging brain iron and diffusion patterns: a follow-up study of Parkinson's disease in the initial stages. Acad Radiol. 2014;21(1):64-71.
4. Yeh FC, Wedeen VJ, Tseng WY. Generalized q-sampling imaging. IEEE Trans Med Imaging. 2010;29(9):1626-35
5. Pasternak O, Sochen N, Gur Y, et al. Free water elimination and mapping from diffusion MRI. Magn Reson Med 2009;62(3):717-730.
6. Tuch DS, Reese TG, Wiegell MR, et al. High angular resolution diffusion imaging reveals intravoxel white matter fiber heterogeneity. Magn Reson Med. 2002;48(4):577-82.
7. Smith SM, Jenkinson M, Woolrich MW, et al. Advances in functional and structural MR image analysis and implementation as FSL. Neuroimage 2004;23 Suppl 1:S208-219.
8. Smith SM. (2002) Fast robust automated brain extraction. Hum Brain Mapp 2002;17(3):143-155.
9. Douaud G, Smith S, Jenkinson M, et al. Anatomically related grey and white matter abnormalities in adolescent-onset schizophrenia. Brain. 2007;130(Pt 9):2375-86
10. Atkinson-Clement C, Pinto S, Eusebio A, et al. Diffusion tensor imaging in Parkinson's disease: Review and meta-analysis. Neuroimage Clin. 2017;15;16:98-110
11. Mole JP, Subramanian L, Bracht T, et al. Increased fractional anisotropy in the motor tracts of Parkinson's disease suggests compensatory neuroplasticity or selective neurodegeneration. Eur Radiol. 2016;26(10):3327-35
12. Taylor KI, Sambataro F, Boess F, et al. Progressive Decline in Gray and White Matter Integrity in de novo Parkinson's Disease: An Analysis of Longitudinal Parkinson Progression Markers Initiative Diffusion Tensor Imaging Data. Front Aging Neurosci. 2018; 8;10:318
Figures