4510
Radiological Qualitative Assessment of IVIM Parameters for Total Variation Penalty Function Approach: A Pilot Study in Osteosarcoma
Amit Mehndiratta1, Esha Badiya Kayal1, Kedar Khare 2, Sameer Bakhshi3, Raju Sharma4, and Devasenathipathy Kandasamy4
1Centre for Biomedical Engineering, Indian Institute of Technology Delhi, New Delhi, India, 2Department of Physics, Indian Institute of Technology Delhi, New Delhi, India, 3Dr. BRA Institute-Rotary Cancer Hospital, All India Institute of Medical Sciences, New Delhi, India, 4Department of RadioDiagnosis, All India Institute of Medical Sciences, New Delhi, India
1Centre for Biomedical Engineering, Indian Institute of Technology Delhi, New Delhi, India, 2Department of Physics, Indian Institute of Technology Delhi, New Delhi, India, 3Dr. BRA Institute-Rotary Cancer Hospital, All India Institute of Medical Sciences, New Delhi, India, 4Department of RadioDiagnosis, All India Institute of Medical Sciences, New Delhi, India
Synopsis
Radiological based qualitative assessment of evaluated IVIM parametric maps using state-of-the-art IVIM analysis methods Bi-exponential (BE) model with adaptive Total Variation Penalty function (BE+TV) and BE with adaptive Huber Penalty function (BE+HPF) has been performed in comparison to the commonly used IVIM analysis methodologies like BE model, and segmented BE methods. BE+TV/BE+HPF preserve spatial homogeneity in the parametric images by updating them iteratively during data fitting. Experimental results showed all IVIM analysis methods showed BE+TV and BE+HPF produced comparative better noise suppression and diagnostic quality and interpretability for D* and f than other methods.
Purpose
Intravoxel incoherent motion (IVIM)(1) analysis of diffusion weighted MRI(DWI) has regained its interest in last two decades(2,3), as it can evaluate both perfusion and diffusion information in tissue without any exogenous contrast agent. However quantitative IVIM parameters, specially perfusion have been often found not reliable for clinical interpretation(2,3). Commonly used IVIM analysis methodologies like Bi-exponential(BE) model(1), segmented techniques with 2-parameter fitting(BEseg-2)(4,5), 1-parameter fitting(BEseg-1)(4,5) optimize the signal fitting at each voxel independently; overlooking the spatial context of the signal resulting noisy parameters. As spatial homogeneity in the tissue is expected physiologically, a state-of-the-art IVIM analysis methods have been developed(6): a) BE with adaptive Total Variation Penalty function (BE+TV) and b) BE with adaptive Huber Penalty function (BE+HPF)(6) by incorporating two regularizing penalty functions: Total Variation (TV)(7) and Huber penalty function (HPF)(8). BE+TV/BE+HPF applies non-linear least square optimization for data fitting and the desired spatial homogeneity in the parametric images was achieved by updating the parametric images iteratively with the corresponding adaptive penalty function TV/HPF to produce qualitatively and quantitatively improved IVIM parameter estimation(6). The method has been shown already to be quantitatively superior to other IVIM analysis methodologies (6)(9)(10). We present the preliminary study to assess the qualitative nature of the IVIM parametric maps using this state-of-the-art methods for clinical interpretation and diagnostic accuracy in comparison to the other commonly used IVIM analysis methodologies.Methods
Dataset: IVIM dataset for fifty-five patients (N=30;Male:Female=21:9;Age=16.6±4.5years), with Osteosarcoma were acquired before commencement of neoadjuvant chemotherapy using 1.5T Philips Achieva® MRI scanner. A standard protocol of T1-weighted(T1W), T2-weighted(T2W) including DWI was followed. DWI was acquired using free breathing Spin Echo-Echo Planar imaging (SE-EPI) with 11b-values(s/mm2), TR/TE=7541/67msec, matrix-size=192×192, slice-thickness/Gap=5mm/0.5mm, field-of-view=250×250mm2, voxel-size=2.98/3.52/5.0mm and 64 axial slices.Image analysis: IVIM dataset were analyzed using five analyses methodologies: i) BE model, ii) BEseg-2, iii) BEseg-1, iv) BE+TV, and v) BE+HPF and quantitative parameters Diffusion-coefficient(D), Perfusion coefficient(D*) and Perfusion fraction(f) were evaluated.
For qualitative assessment, an experienced radiologist (with more than 10 years of experience in cancer diffusion imaging) evaluated the D,D* and f parametric maps from all five analysis methods and rated the image quality. Parametric maps of two slices from each patient having maximum tumor burden were chosen and reviewed in random order. For each lesion, rating was performed using 5-point scale (excellent:5; Good:4; Fair:3; Poor:2 and Uninterpretable:1) to four criteria as:
1) Tumor shape & margins
2) Morphologic correlation
3) Noise suppression
4) Overall interpretability
Average quality scores in each criteria were calculated and a higher score indicated a more interpretable image. Friedman test was performed to find the statistical significance(p<0.5) of qualitative scores of five analysis methods.
For quantitative assessment, Goodness-of-fit(R2) and Coefficient-of-variation(CV) for each IVIM parameter (D,D*,f) were evaluated as a measure of precision and reproducibility. Region of interest for tumor were demarcated. Average values for quantitative parameters in tumor were evaluated in patient cohort and ANOVA test followed by Tukey post-hoc test were performed to compare the estimated parameters using five analysis methods for statistical significance(p<0.05). All analyses methods were implemented in an in-house analysis toolbox using MATLAB® (MathWorks Inc.,v2013,Philedellhia,USA).
Results
Qualitative evaluation scores of IVIM parametric maps for different evaluating criterion is summarized in Table1. For D, all methods have satisfactory average scores (~3.1-3.7) for all four criterion except BE(~2). For D* map, BE+TV and BE+HPF methods secured moderate scores (~2.3-2.6); whereas other methods scored poorly (~1.1-1.8). For f map, BE+TV and BE+HPF method showed highest scores (~2.9-3.63) in all criterion, BEseg-1 secured moderate scores (~2.4-2.8); while BE and BEseg-2 methods have poor scores(~1.3-2.1). Figure1 represent, percentage of frequency of qualitative scores in 5-point scale in patient cohort. For D map, all methods scored Fair-Good except BE, while for f map, BE+TV and BE+HPF performed noise suppression Fair-Good and for other criterion scored mostly Fair. For D* map, BE+TV and BE+HPF secured mostly Poor-Fair score; whereas other methods have mostly Uninterpretable-Poor scores. Figure2 shows IVIM parametric maps evaluated for five analysis methods from a representative patient. Average R2 and CV values for five IVIM analysis methods in patient cohort are presented in Table2. All bi-exponential models achieved satisfactory data fitting precision (R2=~0.9) than mono-exponential fitting (R2=0.7). BE+TV and BE+HPF methods showed comparatively better reproducibility than BE for evaluating D(CV: 36 vs. 52) and all the methods for evaluating D*(CV: 96-97 vs. 109-114) and f(CV: 60-61 vs. 101-122). Table3 represents average parameter values in patient cohort.Discussion
The objective of this study was to test the qualitative assessment of parametric image by various IVIM analysis methodologies for clinical interpretability and diagnostic accuracy. All IVIM analysis methods showed satisfactory evaluation of D map and overall good interpretability except BE method; whereas for D* and f, BE+TV and BE+HPF showed comparative high noise suppression, high quality and interpretability. Both BE+TV and BE+HPF methods also demonstrated robust IVIM analysis in other tumors as Ewing’s sarcoma(6) and prostate cancer(10). BE+TV have been found to be useful in evaluate chemotherapy response in Osteosarcoma(9). There are few limitations of the study, limited number of samples and secondly, single rater for qualitative scoring the parameter maps. These will be addressed in future to improve the qualitative assessment with intra-and inter-rater comparison in a larger patient cohort.Acknowledgements
Authors thank all the patients for contributing the data and also thank all the nursing staff and colleagues at hospital for helping the data acquisition.References
1. Le Bihan D. et al. Radiology 1988; 168:497–505. 2. Iima M. et al. Radiology 2016; 278:13–32. 3. Koh D. et al. AJR Am J Roentgenol 2011; 196:1351–1361. 4. Merisaari H. et al. Magn Reson Med 2017; 77:1249–1264. 5. Meeus EM. et al. J Magn Reson Imaging 2017; 45:1325–1334. 6. Baidya E. et al. Med Phys 2017; 44:5489–5858. 7. Vogel CR. et al. SIAM J Sci Comput 1996; 17:227–238. 8. Peter J. Huber. Ann Stat 1973; 1:799–821. 9. Baidya E. et al. Eur J Radiol 2019; 119(August):108635. 10. Malagi AV. et al. MAGMA 2019; 32(5):519-527.Figures
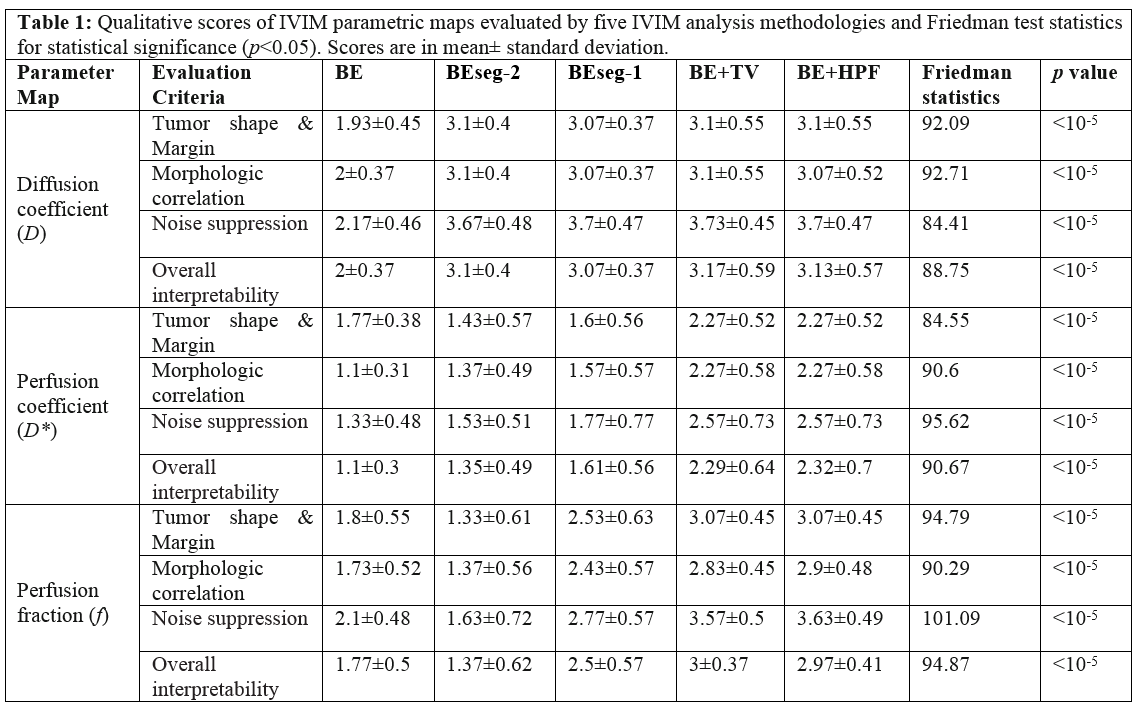
Table 1: Qualitative scores of IVIM parametric maps evaluated by five IVIM
analysis methodologies and Friedman test statistics for statistical
significance (p<0.05). Scores
are in mean± standard deviation.
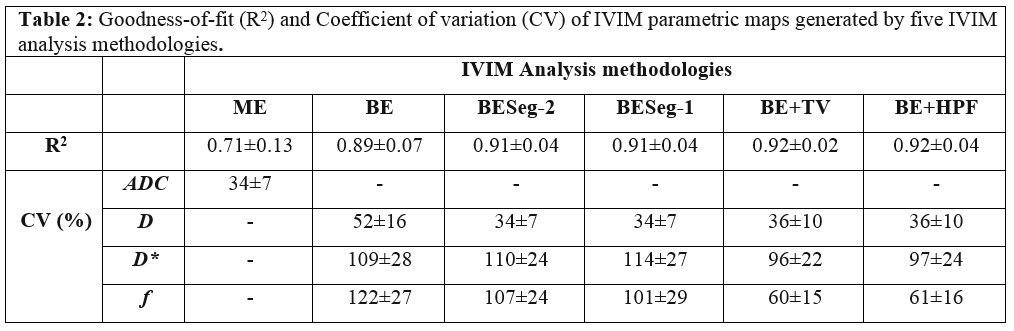
Table 2: Goodness-of-fit (R2) and Coefficient of
variation (CV) of IVIM parametric maps generated by five IVIM analysis
methodologies.
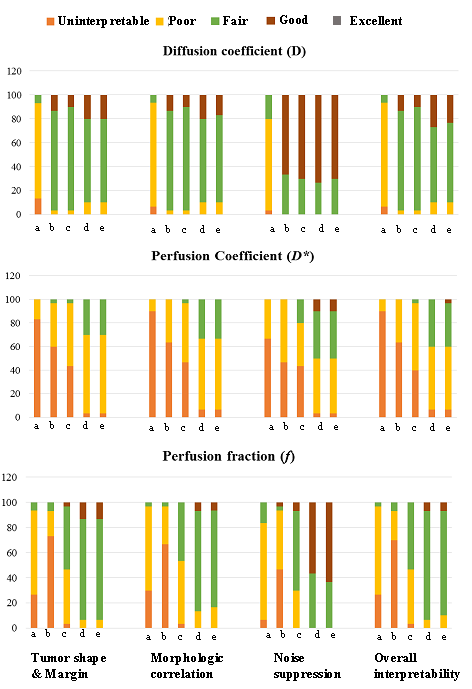
Figure 1:
Percentage of frequency of qualitative scores in
5-point scale (Excellent:5; Good:4; Fair:3; Poor:2 and Uninterpretable:1) for
four criteria for qualitative evaluation of IVIM parametric maps evaluated by
five IVIM analysis methodologies a) BE, b) BEseg-2, c)BEseg-1, d)BE+TV
and e) BE+HPF.
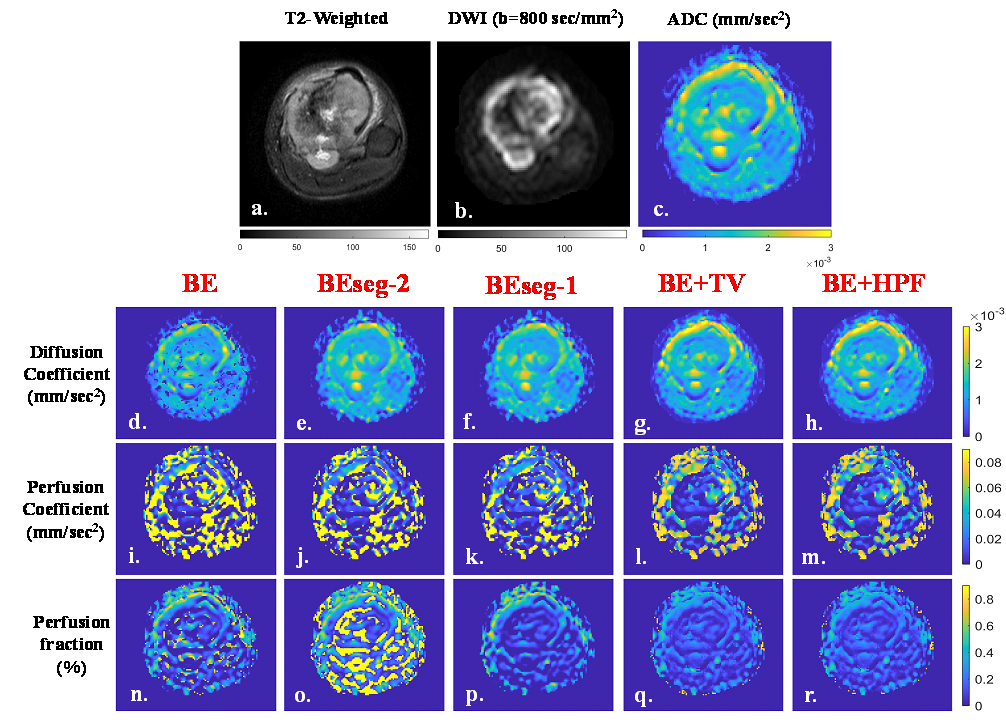
Figure 2: Images are from a representative patient (16 years, Male) with Osteosarcoma in left tibia. a) T2-weighted image; b) DWI with b
800 sec/mm2; c) Apparent diffusion coefficient (ADC) of the same axial slice. d-h) Diffusion coefficient (D), i-m) Prfusion coefficient (D*) and n-r) Perfusion fraction (f) evaluated using IVIM analysis
methodologies BE, BESeg-2, BESeg-1, BE+TV and BE+HPF respectively. BE+TV and
BE+HPF methods showed comparatively better noise suppression than the other
three methods in evaluating D* and f maps.
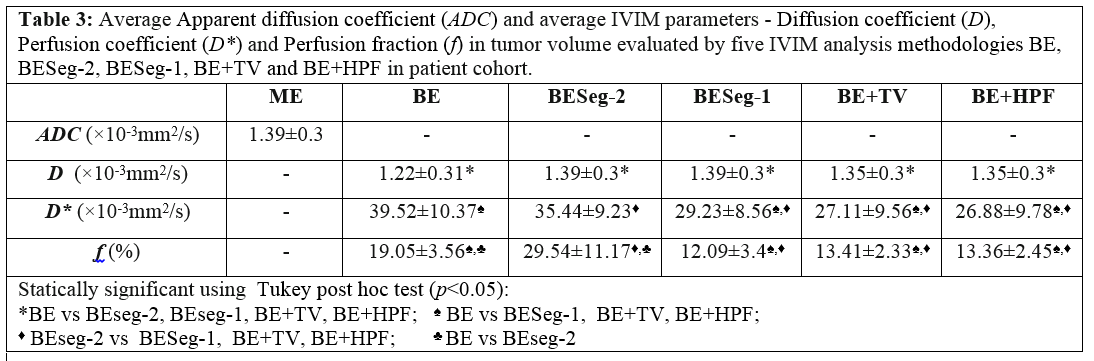
Table 3:
Average Apparent diffusion coefficient (ADC) and average IVIM parameters -
Diffusion coefficient (D), Perfusion coefficient (D*) and Perfusion fraction (f) in
tumor volume evaluated by five IVIM analysis methodologies BE, BESeg-2,
BESeg-1, BE+TV and BE+HPF in patient cohort.