4509
Comparison of Cylindrical and Spherical Geometric Models to Infer Cell Sizes in a Garlic Stem1Physics, University of Winnipeg, Winnipeg, MB, Canada, 2University of Manitoba, Winnipeg, MB, Canada, 3Physics, University of Manitoba, Winnipeg, MB, Canada, 4Cubresa, Inc., Winnipeg, MB, Canada, 5Brain Engineering Centre, Anhui University, China Physics, University of Winnipeg, Winnipeg, MB, Canada, 6Cubresa, Winnipeg, MB, Canada
Synopsis
Temporal diffusion spectroscopy (TDS) can be used to infer sizes of cells in samples. It relies on a geometric model to relate the MRI signal to the cell sizes. Garlic stem collenchyma tissue has long cells which might be modelled as cylinders. We compared a cylindrical and spherical geometric model in temporal diffusion spectroscopy to determine how important the geometrical model was for garlic stems. The inferred diameters of cells in the garlic stem (4μm-6μm) were not statistically different when using the two different geometric models. This is the first step toward understanding the importance of geometric models for TDS.
Introduction
Temporal diffusion spectroscopy (TDS) has been used to infer axon sizes using geometric models that assume axons are cylinders1-3. A garlic stem sample was imaged to test the importance of other geometric models. The collenchyma tissue in vascular bundles in garlic stems contains approximate cylindrical-type cells4,5. Thus we imaged garlic stems to test TDS with oscillating gradient spin echo to determine if the spherical cell model and cylindrical cell model infer significantly different cell sizes to determine how important the geometrical model is.Methods
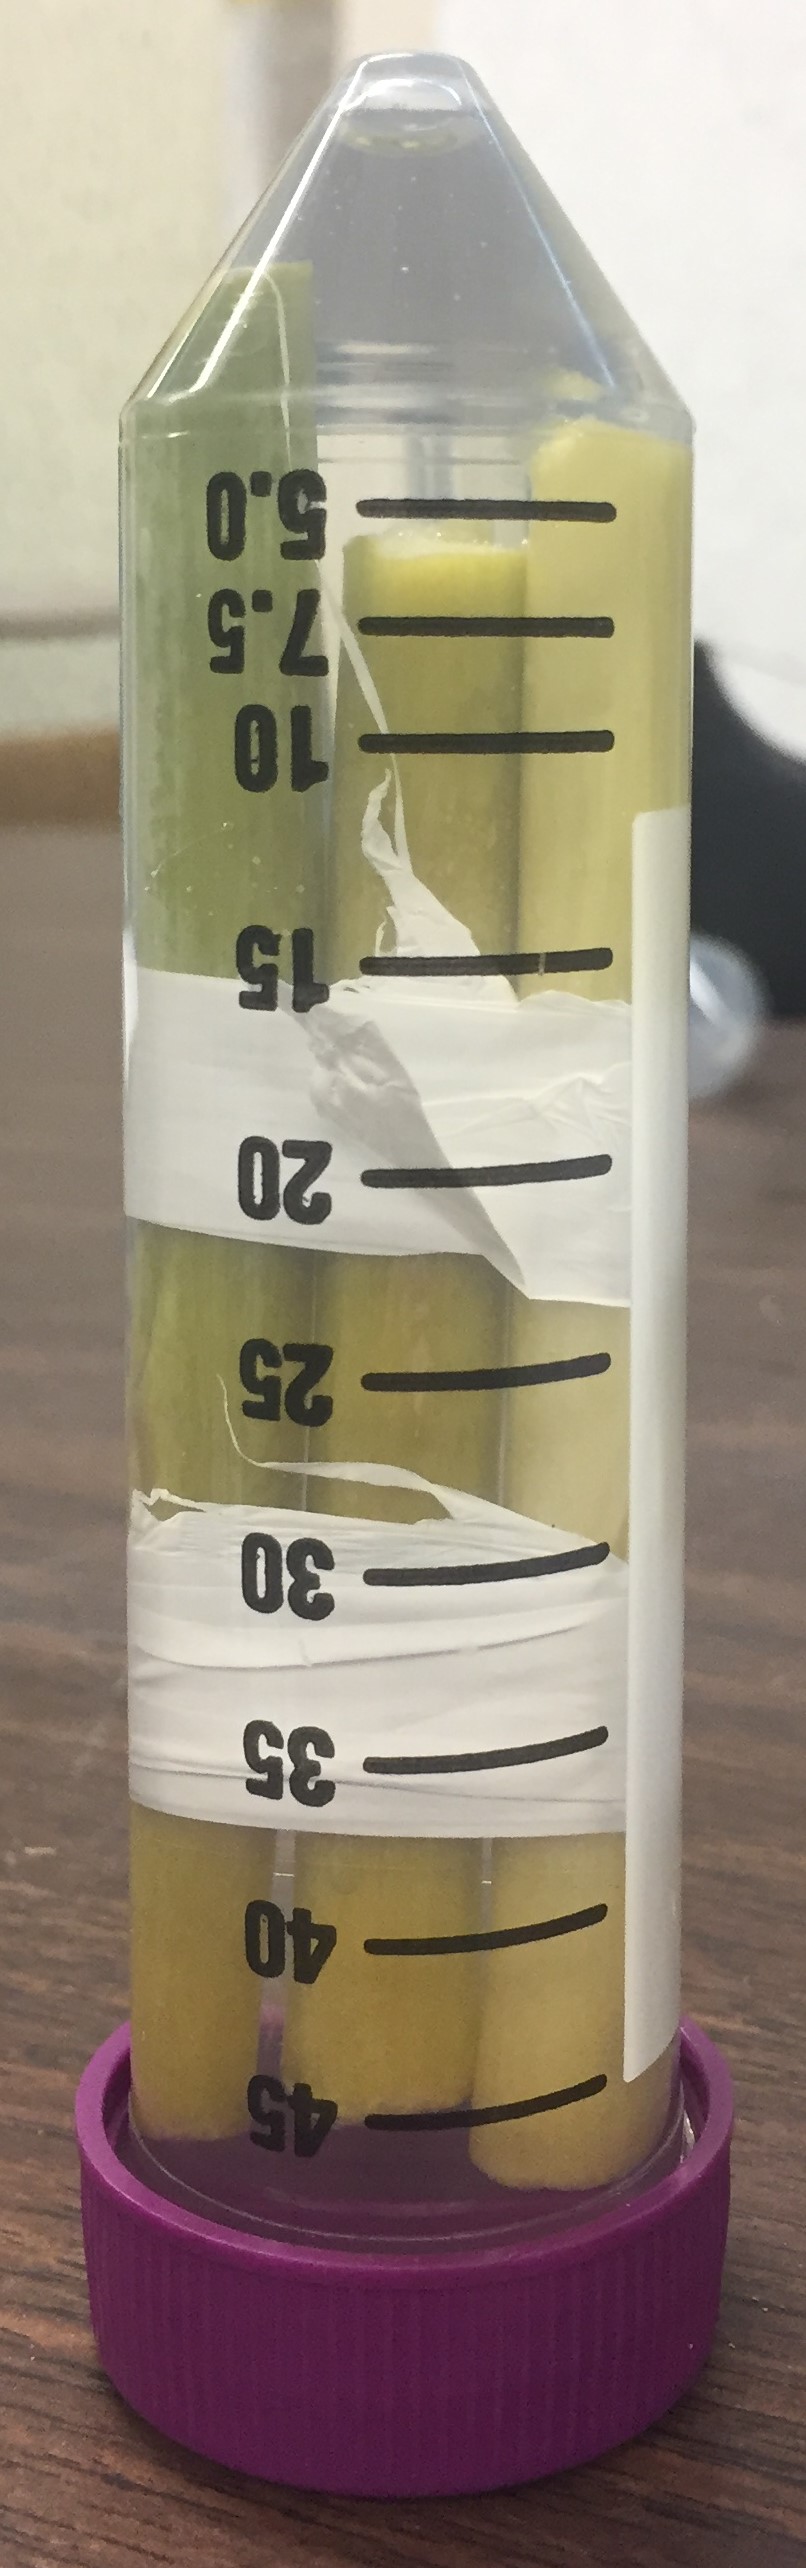
Sample: Three garlic stems were placed between glass slides and put in a 50 mL sample tube filled with water, see Figure 1. The image slice was chosen to be perpendicular to the length of the garlic stem.MRI: The sample was imaged using a 7T Bruker AvanceIII NMR system with Paravision 5.0 and BGA6 gradient set with a maximum gradient strength of 430357Hz/cm, and a 3.5 cm diameter bird cage RF coil. Each 20 ms apodised cosine gradient pulse6,7 ranged from n = 1-20, in steps of 1. One gradient strength was used for each frequency and gradient pulses were separated by 24.52 ms and one image was collected without diffusion gradients. One image was collected at the first gradient strengths of 0. The gradient strength was chosen to keep b ≈ 292 s/mm2 constant for the frequencies from n=1-6. For n>6 the gradient strength was held constant at 90% maximum because we could not get to the desired b-value.
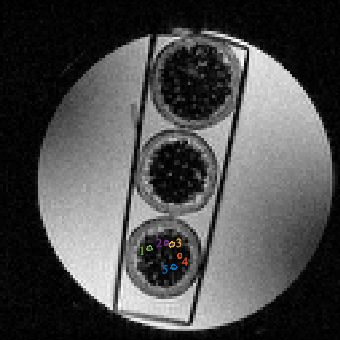
Imaging parameters: 2 averages, 3 cm FOV, TR = 1000 ms, TE = 49.566 ms, matrix 128 x 128, 234.375 μm in plane resolution, acquisition time 8 minutes and 32 seconds per scan (scans performed = 20, 2.8 hours) were used. A 1 mm thick slice of interest was imaged as shown in Figure 2.
Image Analysis: Prior to fitting, a custom-built image registration tool8 was used to align all images to the b=0 diffusion-weighted images using a rigid affine transformation matrix determined automatically by maximizing the 2D correlation coefficient.
Analysis: Regions of interest (ROIs) were drawn in some of the vascular bundles of one of the garlic stems. The mean ± standard deviation of the signal in the ROIs was calculated. The signal was assumed to be described by a two compartment model of the form
E(ω=2πn/σ,g)=(1-fcel)ebDh+fcele-β(Di,AxD) where fcel is the packing fraction of cells, Di is the intra-cellular diffusion coefficient, Dh is the hindered diffusion coefficient, and AxD is the effective mean cell diameter3,9. Signals were fitted to the two compartment model using least squares minimization to extract AxD. The data were fitted to two different models, one with cylindrical cells and one with spherical cells. We hypothesized that the collenchyma tissue in the vascular bundles would be better modelled with cylinders.
Results
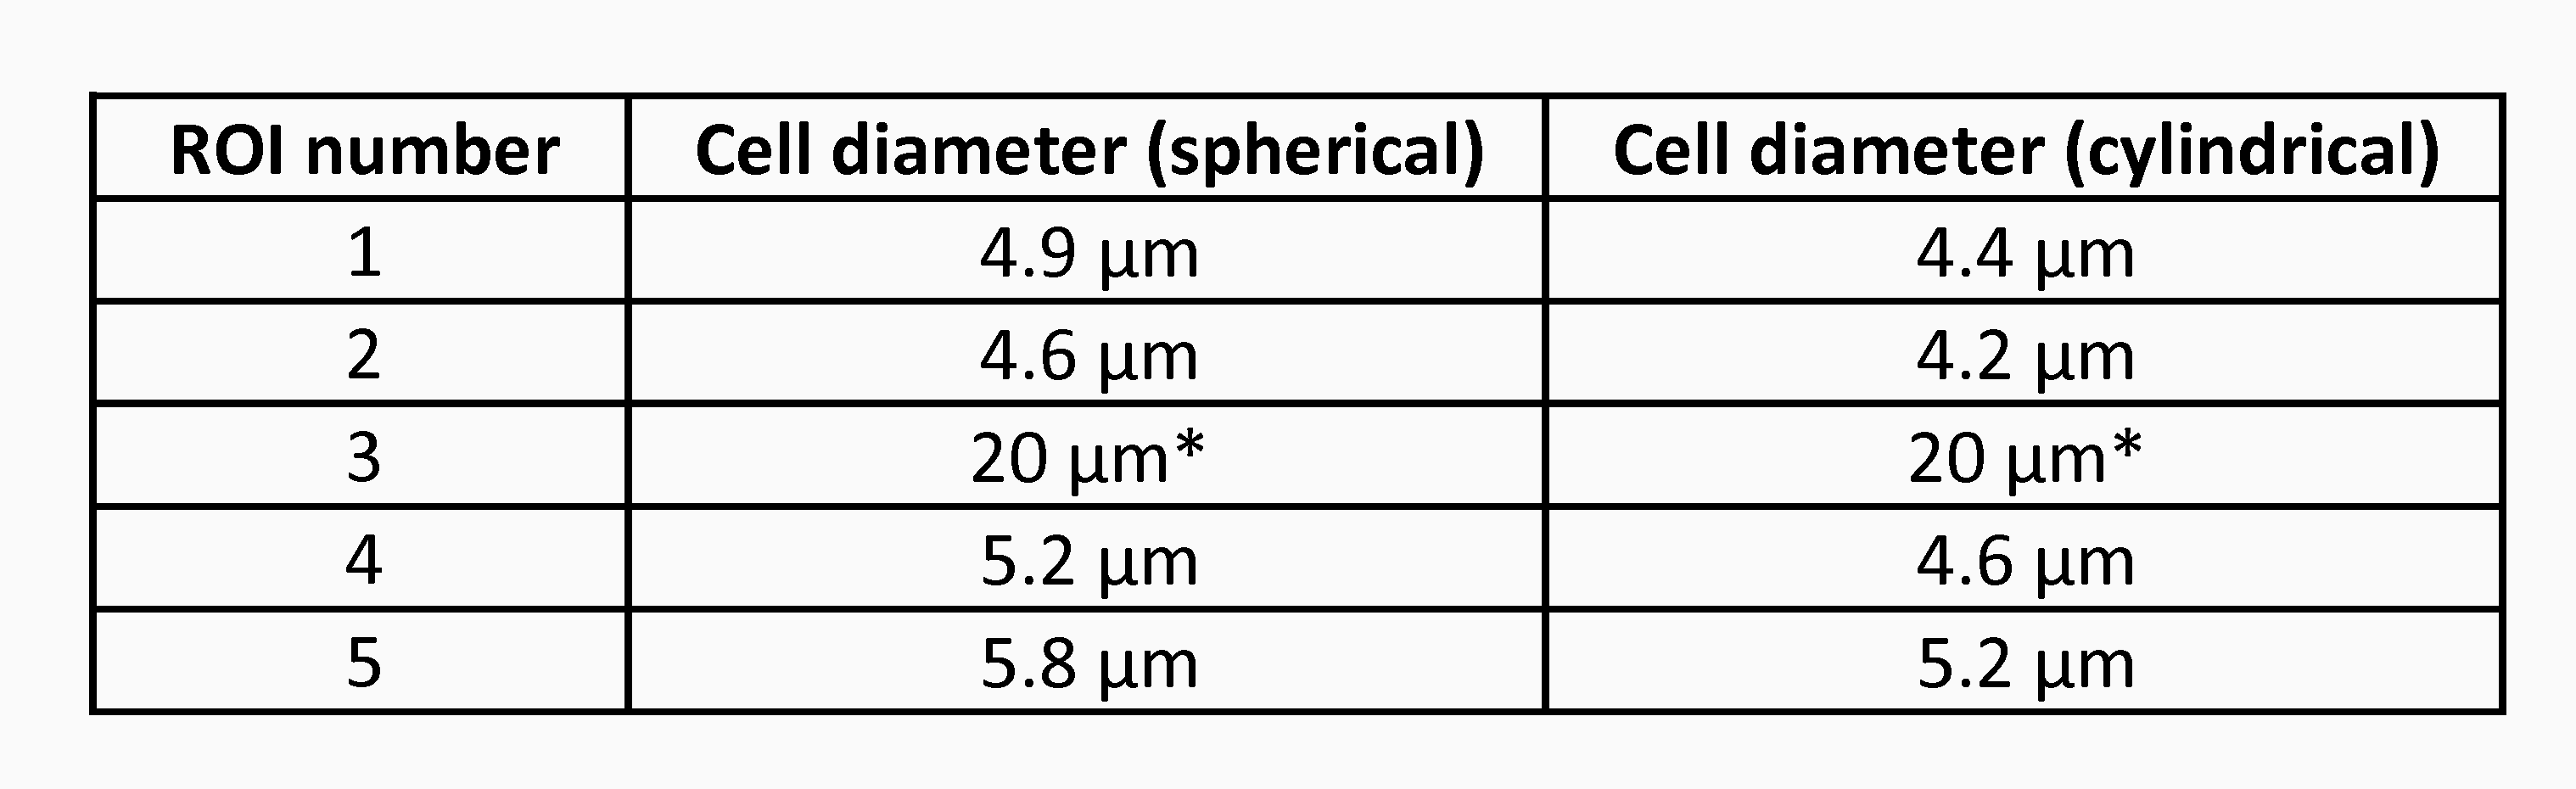
The method successfully inferred cell diameters (i.e. converged on a result) in the same four out of five ROIs for both the cylindrical and spherical geometric models. See Figure 2 for the ROIs and Figure 3 for the results. For ROI 3, neither fitting model was able to converge on a cell diameter. This could be because the ROI was too small, or it contained cells from different tissue structures besides collenchyma tissue, or not all vascular bundles contain cells of similar sizes.Discussion and Conclusion
Using the model we inferred cell sizes for all but one of the ROIs. The inferred cell diameters in these ROIs ranged from 4 µm to 6 µm. There were no significant differences between the spherical and cylindrical cell models in terms of the value of the cell sizes, although the diameters inferred from the cylindrical model were consistently slightly smaller than those found from the spherical model. This indicates that either the exact geometry is not important in the model, or, more likely, a better model of the geometry is needed. The OGSE frequency range targeted cells ~ 1-10 µm in diameter. For cells with diameters outside of this range, such as some that could exist in the vascular bundles, pulse gradient spin echo sequences or OGSE sequences with different frequency ranges would need to be used. This study shows the importance of selecting the appropriate pulse sequence parameters and geometric model for cell size inference. More work is needed to compare pulse sequences, pulse sequence parameters, and geometric models to determine which are best to use for garlic stems.Acknowledgements
The authors wish to acknowledge funding from Mitacs and NSERC.References
1. Assaf Y, Blumenfeld-Katzir, Yovel Y, Basser PJ. AxCaliber: a method for measuring axon diameter distribution MRI. Magn Reson Med. 2008; 59(6):1347-1354.
2. Alexander DC, Hubbard PL, Hall MG, Moore EA, Ptito M, Parker GJ, Dyrby TB. Orientationally invariant indices of axon diameter and density from diffusionMRI. Neuroimage. 2010;52(4):1374-1389.
3. Xu J, Li H, Harkins KD, Jiang X, Xie J, Kang H, Does MD, Gore JC. Mapping mean axon diameter and axonal volume fraction by MRI using temporal diffusionspectroscopy. NeuroImage. 2014 Dec 1;103:10-9.
4. Mann, LK, Anatomy of the garlic bulb and factors affecting bulb development, Hilgardia, A journal of Agricultural Science Published by the California Agricultural Experiment Station (1952), 21(8): 195-231.
5. Kothari IL, Morphohistogenic and anatomical studies in garlic: Phloem, Proc. Indian Acad. Sci. (1979) 88 (BII3) : 219-224.
6. Schachter M, Does MD, Anderson AW, Gore JC. Measurements of Restricted Diffusion Using an Oscillating Gradient Spin Echo Sequence, J Mag Reson.2000;147(2):233-237.
7. Does MD, Parsons EC, Gore JC. Oscillating Gradient Measurements of Water Diffusion in Normal and Globally Ischemic Rat Brain. Magn Reson Med.2003;49(2):206–215.
8. Thiessen JD, Zhang Y, Zhang H, Wang, L, Buist R, Del Bigio MR, Kong J, Li X-M, Martin M. Quantitative MRI and ultrastructural examination of the cuprizonemouse model of demyelination. NMR Biomed 2013;26(11):1562-1581.
9. Mercredi M, Vincent TJ, Bidinosti CP, Martin M. Assessing the accuracy of using oscillating gradient spin echo sequences with AxCaliber to infer micron-sizedaxon diameters. Magn Reson Mater Phy. 2017;30(1):1-14.
Figures