4507
Co-electrospun spinal cord phantom for diffusion MRI1Centre for Medical Image Computing, Department of Computer Science, University College London, London, United Kingdom, 2School of Pharmacy, University College London, London, United Kingdom, 3Queen Square MS Centre, Queen Square Institute of Neurology, Faculty of Brain Sciences, University College London, London, United Kingdom, 4College of Textile and Clothing Engineering, Soochow University, Suzhou, China, 5Bioxydyn Limited, Manchester, United Kingdom
Synopsis
A spinal cord-mimicking fibre phantom was developed to evaluate its potential for validating dMRI. Microfibres were co-electrospun with two polymer solutions and characterized by SEM. The phantom comprised two material samples designed with 0o and 90o crossings. SEM revealed that fibres were uniaxially aligned and hollow, having similar sizes to spinal cord axons. Diffusion tensor analysis of a ZOOM dMRI acquisition demonstrated the difference in alignment of the two samples. Diffusion kurtosis analysis demonstrated differences in axial and radial diffusion restriction, with parameter values consistent with published spinal cord data. Relaxation time constants were similar in two samples.
INTRODUCTION
New approaches and models have been developed to obtain the microstructure of spinal cord by dMRI.1 However, there has been no dedicated phantoms that can be used to validate diffusion MR measurements in spinal cord. We have previously developed tissue-mimicking MR phantoms from co-electrospun hollow microfibres.2-4 Here we demonstrate a spinal cord phantom constructed from hollow microfibres and assesses its potential as a tool for validating MR measurement on a 3T clinical scanner.METHODS
Microstructural characterisation and phantom constructionA ~0.5 mm thickness microfibre strip was fabricated by co-electrospinning, as previously described.5 Pore diameter was calculated from 5 SEM images for each sample using ImageJ.6 Two phantom samples were constructed by packing two blocks of 24 fibre layers (10 mm×10 mm) into a 15 ml centrifuge tube filled with water having approximate diameter of spinal cord (1-12 µm).7 Fibres in one block were uniaxially aligned (0o) and in the other were interleaved, crossed at 90o. The two samples assembled into a cylindrical plastic container (inner diameter: ~140 mm; height: ~180 mm) that can house up to 7 samples.
MR acquisition and analysis
The phantom filled with water was scanned on a 3T Philips Ingenia CX with the vendor’s 64-channel head coil to characterise its diffusion and relaxation properties. The MRI protocol included: 3D T2-weighted turbo spin echo for anatomical localisation (resolution: 1 mm isotropic; TR: 2200 ms; TSE factor: 90; TSE echo spacing: 4.7 ms; TE equivalent: 110 ms; compressed-SENSE factor of 7); 3D spoiled gradient echo (SPGR) imaging for T1, T2* and proton density (PD) mapping (resolution: 1 mm isotropic; TR: 28.5 ms; TE/echo spacing = 2.3/3.3 ms for 6 echoes; flip angles: 4° and 24°; compressed-SENSE factor of 6) and for B1 mapping (actual flip angle imaging; resolution: 4 mm isotropic; TR1/TR2: 30/180 ms/ms; TE: 2.1 ms); ZOOM-EPI DW imaging (reduced-field-of-view of 64x48 mm2; resolution: 1x1 mm2; 12 3-mm thick slices acquired in 3 packages; TR = 6000 ms; 1 b = 0 at each of TE = {20, 30, 60, 64, 90, 120, 200} ms and 24 directions at each of b = {1200, 2500} s/mm2 with TE = 64 ms). Scans were performed at room temperature (T = 23.3°C with intrinsic water self-diffusivity estimated to be 2.2 mm2 ms–1).
From two SPGR scans with minimum TE and different flip angles we derived quantitative T1,8 correcting nominal flip angles with B1 map. Multiple SPGR echoes acquired at a flip angle of 24° were instead used to calculate T2*. Relaxometry metrics enabled the calculation of quantitative PD with the method of pseudo proton densities,9 taking care of normalising phantom’s PD to that of surrounding water. Then, diffusion data were analysed by fitting DTI model to the lowest b-shell and DKI model to the complete set of multi-shell measurements, deriving FA, axial/radial/mean diffusivity (AD/RD/MD) and axial/radial/mean kurtosis. A quantitative T2 index was also obtained by fitting mono-exponential decay to the set of b = 0 images acquired at various TEs.
Model fitting was performed with custom-written python code (T1, T2, T2*, PD) and with FSL dtifit (FA, AD, RD, MD) and DiPy (AK, RK, MK).
Finally, a mask of two samples was drawn manually with FSLView and median and IQR of all metrics was evaluated within the masks.
RESULTS
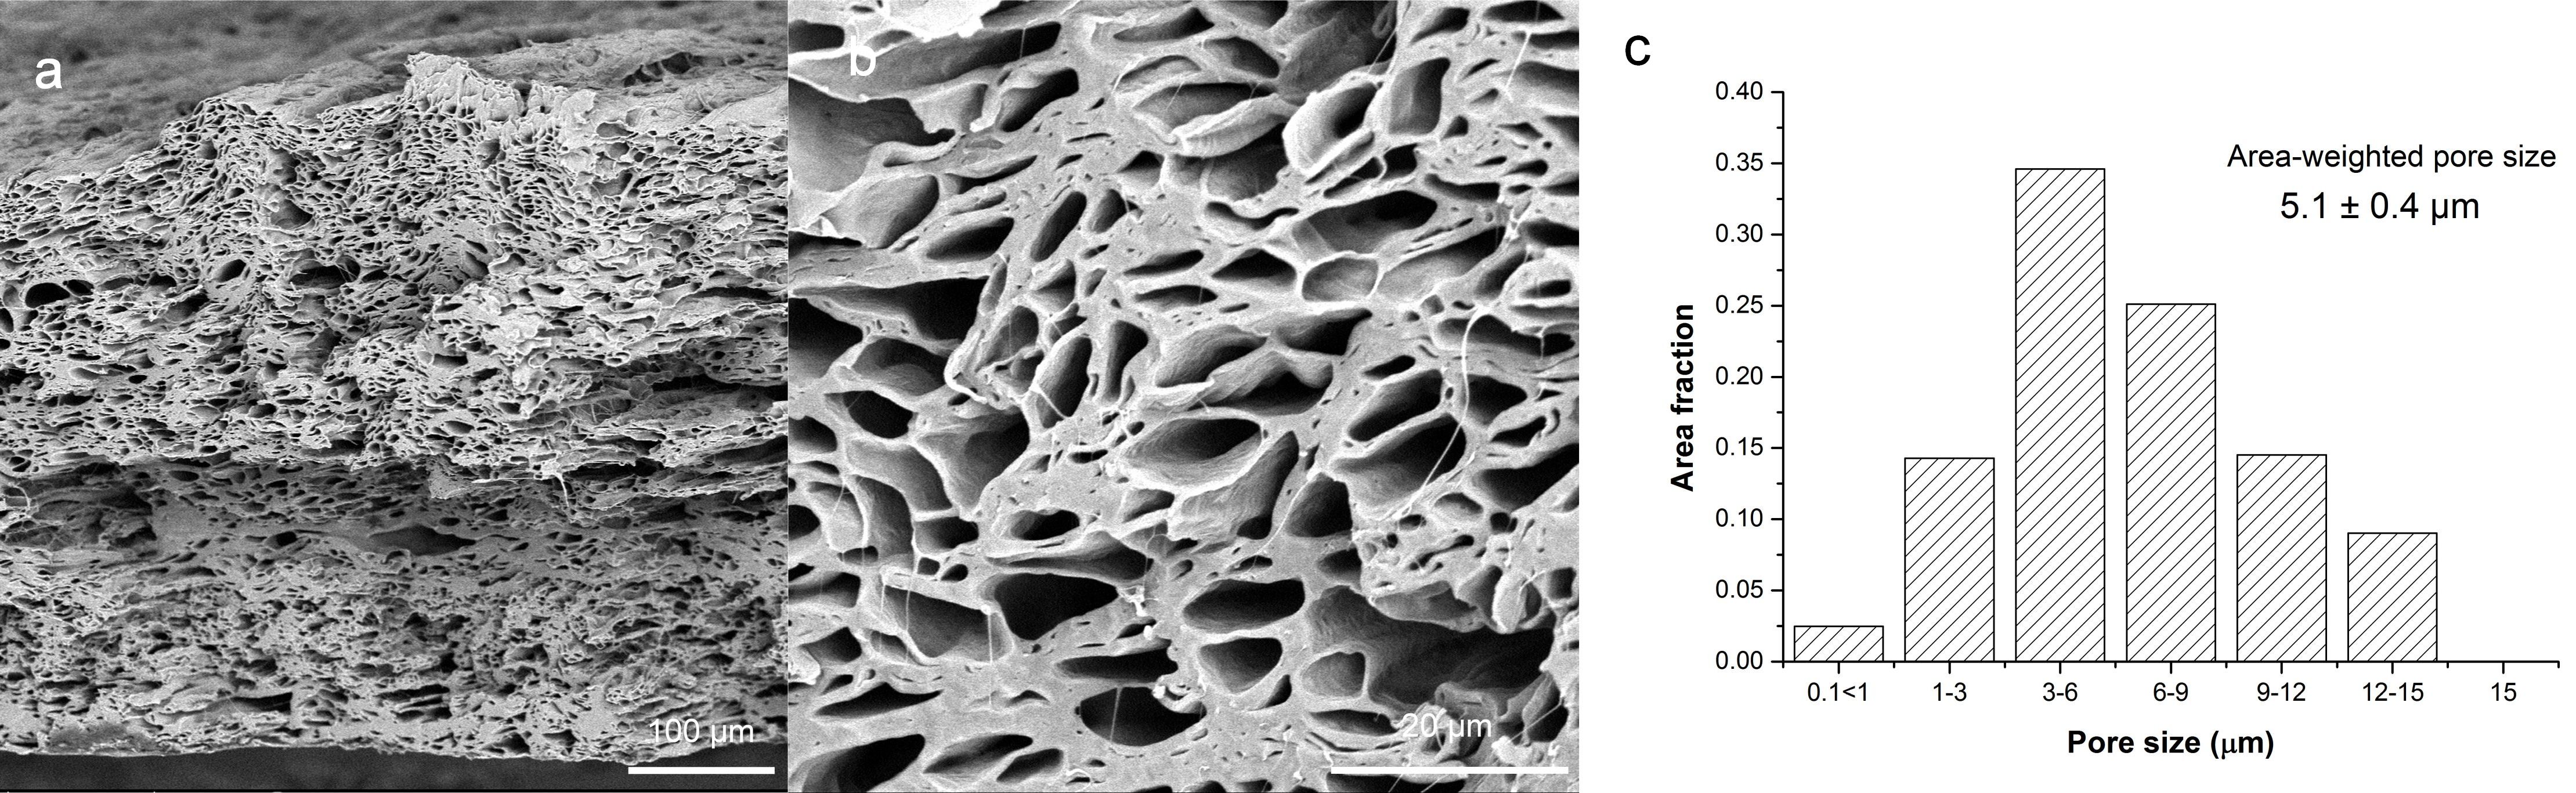
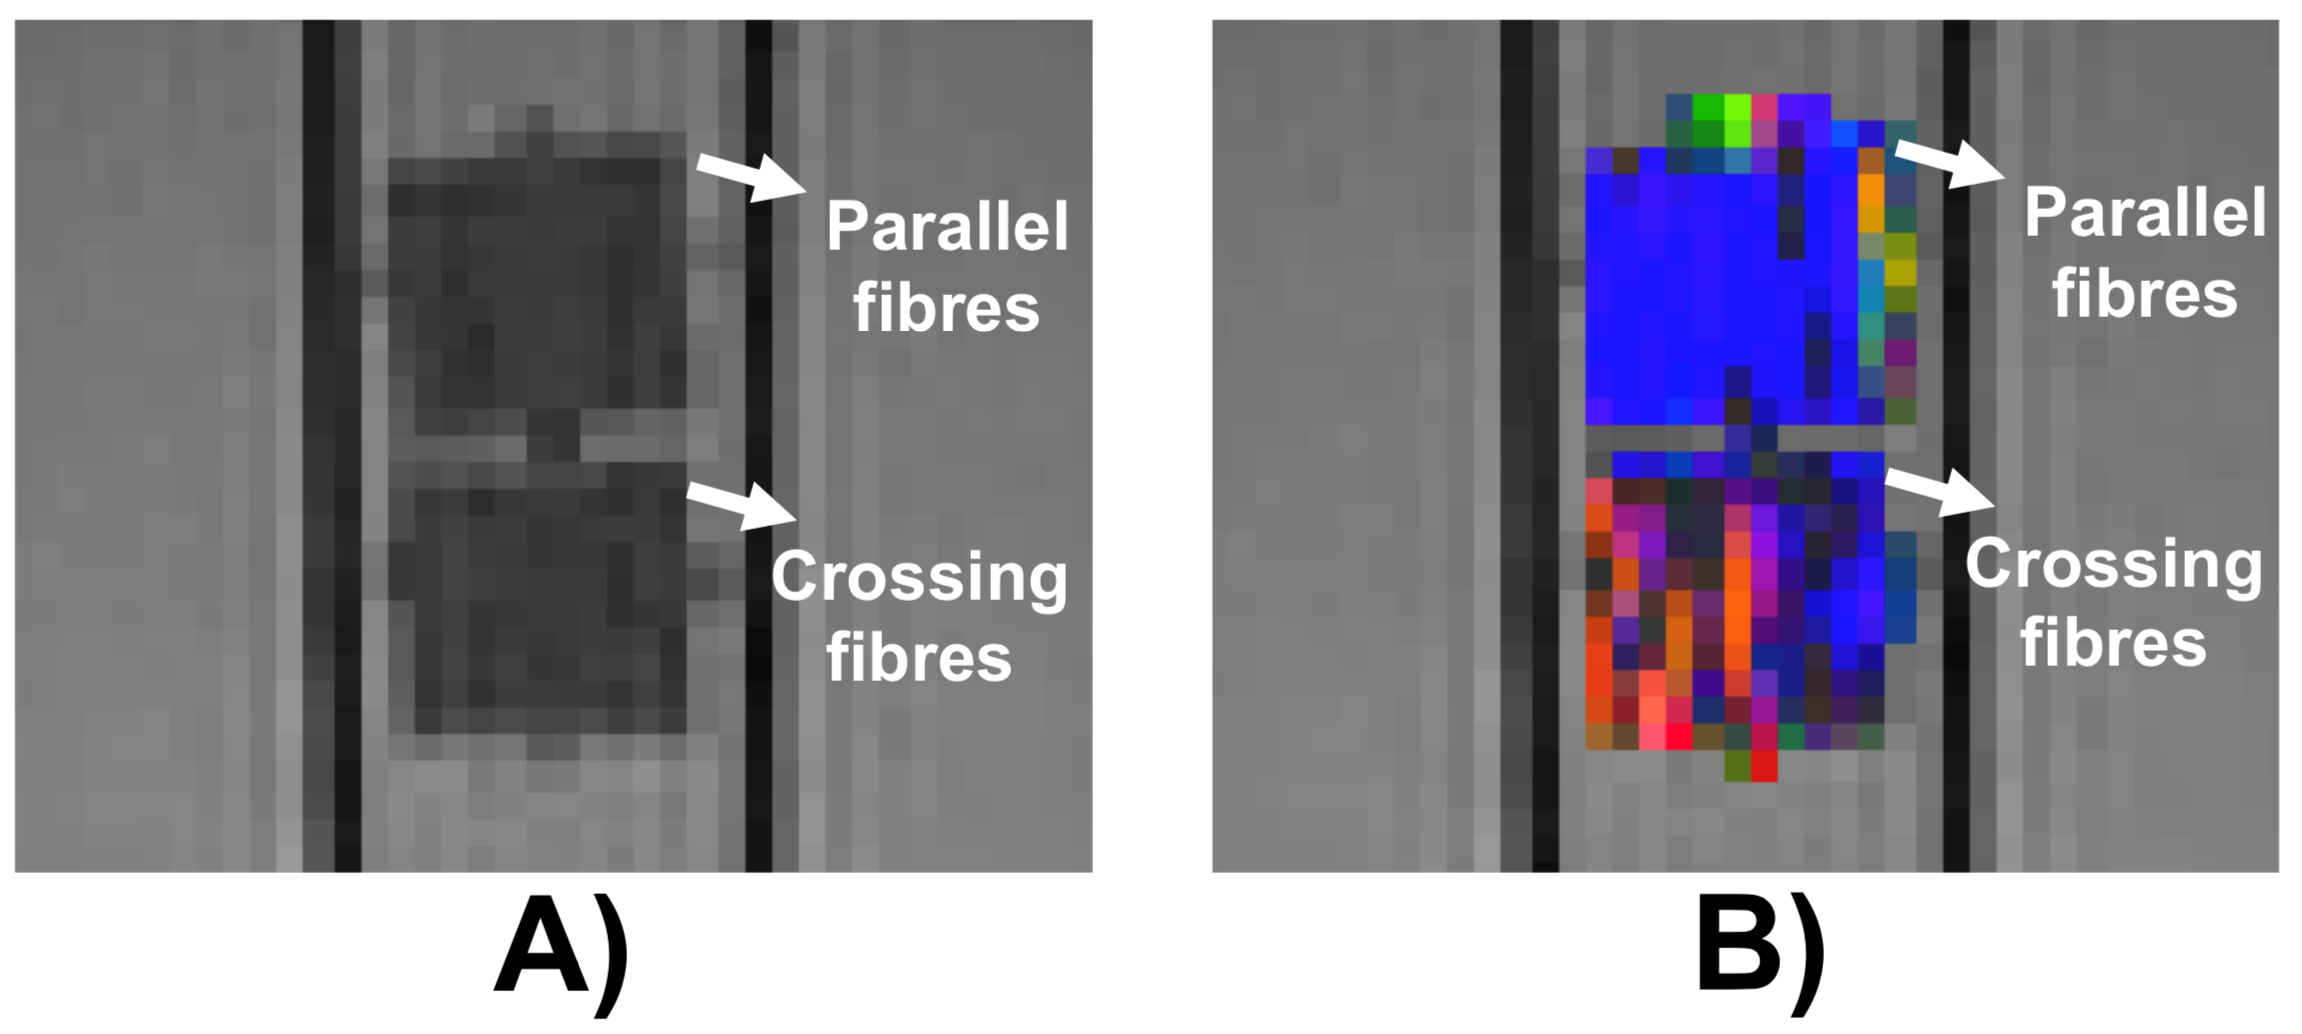
Fig.1 reveals axially-aligned hollow fibres and the range of their pore sizes. There is a broad range of pore sizes within the phantom, reminiscent of axonal distributions in spinal cord.7 The area-weighted pore size of hollow fibres was 5.1 ± 0.4 μm, which is much smaller than those used in brain phantoms.10Figure 2 shows a sagittal view of the two samples and the conventional DTI colour-encoding, which highlights a much stronger directional coherence for the fibres within the sample that does not contain crossings.
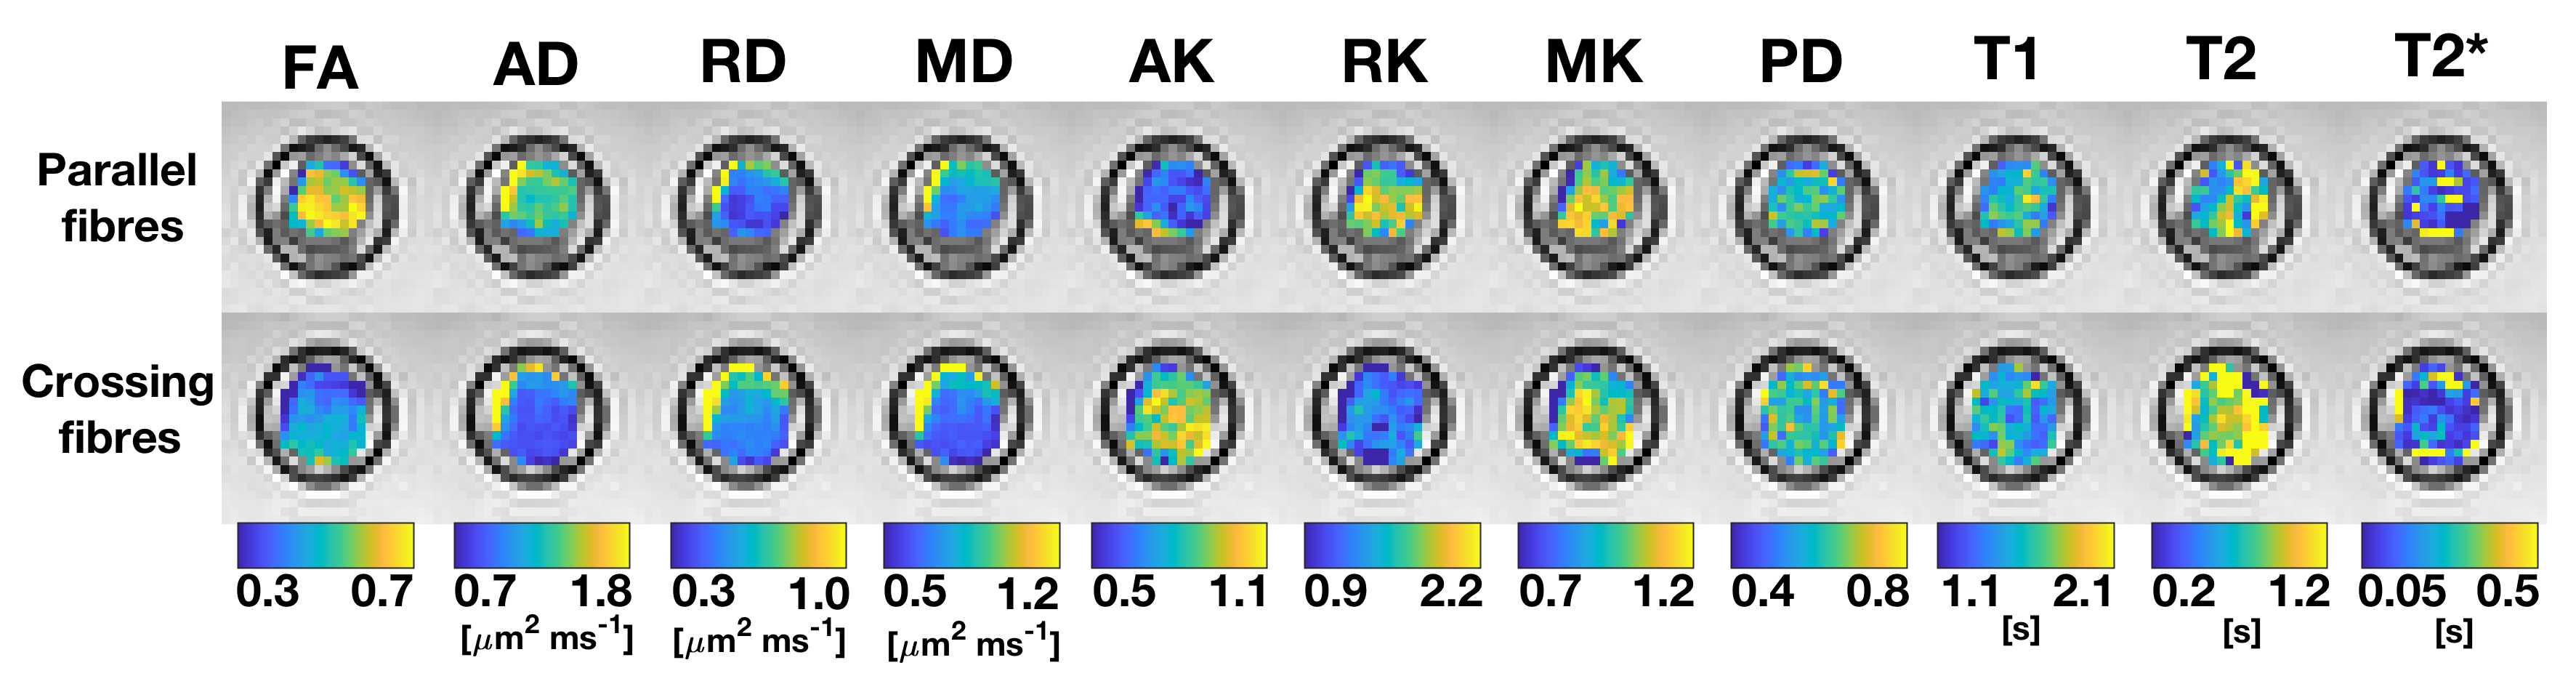
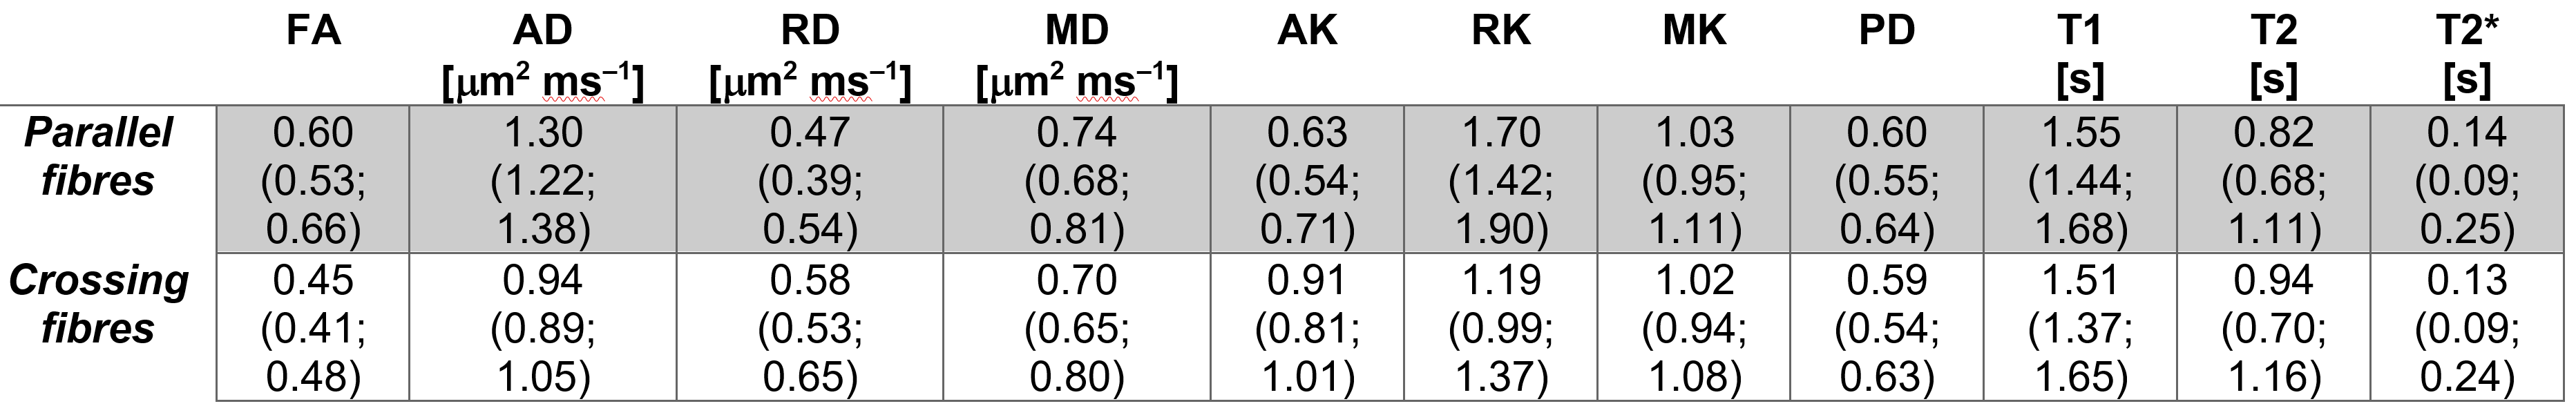
Figure 3 shows quantitative maps in both samples (diffusion metrics were resampled to the SPGR space for visualisation), while Table 1 reports median and IQR of all metrics. Diffusion properties differ considerably in the two samples due to their different fibre microstructure. The sample containing crossing fibres shows considerably smaller FA and AD and higher AK than the other sample. Overall, DTI and DKI metrics fall in a range that is compatible with values that could be observed in vivo.11 The two samples show instead comparable relaxation properties, with relaxation constants longer than that observed in spinal cord white matter in vivo.12
DISCUSSION
The development of clinical spinal cord phantoms requires not only appropriate microstructures and orientation, but also sufficient bulk material to be used with clinical imaging protocols. The macro- and microstructures of microfibres can be effectively controlled using co-electrospinning,5 and have similar microstructure to spinal cord axonal structure, as demonstrated using SEM. The similarity in geometry is reflected in the similarity between our phantom diffusion parametrisations using a ZOOM acquisition and those seen in vivo.CONCLUSION
A novel spinal cord-mimicking phantom has been developed, reflecting in vivo diffusion. The phantom exhibits diffusivity and anisotropy that are in the range expected for spinal cord, indicating that they can provide a helpful standard for diffusion measurements on clinical MR scanners.Acknowledgements
This research was supported by NIHR UCLH Biomedical Research Centre (BRC) grant. GJM Parker has a shareholding and part time appointment and directorship at Bioxydyn Ltd. which provides MRI services. FG is funded by the European Union’s Horizon 2020 research and innovation programme under grant agreement No. 634541 and by the Engineering and Physical Sciences Research Council (EPSRC EP/R006032/1). The QSMSC is supported by the UK Multiple Sclerosis Society (grants 892/08 and 77/2017) and by the Department of Health's National Institute for Health Research (NIHR) Biomedical Research Centres (BRC R&D 03/10/RAG0449). The contribution from Marco Battiston and Becky Samson to the MR sequences is acknowledged. We thank Claudia Wheeler-Kingshott for allowing us total freedom to acquire MR data. We also thank Philips Healthcare for assistance in protocol development and for access to research protocols.References
1. Cohen-Adad J. Microstructural imaging in the spinal cord and validation strategies. NeuroImage. 2018; 182: 169-183.
2. Hubbard PL, Zhou FL, Eichhorn SJ, et al. Biomimetic phantom for the validation of diffusion magnetic resonance imaging. Magn. Reson. Med. 2015; 73: 299-305.
3. Ye AQ, Cristinacce Hubbard PL, Zhou FL, et al. In Diffusion tensor MRI phantom exhibits anomalous diffusion. 36th Annual International Conference of the IEEE EMBS, pp. 746-749. 26-30 Aug. 2014.
4. Teh I, Zhou FL, Hubbard Cristinacce PL, et al. Biomimetic Phantom for Cardiac Diffusion MRI. J. Magn. Reson. Imaging. 2015; 43: 594-600.
5. Zhou FL, Li ZX, Gough JE, et al. Axon mimicking hydrophilic hollow polycaprolactone microfibres for diffusion magnetic resonance imaging. Mater. Design. 2018; 137: 394-403.
6. Zhou FL, Eichhorn SJ, Parker GJM, et al. Production and cross-sectional characterisation of aligned co-electrospun hollow microfibrous bulk assemblies. Mater. Charact. 2015; 109: 25-35.
7. Duval T, Ariane Saliani A, Harris Nami H, et al. Axons morphometry in the human spinal cord. NeuroImage. 2019; 185:119-128.
8. Stikov N, Boudereau M, Levesque IR, et al. On the accuracy of T1 mapping: searching for common ground, Magn.Reson. Med. 2015; 73:514-522.
9. Volz S, Nöth U, Jurcoane A, et al. Quantitative proton density mapping: correcting the receiver sensitivity bias via pseudo proton densities. NeuroImage. 2012; 63:540-552.
10. Zhou FL, McDowell A, Seunarine K, et al. Axon-mimicking hydrophilic fibre phantoms for diffusion MRI, Proceedings of ISMRM 2019, Abstract No. 3636.
11. Grussu F, Ianus A, Tur C, et al. Relevance of time-dependence for clinically viable diffusion imaging of the spinal cord. Magn Reson Med. 2019; 81:1247-1264.
12. Battiston M, Schneider T, Prados F. et al. Fast and reproducible in vivo T1 mapping of the human cervical spinal cord. Mag. Reson. Med. 2018; 79:2142-2148.
Figures