4506
Fundamental Cell Biology Properties Underlying In Vivo DWI
Brendan Moloney1, Eric M. Baker1, Xin Li1, Erin W. Gilbert2, and Charles S. Springer, Jr.1
1Advanced Imaging Research Center, Oregon Health & Science University, Portland, OR, United States, 2Surgery, Oregon Health & Science University, Portland, OR, United States
1Advanced Imaging Research Center, Oregon Health & Science University, Portland, OR, United States, 2Surgery, Oregon Health & Science University, Portland, OR, United States
Synopsis
With cellular ensembles featuring stochastic [“Voronoi”] geometries, Monte Carlo random walk simulated DWI b-space decays exhibit sensitivity to cell biology parameters measuring membrane Na+,K+‑ATPase [NKA] activity, cell density, ρ, and voxel average cell volume, <V>. Furthermore, the simulations matching disparate in vivo tissue [murine xenograft colorectal cancer, human cerebral cortex, and human bladder] experimental b‑space decays have parameters [cellular water efflux rate constant <kio>, ρ, and <V>] in near absolute agreement with the most pertinent literature. Inspecting the common, empirical early decay measure, ADC, of these simulations provides insights into acute and chronic tissue property changes in vivo.
Introduction
Consideration of the longitudinal MR shutter-speed [SS = κ1io] for steady-state trans-cytolemmal water exchange has shown the first-order cellular water efflux rate constant [kio] to have significant contribution from homeostatic Sodium Pump, NKA, activity.1,2 [Definitions, Figure 1.] Though the cell membrane NKA may be biology’s most vital enzyme, its cellular metabolic rate [cMRNKA] - has never been measurable in vivo. So far, accurate kio from 1H2O MR has been possible only when κ1io is sufficiently large - when the extracellular contrast agent (CA) concentration is very high, or B0 is very low.2 Though these can be attained in model systems, they cannot be achieved in vivo.2 A new diffusion-weighted imaging [DWI] analysis requires neither CA nor κ1io, and yields the fundamental, un-factorable cell biology properties: cell density [ρ] and mean cell volume <V>, as well as <kio>.1 ρ and <V> have also not been available in vivo, but they can be estimated from histopathology. These help considerably in constraining the DWI analysis for increased kio precision.Methods
We use Monte Carlo random walks in randomly sized/shaped [“Voronoi”] cell ensembles.3 Figure 2 presents simulations varying each parameter in turn. Each simulation results from 100,000 walks in each of ten different [~ 19,000 cell] ensembles with the same kio, ρ, and V. All particles had the 37oC pure water diffusion coefficient [D0 = 3.0 μm2/ms] inside or outside cells. The ordinates measure log[S(b)/S0], where S(b) and S0 are the transverse signal intensities at b and b = 0. The abscissae report the single-diffusion-encoding sequence b [= (γGδ)2tD: the b unit here, ms/(μm)2, is 1000 times the common s/(mm)2.]Results
With ρ fixed at 180,000 cells/μL, <V> at 5.0 pL [the intracellular volume fraction, vi = ρ<V> = 0.90], Fig. 2a shows increasing <kio> accelerates the non-linear [non‑Gaussian] decay. With <kio> fixed at 12.0 s-1, <V> at 5.0 pL, Fig. 2b reveals increasing ρ decelerates the decay, as expected, but over a large, 50,000 cells/μL, range [140,000 to 190,000]. With ρ fixed at 180,000 cells/μL, <kio> at 12.0 s-1, Fig. 2c shows little V‑dependence, perhaps surprisingly, even with a 30% <V> increase averaged over 105 cells. The large dynamic range for large <kio> in Fig. 2a, is very encouraging. Cell suspension κ1io studies4,5 show that, for aggressive cancer, <kio> can exceed 75 s-1; totally unreachable with CA in vivo.Discussion
In Fig. 2, we also display quality awake human cerebral cortex (1.5T, 3.3 mL ROI) experimental data6 (points). One simulation (green in each panel) matches these remarkably well. We enlarge this in Figure 3, and add murine colorectal cancer xenograft (4.7T, 31 nL ROI)7 and human acellular [ρ = 0] bladder (Li [OHSU]: 3T, 0.72 mL ROI) data. Blue and black [Gaussian decay; pure H2O] simulations also respectively match these results. However, matching goodness is not the only criterion: there are many literature empirical DWI fittings.1 Our simulation parameters are physical quantities that can be validated with independent measurements. Figure 4 shows a table comparing the most pertinent of these [citations given] with the color-coded simulation properties. The ρ and <V> measures are from ex vivo histopathology: kio must be determined from CA studies of viable models that, as above, are likely underestimations. The near absolute agreement is very encouraging. The probabilities of encountering and of permeating cell membranes are the major diffusion determinants, not “viscosity” considerations. It seems <kio>, ρ, and <V> are sufficient to characterize tissue water diffusion.Our ultimate goal is fitting entire experimental voxel b decays to produce absolute <kio>, ρ, and <V> parametric maps [during iterations, the variables will interact]. However, we can appraise clinical implications with the commonly employed empirical ADC values from only the initial decay. We use the conventional b = 1 [Fig. 2 vertical dashed lines] to determine the asymptotic {ln[S(b)/S0]/b} slope [-ADC], for each Fig. 2 curve. Figure 5a shows ADC = f<kio>ρ,V; Fig.5b, ADC = f(ρ)kio,V; and Fig. 5c, ADC = f<V>kio,ρ [i.e., f<V>kio,ρ is the ADC <V>-dependence at constant <kio> and ρ]. In Fig. 5a, the ADC value increases rather linearly with <kio>. Since kio reflects a fast metabolic rate [cMRNKA],1 this suggests acute ADC changes are dominated by fast cMRNKA changes. The Fig. 5 table lists well-known acute ADC changes. Though these are often attributed to <V> changes (e.g., “swelling”), Fig. 5c indicates ADC has very weak <V>‑sensitivity, for a large <V> change. Figure 5b shows ADC decreases rather linearly with ρ. However, large cellularity changes, > 1000 cells/μL, are required. Thus, ρ effects could dominate chronic ADC changes: cancer cell bed ρ can exceed 106 cells/μL, with very small <V> [Fig. 4]. Effective cytotoxic therapy slowly increases the small malignant tumor ADC.1 But, we expect <kio> should give a faster response [ADC decrease; table highlight] for new targeted, cell-sparing therapies. Fig. 5 is also in general agreement with literature values reported for in vivo human brain cortex, trace-averaged D tensor; 0.8 (μm)2/ms.8 It is important to note, our DWI approach is complementary to those focusing on the tissue water anisotropic D tensor nature.
Acknowledgements
Brenden-Colson Center for Pancreatic Care.References
1. Springer, JMR, 291:110-126 (2018). 2. Li, Mangia, Lee, Bai, Springer, MRM, 82:411-424 (2019). 3. Baker, Moloney, Li, Gilbert, Springer, PISMRM 27:3612. 4. Ruggiero, Baroni, Pezzana, Ferrante, Crich, Aime, Angew. Chem. Int. Ed. Engl., 57:7468-7472(2018). 5. Ruggiero, Baroni, Aime, Crich, Mol. Phys., DOI:10.1080/00268976.2018. 1527045 (2018). 6. Clark, Le Bihan, MRM, 44:852-859 (2000). 7. Jiang, Li, Xie, McKinley, Zhao, Gore, Xu, MRM 78:156-164 (2017). 8. Pierpaoli, Jezzard, Basser, Barnett, Di Chiro, Radiology 201:637-648 (1996).Figures
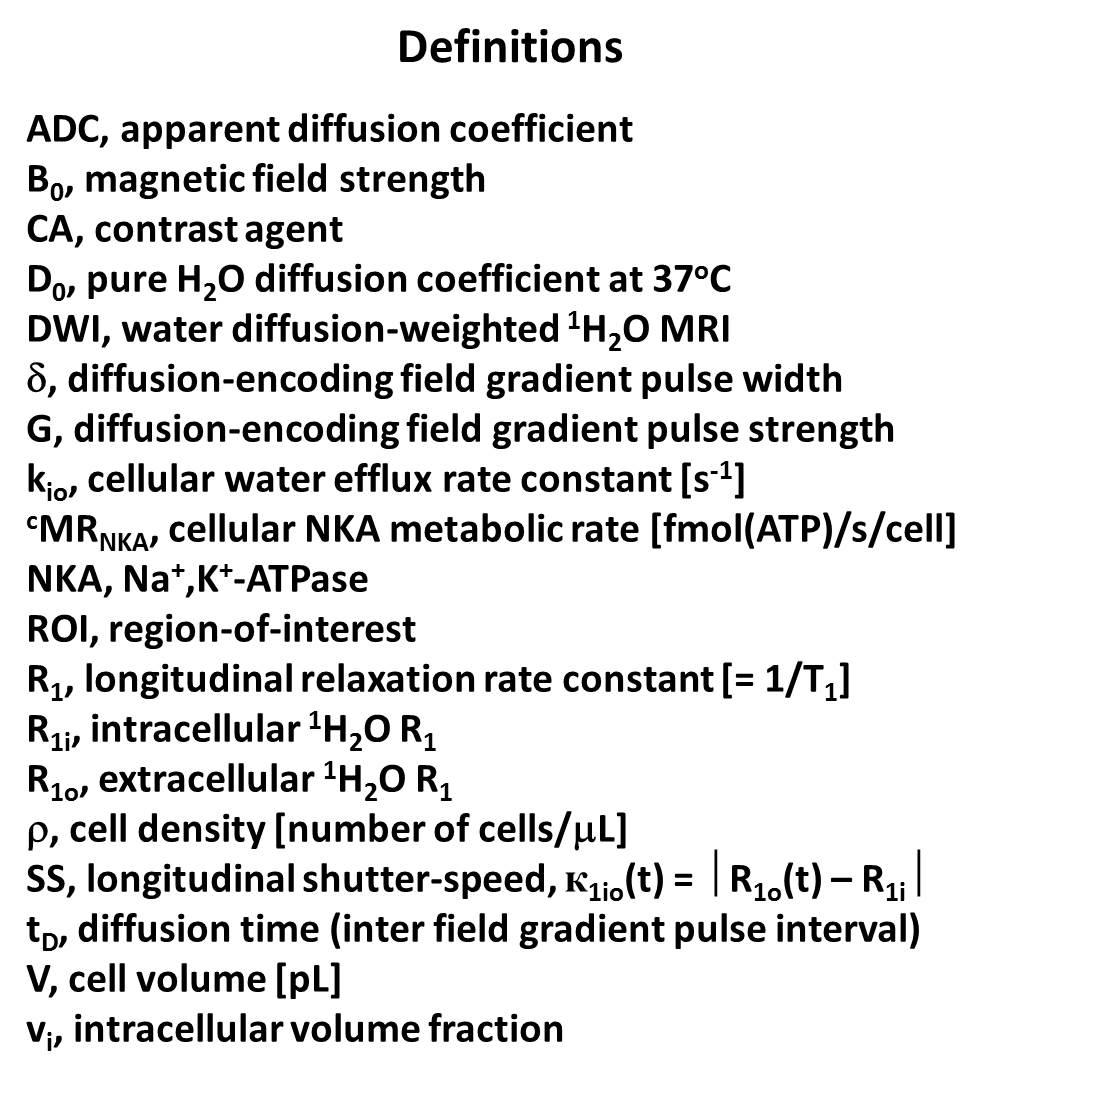
Figure 1. Symbol and acronym definitions.
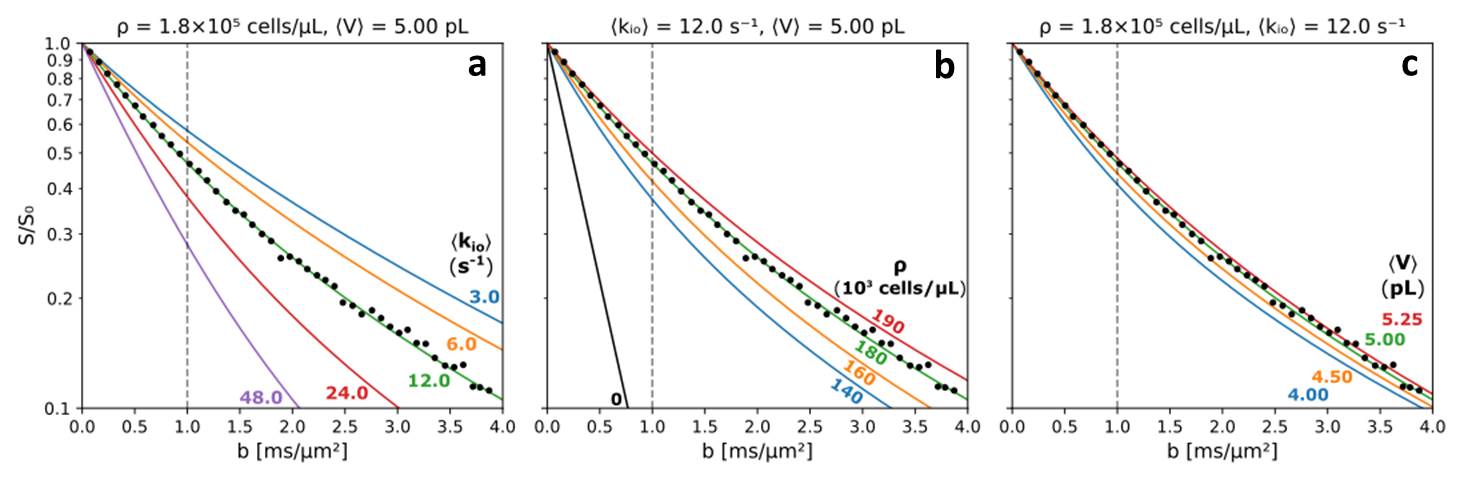
Figure 2. Simulated
b-space decays. (a) ρ = 180,000 cells/μL, <V> = 5 pL, <kio> = 3 (blue), 6 (orange), 12 (green), 24 (red),
48 s-1 (purple). (b) <kio> = 12 s-1, <V> = 5 pL, ρ = 0 (black), 140,000 (blue), 160,000 (orange), 180,000
(green), 190,000 cells/μL (red). (c) <kio> = 12 s-1, ρ = 180,000 cells/μL, <V> = 4.00 (blue), 4.50 (orange), 5.00 (green),
5.25 pL (red). Not formally fitted, the green
curve’s [same in each panel] near absolute agreement with experimental human
cerebral cortex data (points),6 and independent literature parameters
[Fig. 4] is excellent.
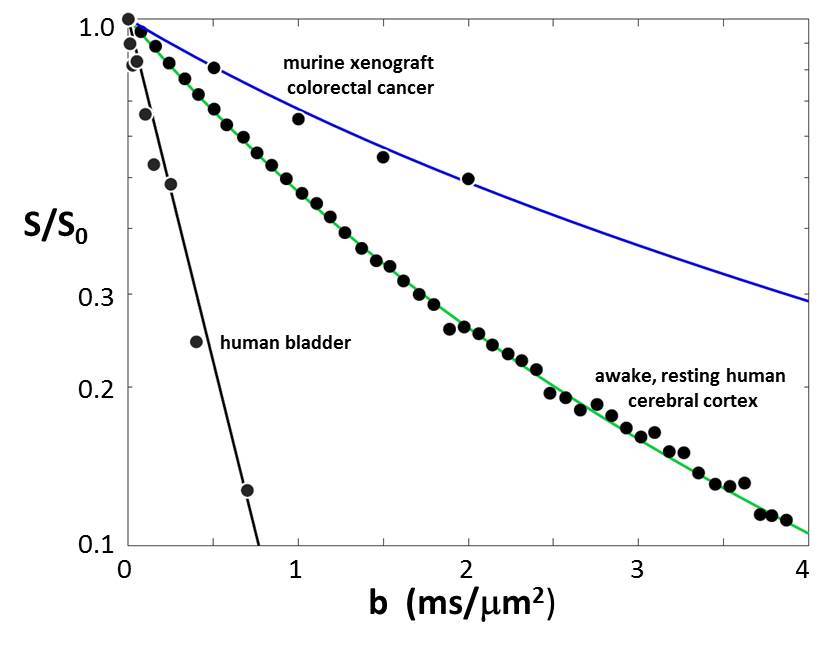
Figure 3. The plot of the Fig. 2 data points and green curve is
enlarged. In addition, murine xenograft
colorectal cancer7 and human bladder data are plotted. The parameters from the blue, green, and
black simulated decays are listed in Fig. 4.
The agreements of the simulated curves and data are excellent.
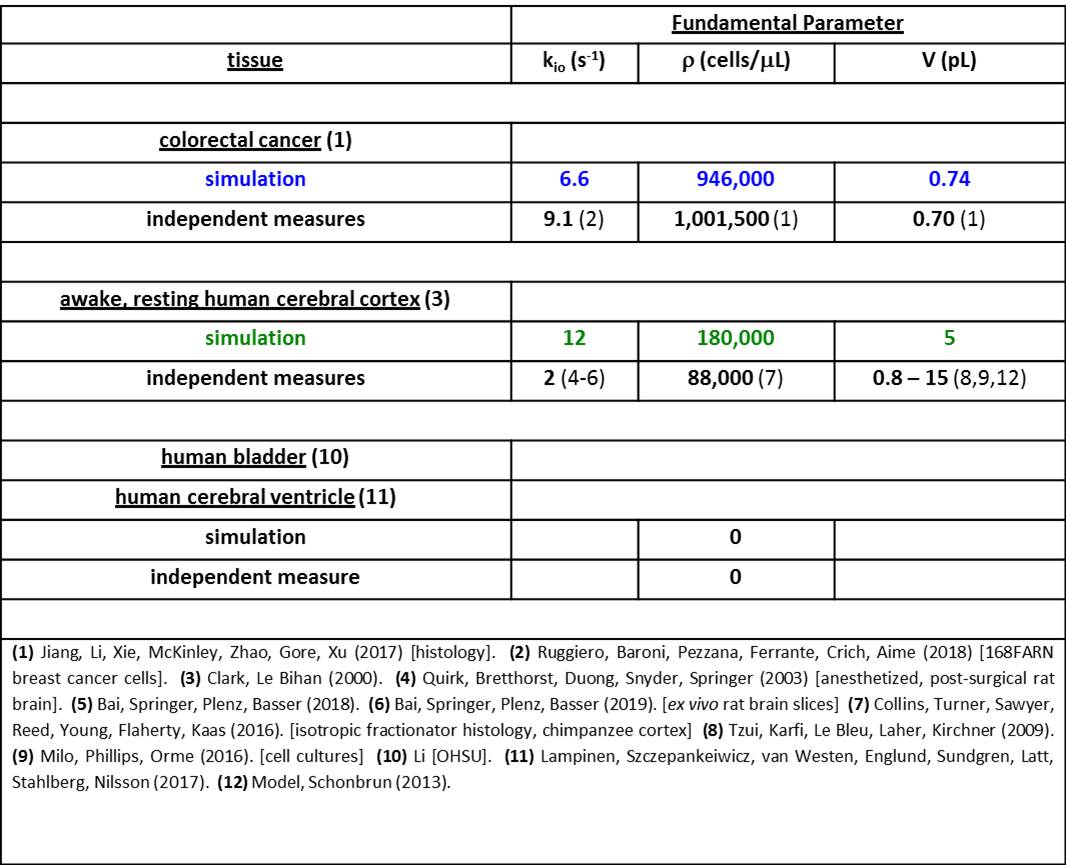
Figure 4. The parameters for the Fig. 3 simulated decays are
color-coded and tabulated. Also, the
most pertinent independent [literature] properties are juxtaposed. The near absolute agreements are very
gratifying.
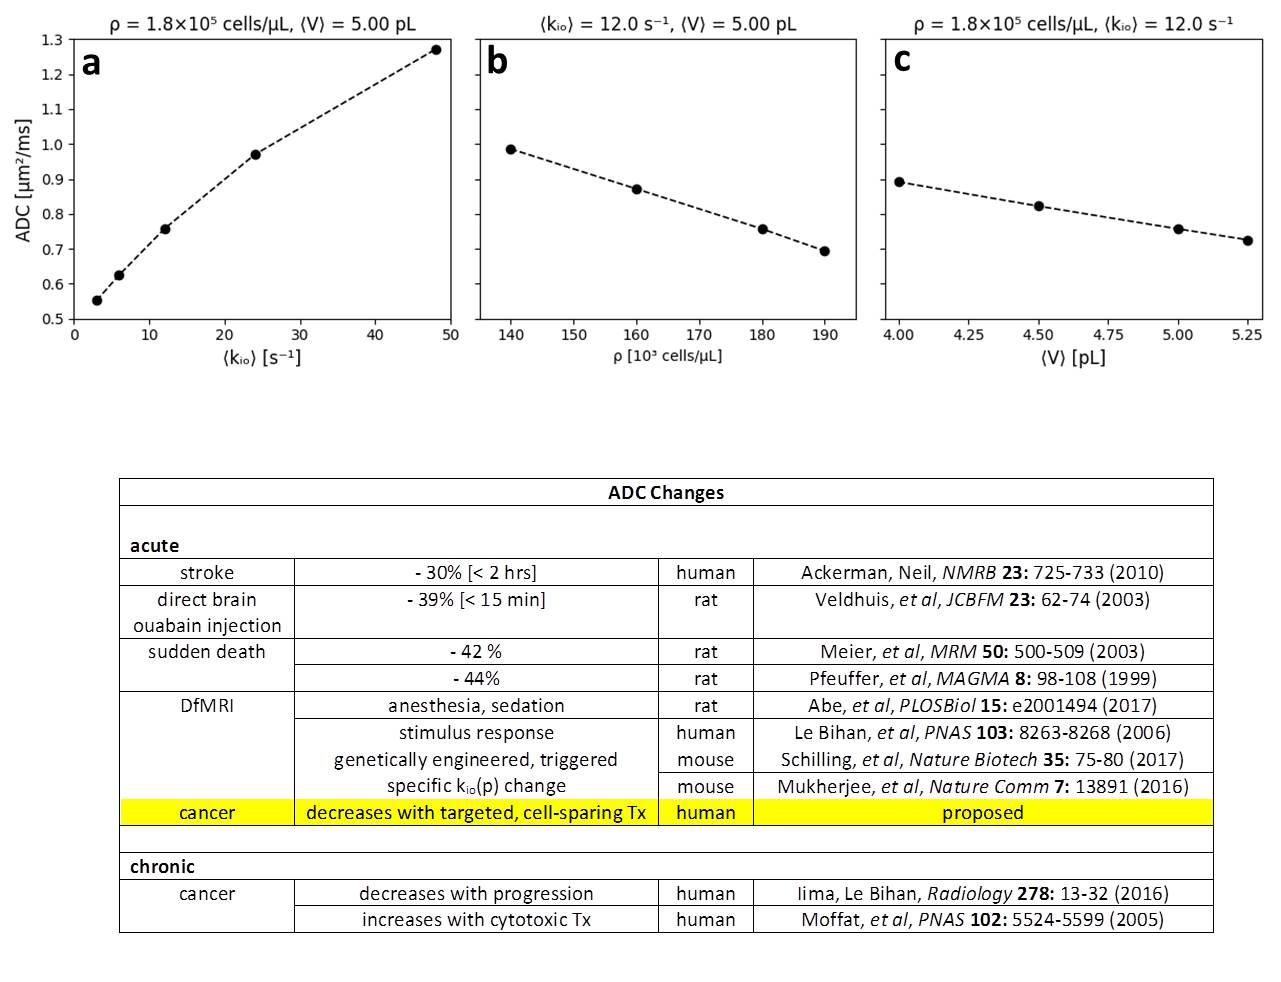
Figure 5. Empirical
apparent diffusion coefficients [ADCs] calculated from the Fig. 2 simulated
decays. This was done, as is
conventional, by drawing a straight line between the computed ln[S/S0]
values at b = 0 and b = 1 for each Fig. 2 curve. The ADC value is the negative of the
slope of this line. Thus, in panel a, we have ADC = f<kio>ρ,V, the ADC <kio>-dependence at constant ρ and V.
In panels b and c, we have, respectively, ADC = f(ρ)kio,V and ADC = f<V>kio,ρ. The
dashed lines are intended only to guide the eye. The table lists literature examples of acute
and chronic ADC changes.