4505
Validation of Diffusion Propagator Imaging measures in White Matter using Histology1Graduate Program for Neuroscience, Boston University, Boston, MA, United States, 2Psychiatry Neuroimaging Lab, HMS, BWH, Boston, MA, United States, 3Department of Psychiatry, MGH, Boston, MA, United States
Synopsis
This study is the first attempt towards histological validation of three advanced diffusion MRI measures derived from the 3D diffusion propagator in white matter tissue: i) return-to-origin-probability (RTOP), ii) return-to-axis-probability (RTAP) and iii) mean squared displacement (MSD), using ex-vivo cat spinal cord tissue. We compared these dMRI measures voxel-wise with the underlying histological properties of the tissue. RTOP and RTAP were found to be significantly correlated with the following biological characteristics: i) Number of axons, ii) Myelin volume fraction and iii) Restricted water fraction, showing that the diffusion propagator imaging measures are sensitive to the underlying white matter microstructural properties.
Introduction
The 3-dimensional diffusion propagator imaging (DPI) derived measures of return-to-origin-probability (RTOP), return-to-axis-probability (RTAP) and mean squared displacement (MSD)1 can accurately model the non-Gaussian nature of the dMRI signal and hence provides a better biophysical model of underlying tissue microstructure compared to the conventional Gaussian diffusion tensor imaging (DTI) measures e.g. fractional anisotropy2,3. RTOP and RTAP are primarily sensitive to restricted water diffusion (e.g. the pore volume3) such as in intra-axonal spaces whereas MSD is predominantly sensitive to the diffusion of water molecules in larger spaces, such as the extra-cellular space and cerebrospinal fluid (CSF) areas. These advanced dMRI measures have been shown to be sensitive to pathology in multiple sclerosis (MS) lesions4 and have also been used in clinical studies e.g. to study ADHD5 and ischemic stroke6. However, to the best of our knowledge, a validation study of these DPI measures in biological tissue has not been done before. Therefore in this study, we used cat spinal cord white matter tissue section7 to investigate how the biological factors such as myelin and axonal properties contribute to the above-mentioned three dMRI measures.Methods
A cervical segment of cat spinal cord was extracted upon perfusion which was then post-fixed with 4% paraformaldehyde7. After fixing the tissue, two contiguous pieces were cut. First piece was scanned on an MRI scanner, whereas the second piece was used for histology.DMRI: Ex-vivo multi-shell dMRI scan of the first axial slice from the cervical segment of a cat spinal cord was acquired7 on a Agilent 7T animal scanner equipped with 600 mT/m gradients: resolution = 0.156x0.156x1.49 mm3, 195 gradient directions for each of the 4 b-values: 40,190,1680,6720 s/mm2. Since the signal decay is not visible for the low b-values of 40 and 190 s/mm2 in ex-vivo tissue, they were discarded from our analysis.
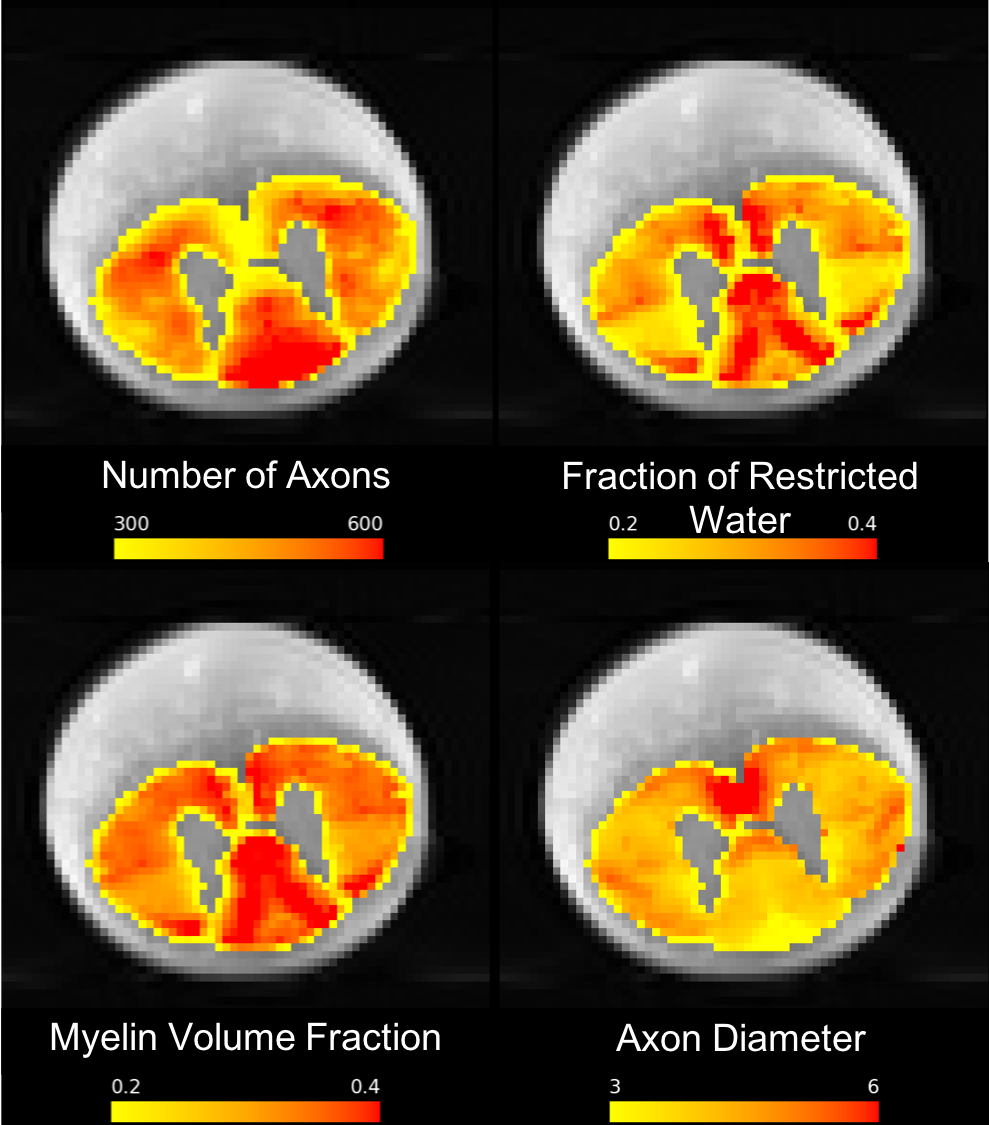
Histology: Additionally histological data was also acquired7 for the second cat spinal cord axial slice, after performing the ex-vivo tissue processing. Tissue processing involved staining with 4% osmium, dehydration, embedding in paraffin, cutting in 4 mm slices followed by digitizing with the resolution of 230 nm/pixel using an optical 20x whole slice microscope (Hamamatsu NanoZoomer 2.0-HT). Axons were automatically segmented using AxonSeg software8: https://github.com/neuropoly/axonseg. This axon-segmented image was downsampled to match the resolution of dMRI scan and then registered to the dMRI scan using affine transformation. Histological scalar maps of the number of axons, myelin volume fraction, fraction of restricted water and axon diameter were computed using the axon-segmented digitized histological slice (Figure 2).
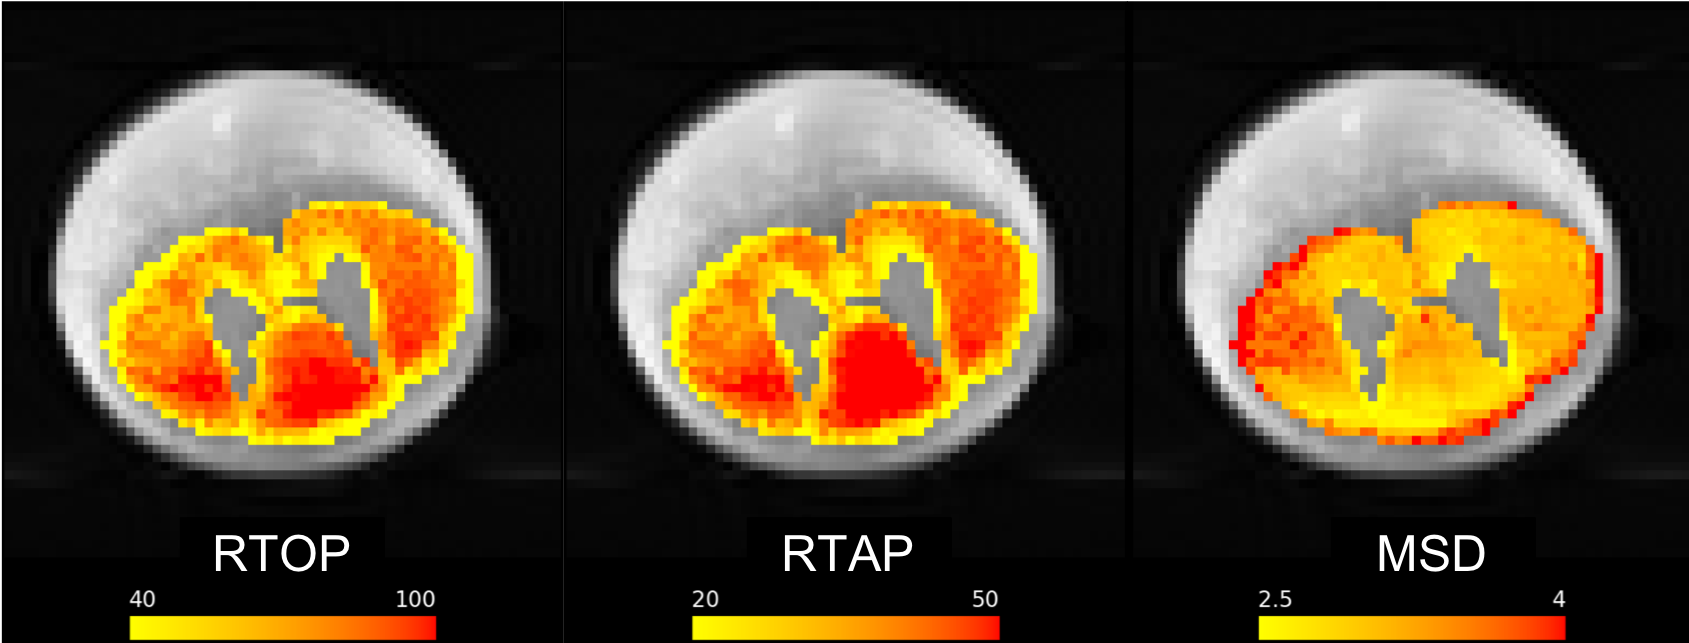
Biexponential Model: Bi-exponential model9 was fit to the multishell dMRI data upon removing b-values of 40 and 190 s/mm2. Since the spinal cord does not contain crossing fibers, the model fitting was initialized using the principal diffusion direction obtained from a single tensor fit. The bi-exponential diffusion model described in9 allowed to estimate the three-dimensional probability distribution of the displacement of water molecules in the tissue, while removing the cerebrospinal fluid CSF partial volume effect. Model-fitting was followed by computing the scalar maps for measures of RTOP, RTAP and MSD (Figure 1).
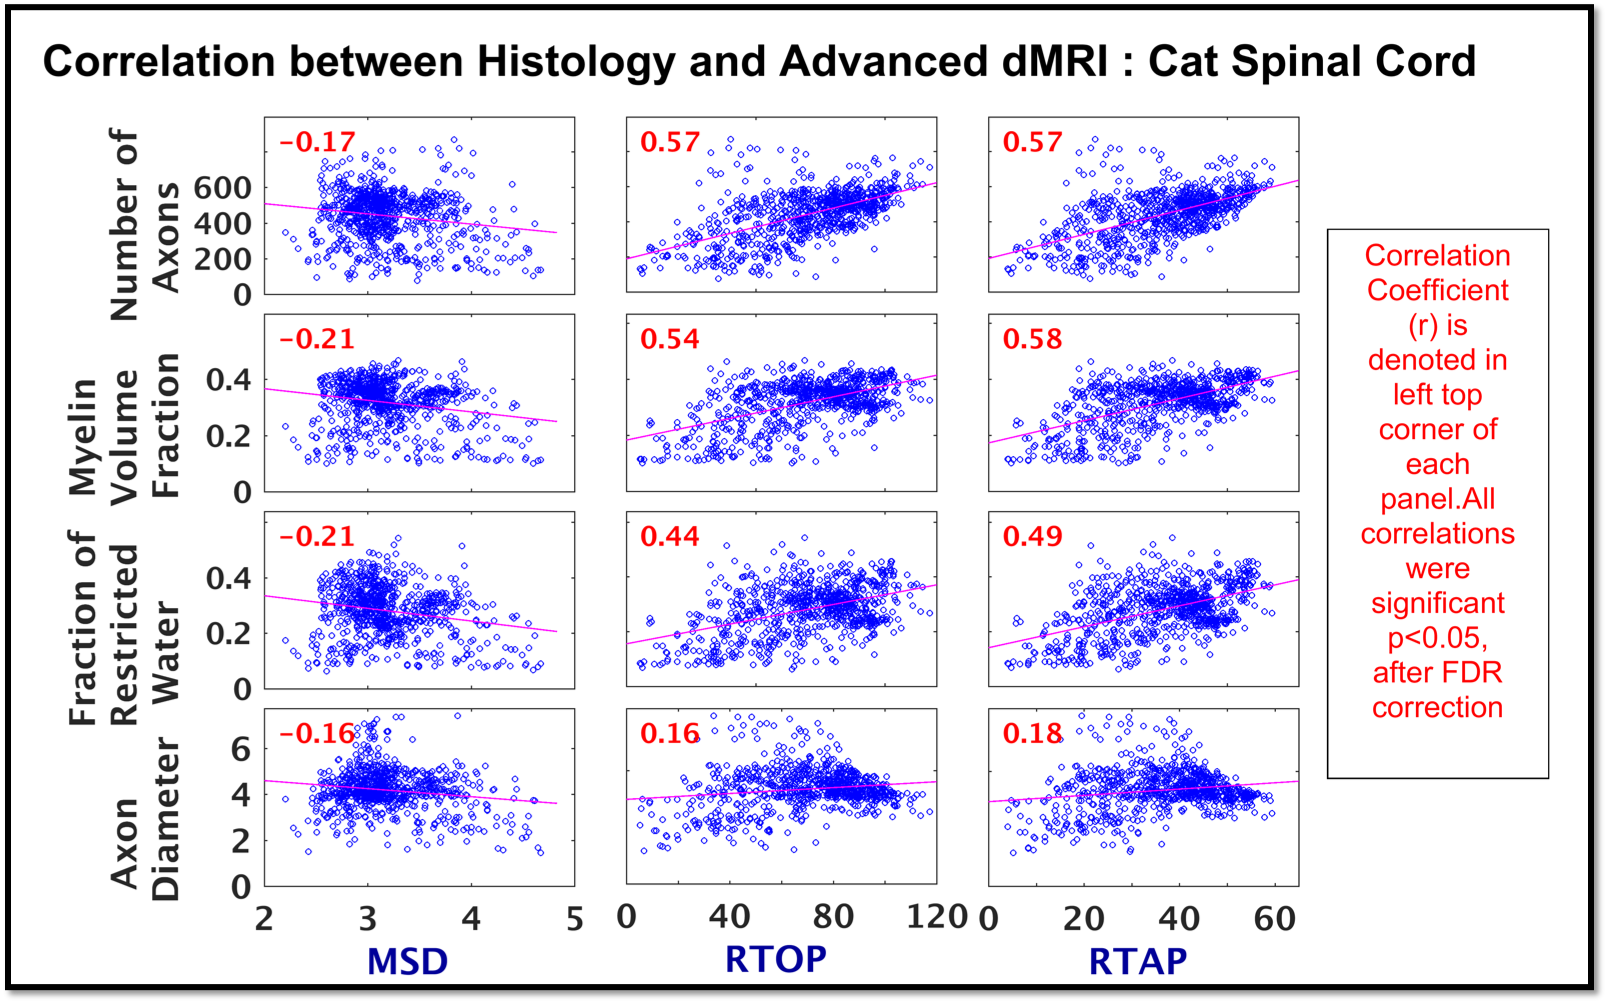
Comparison of dMRI vs Histology: We then compared voxel-by-voxel, our diffusion measures of RTOP, RTAP and MSD with histological measures of number of axons, myelin volume fraction, fraction of restricted water and axon diameter using Pearson correlation. Multiple comparisons correction of p-values was done using FDR correction.
Results
Histological measures of number of axons, myelin volume fraction and fraction of restricted water from cat spinal cord white matter showed moderate correlation with dMRI measures of RTOP and RTAP (range: r = 0.44 : 0.58, p<0.05; Figure 3), but weak correlation was observed for axon diameter with RTOP and RTAP (r = 0.16, 0.18 resp, p <0.05; Figure 3). On the other hand, as expected, all histological measures showed weak negative correlation with MSD (range: r = -0.16: -0.21, p < 0.05; Figure 3).Discussion and Conclusion
This study presents a first attempt towards histological validation of DPI measures of RTOP, RTAP and MSD in white matter using the cat spinal cord tissue section. Results show that the advanced dMRI measures of RTOP and RTAP are highly influenced by number of axons, myelin volume fraction and fraction of restricted water, whereas DTI-derived FA correlated only with fraction of restricted water10. Furthermore, our results suggest that these dMRI measures are not only sensitive to WM microstructure, but the different measures of RTOP/RTAP and MSD possibly represent distinct biophysical properties of the underlying microstructure and hence differ in their sensitivity to the histological measures. We thus conclude that higher the restriction due to more myelin or higher number of axons, higher the RTOP and RTAP. We also note that, none of these measures are sensitive to axon diameter, which is consistent with the observations made in several other works10 related to the “sensitivity limit” of dMRI in general to the axon diameter measurements (and not just limited to the measures we investigated here).Acknowledgements
R01MH111917 (PIs: Dougherty, Makris, Rathi).References
1. Ning L, Westin C-F, and Rathi Y. Estimating diffusion propagator and its moments using directional radial basis functions. IEEE Trans. Med. Imaging. 2015;34(10): 2058–2078
2. Avram A V et al. Clinical feasibility of using mean apparent propagator (MAP) MRI to characterize brain tissue microstructure. NeuroImage. 2016; 127:422–434.
3. Özarslan E et al. Mean apparent propagator (MAP) MRI: a novel diffusion imaging method for mapping tissue microstructure. NeuroImage. 2013; 78:16–32.
4. Assaf Y et al. High b-value q-space analyzed diffusion-weighted MRI: application to multiple sclerosis. Magn. Reson. Med. 2002; 47(1):115–126.
5. Wu W et al. Detecting microstructural white matter abnormalities of frontal pathways in children with ADHD using advanced diffusion models. Brain Imaging Behav. 2019.
6. Boscolo Galazzo I , Brusini L, Obertino S, et al. On the Viability of Diffusion MRI-Based Microstructural Biomarkers in Ischemic Stroke. Front. Neurosci. 2018; 12
7. Duval T, Perraud B, Vuong M-T, et al. Validation of quantitative MRI metrics using full slice histology with automatic axon segmentation. ISMRM. 24, Singapore; 2016. vol. 0928.
8. Zaimi A, Duval T, Gasecka A, et al. AxonSeg: Open Source Software for Axon and Myelin Segmentation and Morphometric Analysis. Front. Neuroinformatics. 2016; 10.
9. Rathi Y, Gagoski B, Setsompop K, et al. Diffusion Propagator Estimation from Sparse Measurements in a Tractography Framework. MICCAI. 2013; 16(3): 510–517.
10. Nilsson M, Lasič S, Drobnjak I, et al. Resolution limit of cylinder diameter estimation by diffusion MRI: The impact of gradient waveform and orientation dispersion. NMR Biomed. 2017; 30(7): e3711.
Figures