4504
Intravoxel Tissue Heterogeneity: One-to-one Correspondence between Non-Gaussian Diffusion MRI Parameters and Histologic Features1Center for Magnetic Resonance Research, University of Illinois at Chicago, Chicago, IL, United States, 2Department of Bioengineering, University of Illinois at Chicago, Chicago, IL, United States, 3Department of Electrical and Computer Engineering, University of Illinois at Chicago, Chicago, IL, United States, 4Department of Computer Science, University of Illinois at Chicago, Chicago, IL, United States, 5Department of Pathology, University of Illinois at Chicago, Chicago, IL, United States, 6Departments of Radiology and Neurosurgery, University of Illinois at Chicago, Chicago, IL, United States
Synopsis
The parameters of the continuous-time random-walk (CTRW) model have been shown to be related to the underlying tissue heterogeneity. However, it has been challenging to establish a rigorous correlation between the CTRW parameters and the gold-standard histology. This is primarily because the histopathological evaluation of tissue heterogeneity is a labor-intensive task. We develop a machine-learning algorithm that quantifies the microscopic tissue heterogeneity revealed by histology as probability maps; and demonstrate a one-to-one correspondence between the CTRW parameters and tissue structural heterogeneity. Our results have provided evidence towards establishing a correlation between the CTRW parameter values and tissue heterogeneity.
Introduction:
Biological tissues exhibit a high degree of structural heterogeneity due to the presence of heterogeneous cell populations, subcellular structures, and physiologic or pathologic variations. Tissue heterogeneity has been one of the most important diagnostic criteria for many diseases, particularly for cancer1-3. In recent years, probing the underlying tissue heterogeneity has been the main motivation of several diffusion-weighted MRI (DWI) studies. Recognizing the deviation of diffusion displacements from Gaussian distribution in a heterogeneous medium, several non-Gaussian DWI models have been proposed to extract tissue heterogeneity information. One of these models, continuous-time random-walk (CTRW) model4-7, describes the non-Gaussian diffusion dynamics in terms of diffusion waiting time and jump length distributions, and theoretically links the temporal and spatial heterogeneity of the diffusion process to tissue structural heterogeneity. Recent experimental studies have further suggested a possible link between the CTRW model parameters and the underlying microscopic tissue heterogeneity4-7. As in many other DWI models, however, it has been challenging to establish a rigorous correlation between the voxel-level CTRW parameters and the gold-standard histology. This is primarily because the histopathological evaluation of tissue heterogeneity is a labor-intensive task without a consistent standard or rigorous quantification. In this study, we develop a machine-learning algorithm that quantifies the microscopic tissue heterogeneity revealed by histology as probability maps; and demonstrate a one-to-one correspondence between the CTRW parameters and tissue structural heterogeneity.Materials and Methods:
The workflow of the project is given in Fig.1.Classification of Histology Images: A machine-learning algorithm was trained with histology images from 7 normal and 9 abnormal brain samples, which were labeled with three degrees of microscopic heterogeneities as non-heterogenous, low-heterogenous, and high-heterogenous. For each category, 50 prototype image regions (i.e., patches), each consisting of 1000×1000 independent pixels, were used. QuPath software was used to generate 33 statistical features characterizing nuclei and surrounding structures within each patch. To quantitatively classify brain tissue according to their heterogeneity levels, a random forest algorithm with Python's Scikit-Learn machine-learning package was employed. Model performance was validated using a 10-fold cross-validation.
DWI Acquisition and Analysis of Tissue Sample: A tissue specimen from a normal appearing region of a human brain was scanned on a 9.4T Agilent MRI scanner. The MRI protocol included anatomic T1 and T2 imaging, followed by DWI with 16 b-values from 0 to 5000 s/mm² (TR/TE = 2000/28ms, slice thickness = 0.3mm, Δ = 18ms, δ = 2.5ms, in-plane resolution = 0.25×0.25 mm2). Trace-weighted images were obtained to minimize the effect of diffusion anisotropy. The multi-b-value diffusion images were analyzed using a CTRW model5,
$$ S/S_0=E_α (-(bD_m )^β) $$
where Dm is an anomalous diffusion coefficient, Eα is a Mittag-Leffler function, and α and β are temporal and spatial diffusion heterogeneity parameters, respectively4-7. A nonlinear least-squares algorithm was used to obtain the CTRW parameters.
Quantitative Histological Analysis: After MRI, the tissue specimen was H&E stained; and sectioned into a total of 50 histology slides, consisting of five 5μm-thick histology slides corresponding to the central region of each imaging slice. Each digitized histology slide was partitioned into small tiles with the same spatial resolution as the DW images. For each tile, probabilities of being in each of the three heterogeneity classes were predicted, and heatmaps of the predicted probability was generated for each histology slide.
Results:
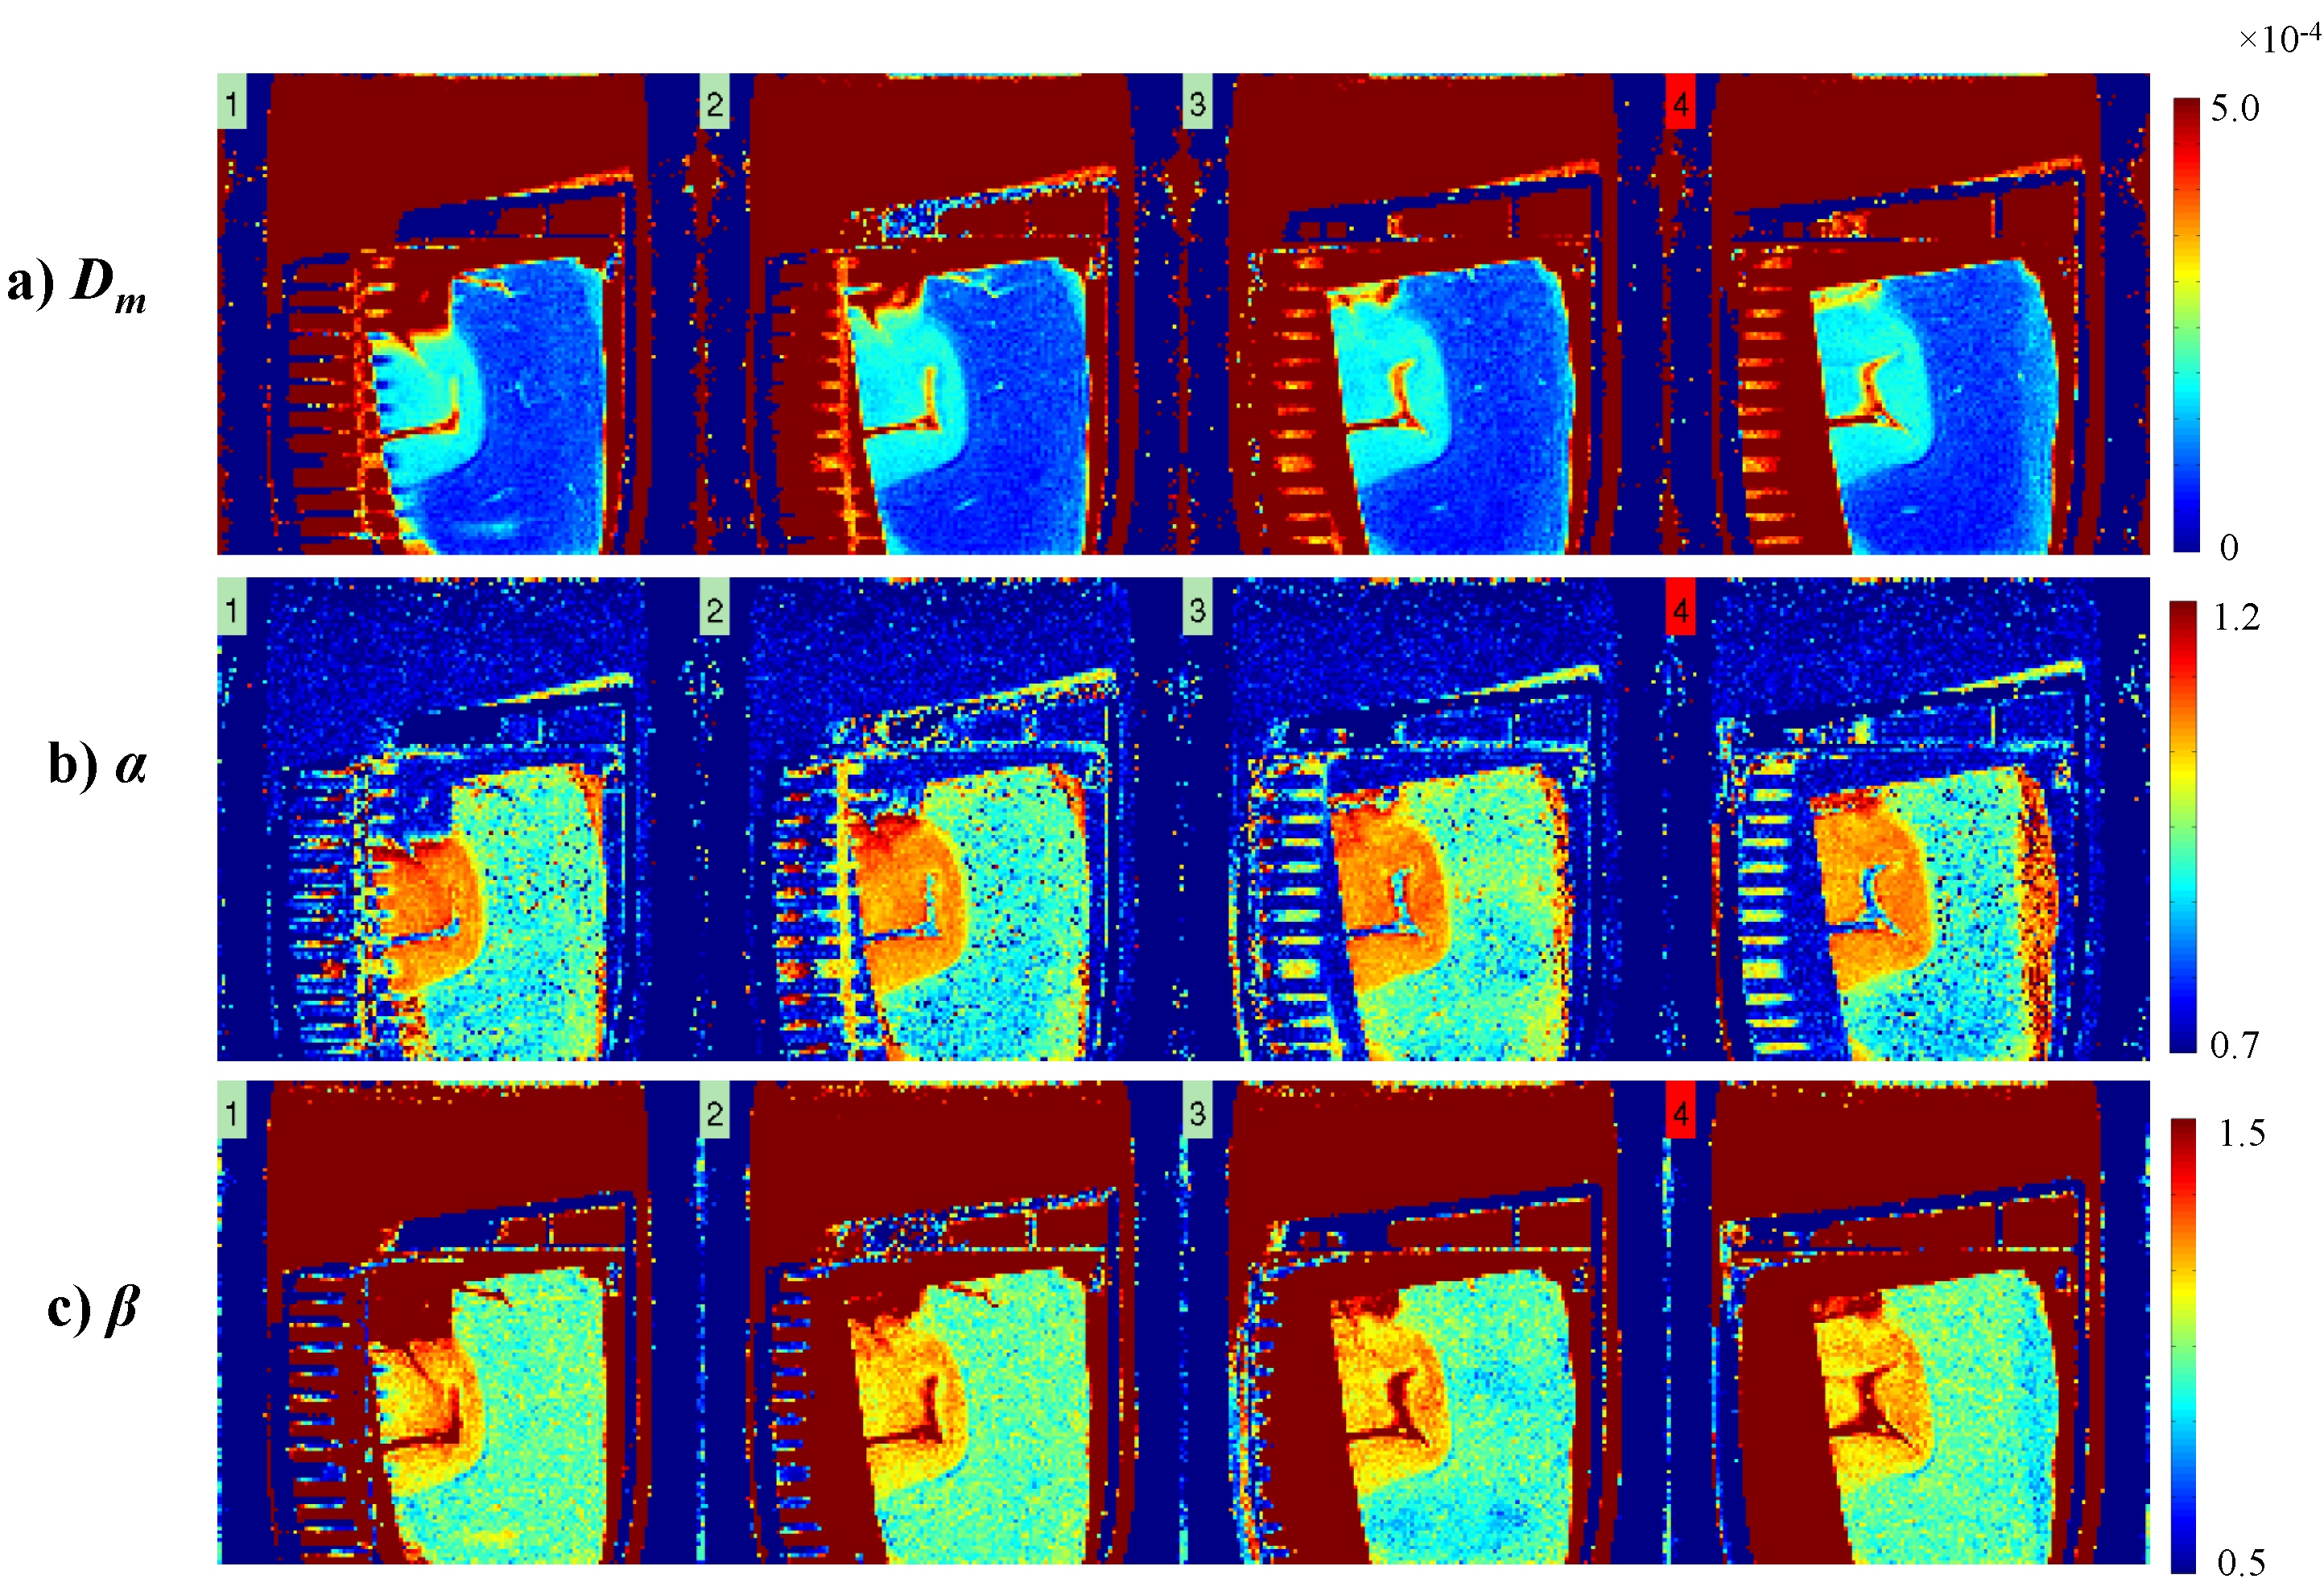
Figures 2a-3c display Dm, α, and β maps from eight representative slices. A clear separation between gray matter (GM) and white matter (WM) regions can be observed in the parameter maps. The voxels in WM exhibited substantially lower values than those in GM in all parameters. The histology-based tissue heterogeneity classification determined by the random forest algorithm resulted in a cross-validation score of 0.906. The nucleus area, cell area, and cell perimeter were among the top three most important features as shown in Figure 3. Figure 4a shows the maps of CTRW parameters, Dm, α, and β, obtained from a representative slice for demonstration. Figure 4b shows the heatmaps of the predicted probability of each class, non-heterogeneous (first column), low-heterogenous (second column), and high-heterogenous (third column), obtained from the corresponding histology slide. The regions with lower CTRW parameter values, such as WM, were found to have higher values in the high-heterogeneity heat map. Conversely, the voxels with higher CTRW parameter values, such as GM, showed higher probability values in the low-heterogeneity heat map.Discussion and Conclusion:
Using a machine-learning algorithm, we have semi-quantitatively evaluated microscopic tissue heterogeneity revealed by histopathology without human intervention. This has enabled us to demonstrate a one-to-one correspondence between CTRW model-based diffusion heterogeneity and histology-based tissue structural heterogeneity. Our results have provided evidence to establish a negative correlation between the CTRW parameter values and level of tissue heterogeneity, as predicted theoretically and supported by prior experimental studies.Acknowledgements
This work was supported in part by (5R01EB026716-01 and 1S10RR028898-01). We thank Dr. Peter S. LaViolette and Medical College of Wisconsin Tissue Bank for providing the tissue specimen.References
[1] Meacham CE, Morrison SJ. Tumour heterogeneity and cancer cell plasticity. Nature. 2013;501(7467):328–37.
[2] Bedard PL, Hansen AR, Ratain MJ, et al. Tumour heterogeneity in the clinic. Nature. 2013;501(7467):355–64.
[3] Fletcher CDM. The evolving classificiation of soft tissue tumors – an update based on the new 2013 WHO classification. Histopathology. 2014;64(1):2-11.
[4] Sui Y, He W, Damen FW, et al. Differentiation of low- and high- grade pediatric brain tumors with high b-value diffusion weighted MR imaging and a fractional order calculus model. Radiology. 2015;277(2):489–496.
[5] Karaman MM, Sui Y, Wang H, et al. Differentiating low- and high-grade pediatric brain tumors using a continuous-time random-walk diffusion model at high b-values. Magn Reson Med. 2015; 76:1149-1157.
[6] Sui Y, Xiong Y, Xie KL, et al. Differentiation of low- and high-grade gliomas using high b-value diffusion imaging with a non-Gaussian diffusion model. Am J Neuroradiol. 2016; 37:1643-1649.
[7] Tang L, Sui Y, Zhong Z, et al. Non-Gaussian diffusion imaging with a fractional order calculus model to predict response of gastrointestinal stromal tumor to second-line sunitinib therapy. Magn Reson Med. 2017.
Figures