4502
Double-Diffusion-Encoding MRI: phantom evaluation of concomitant gradient effects with single- and twice-refocused sequences
Lisa Novello1, Stefano Tambalo1, Thorsten Feiweier2, and Jorge Jovicich1
1CIMeC, Center for Mind/Brain Sciences, University of Trento, Rovereto, Italy, 2Siemens Healthcare GmbH, Erlangen, Germany
1CIMeC, Center for Mind/Brain Sciences, University of Trento, Rovereto, Italy, 2Siemens Healthcare GmbH, Erlangen, Germany
Synopsis
In Double-Diffusion-Encoding sequences, concomitant gradients may introduce spatial bias in the measured MRI signal. It is important to characterize such biases since they can affect the accuracy of quantitative microstructural metrics in brain studies. In this work, we assess the signal deviations at different positions along the scanner z-axis in an isotropic phantom for both single- and twice-refocused spin-echo sequences.
Introduction
Double-Diffusion-Encoding (DDE) MRI sequences1 are attracting a growing interest since in the long mixing time regime they allow to characterize diffusion anisotropy at a microscopic scale without confounding effects of structural macroscopic arrangements (e.g. axonal fibers orientations in the brain)2,3. This can be achieved by encoding diffusion twice in a single acquisition (Fig. 1). However, such encoding strategies might be affected by concomitant gradients corrupting the diffusivity estimation in brain tissue, as a function of sample position, slice orientation and sequence details4. In this study, we used a clinical scanner to evaluate the possible impact of concomitant gradients in DDE MRI as a function of two factors: sample position (isocenter and off-centered along z-axis) and sequence variations (pulsed gradient (PG) diffusion encoding with single refocused spin-echo (PG-SE) and twice-refocused spin-echo (PG-TRSE), respectively).Materials and Methods
Images from an isotropic brain-sized spherical oil phantom were collected on a 3T scanner (MAGNETOM Prisma, Siemens Healthcare, Erlangen, Germany) with a 64 channel head-neck RF coil. Multishell axial images were collected with a prototype sequence utilizing Single Diffusion Encoding (SDE PG-SE), DDE PG-SE and DDE PG-TRSE (i) by centering the phantom position at the scanner isocenter (isocenter condition), and (ii) by centering the phantom position at z = 75 mm (off-center condition, DDE images only). The adopted sequence applies a compensation of linear concomitant field contributions. For all conditions and sequences, a b = 0 s/mm2 image and DWI images with the following b-values were acquired: 100, 700, 1400, 2000 s/mm2 4. Imaging parameters were: FOV = 272 x 272 mm2, isotropic resolution = 2 mm, number of slices = 68, no slice gap. For all images, Partial Fourier (PF) = 0.75, GRAPPA = 2. For SDE PG-SE images, 64 directions were acquired per shell, TE = 60 ms, TR = 9200 ms. For all DDE images, a total of 72 direction combinations were acquired per shell using the 5-design scheme2. TE = 140 ms, TR = 11900 ms. δ = 21.9 ms, Δ = 31.1 ms, TM = 14.7 ms (Fig. 1). All data was eddy-current and motion corrected in ElastiX using extrapolated references4,5. For each b-shell and DWI gradient encoding, in a single phantom reference slice at z = 0 and z = 75, we computed the mean S(b)/S(0) ratio, where S(b) is the signal from each DWI volume and S(0) the signal from the b = 0 s/mm2 volume, including only voxels within a circle 16 mm apart from the phantom surface (Fig. 2). Mean ratio differences between positions per each sequence were investigated by means of paired t-tests in R. Standard Deviation (SD) values were computed for each b-value, sequence, and condition combination.Results
Distributions of mean ROI S(b)/S(0) ratios are shown in Fig. 3. For all b-values, the paired t-tests revealed significant mean S(b)/S(0) ratio differences as a function of phantom position for the DDE PG-SE (for all b-values, p < 1*10-5) but not the DDE PG-TRSE sequences (for all b-values, p > .01). Interestingly, the DDE PG-TRSE sequence showed the largest SD value both in the isocenter and off-center positions for all b-values (largest SD: off-center condition, b = 2000 s/mm2, SD(S(b)/S(0)) = 0.0175, Fig. 4).Discussion
Concomitant gradients have been shown to introduce detrimental effects on DDE-MRI quality4. The experimental evaluation of possible signal deviations potentially occurring within the brain volume is an important quality assurance check. In our experiment, we adopted an isotropic phantom to detect possible directionally dependent signal deviations which could not be associated to the phantom microscopic properties. In agreement with previous literature reports4, our results suggest that significant differences in signals arise at 75 mm from the isocenter in DDE PG-SE but not in PG-TRSE sequences, which is compatible with possible concomitant field effects, despite the applied compensation for linear contributions. Interestingly, we observed larger SD for mean ROI S(b)/S(0) ratios in DDE PG-TRSE sequences. While theoretically PG-TRSE sequences are expected to be free of concomitant gradients effects, we speculate that the observed signal variation might be instead associated with eddy-currents effects. Evaluating signal deviations at variable positions with respect to the isocenter is an important quality assurance check to assess the spatial uniformity of diffusivity estimation throughout the volume considered.Acknowledgements
No acknowledgement found.References
[1] Shemesh N., et al., Magn. Reson. Med., 2016, 75:82-87
[2] Jespersen S.N., et al., NMR Biomed., 2013, 26:1647–1662
[3] Özarslan E., JMR, 2009, 199:56-67
[4] Szczepankiewicz F., et al., Magn. Res. Med., 2019, 82(4):1424-1437
[5] Nilsson M., et al., PLoS One, 2015, 10(11): e0141825
Figures
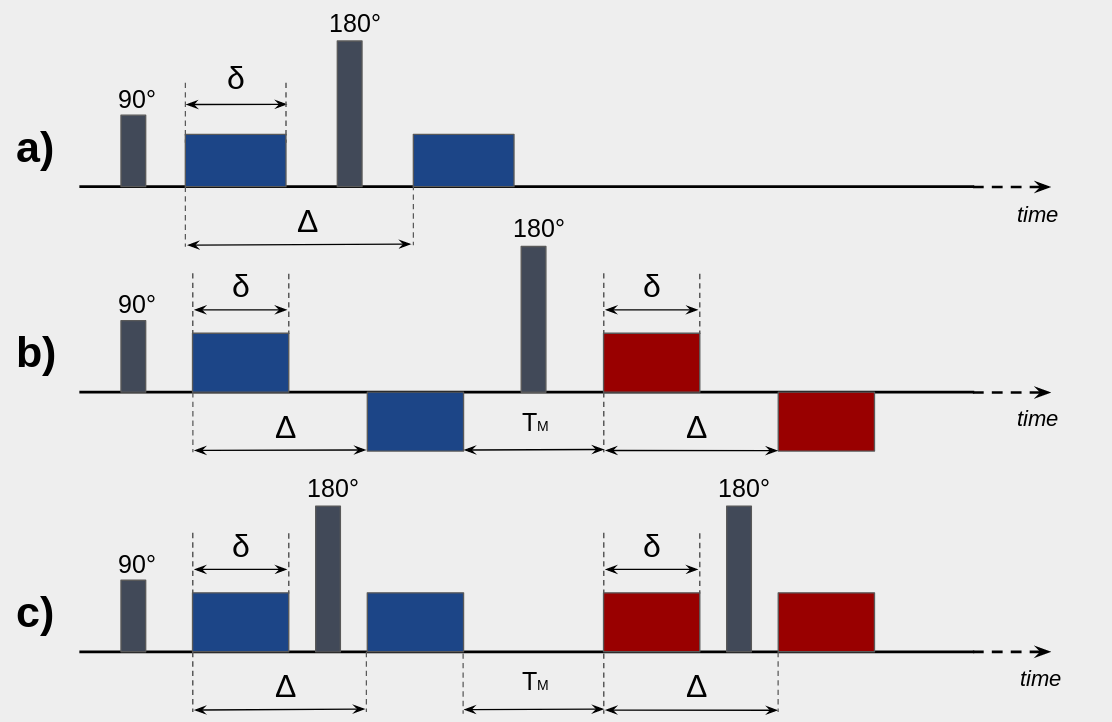
Fig.
1: Schematic diagrams of diffusion
preparations adopted in the current work. a) SDE PG-SE sequence; b)
DDE PG-SE sequence; c) DDE PG-TR-SE sequence. δ,
Δ and TM
were the same in the DDE PG-SE and the DDE PG-TR-SE sequence.
Different colors represent different diffusion encoding
directions.
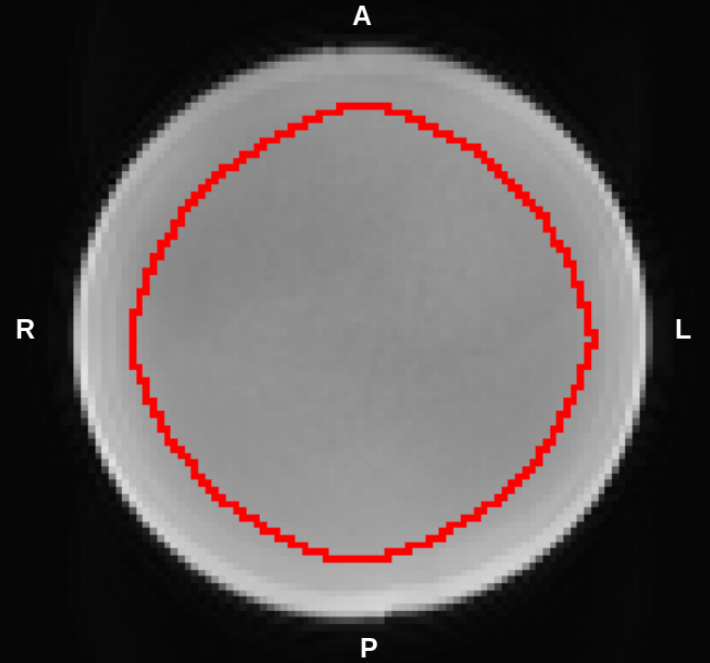
Fig.
2: Phantom slice area considered in the
analysis: only voxels within the red circle were
included. The outer rim, 16 mm thick, was excluded to limit the
impact of possible residual eddy-current induced distortions at
phantom interfaces from the analysis.
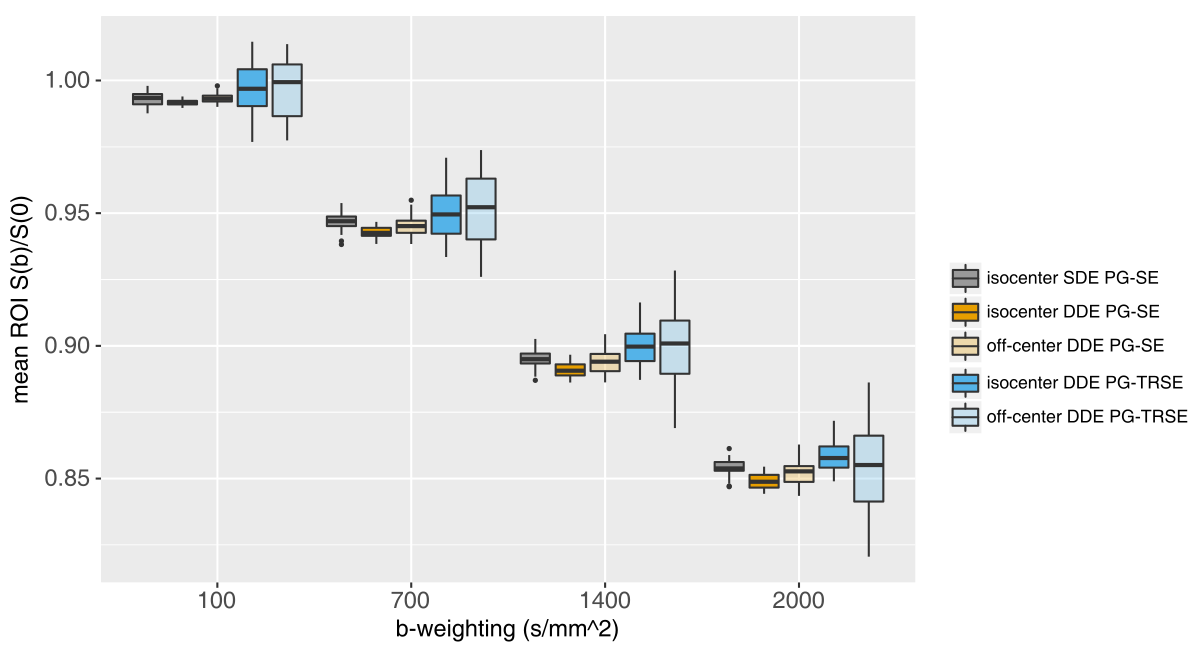
Fig.
3: Boxplots of mean phantom S(b)/S(0)
ratios for all gradient encoding directions, positions, and sequences
across the four measured b-values.
ROI = Region of Interest (area included in the analysis, i.e.
phantom area in slices corresponding to z = 0 mm (isocenter
condition) and to z = 75 mm (off-center condition). The 16 mm outer
rim was excluded from the analysis - see Fig. 2).
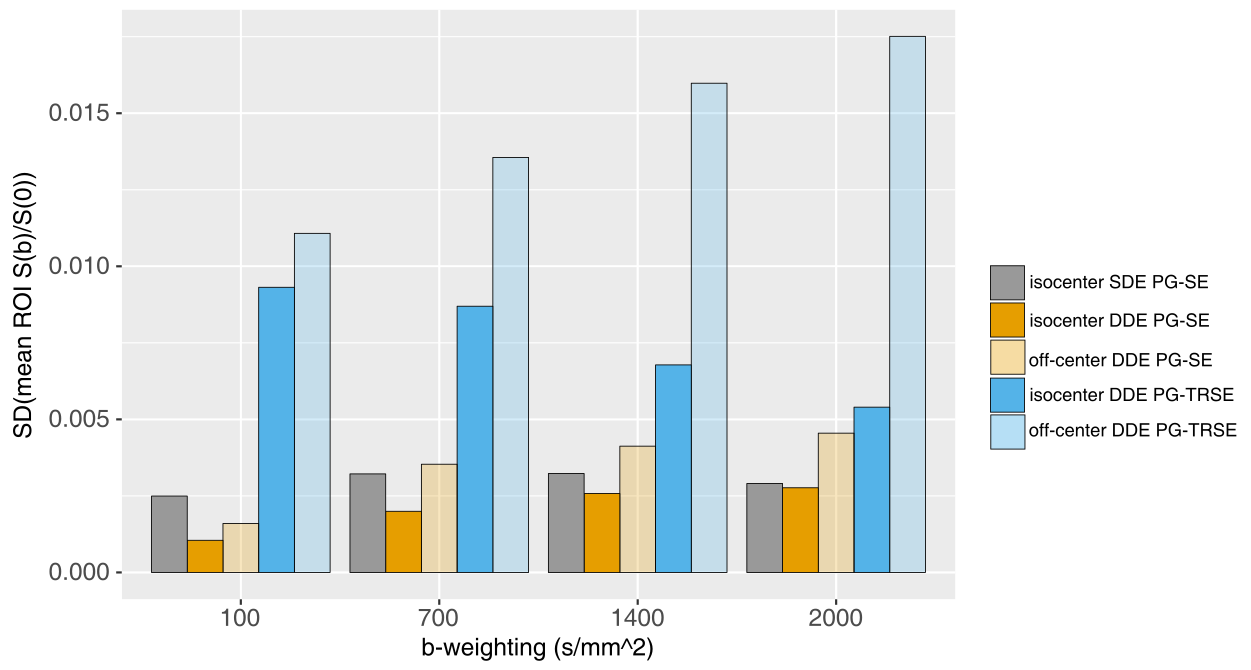
Fig.
4: Bar graphs showing standard
deviations of mean phantom S(b)/S(0)
ratios for all directions, positions, and sequences across the four
measured b-values.