4500
Characterization of orientation dispersion’s impact on diffusion kurtosis and NODDI using an axon-mimetic 3D printed phantom
Tristan K. Kuehn1,2, Farah N. Mushtaha2, Omar El-Deeb3, Amanda Moehring3, Corey A. Baron1,2,4, and Ali R. Khan1,2,4,5
1School of Biomedical Engineering, Western University, London, ON, Canada, 2Centre for Functional and Metabolic Mapping, Robarts Research Institute, Western University, London, ON, Canada, 3Department of Biology, Western University, London, ON, Canada, 4Department of Medical Biophysics, Western University, London, ON, Canada, 5The Brain and Mind Institute, Western University, London, ON, Canada
1School of Biomedical Engineering, Western University, London, ON, Canada, 2Centre for Functional and Metabolic Mapping, Robarts Research Institute, Western University, London, ON, Canada, 3Department of Biology, Western University, London, ON, Canada, 4Department of Medical Biophysics, Western University, London, ON, Canada, 5The Brain and Mind Institute, Western University, London, ON, Canada
Synopsis
Existing phantoms used to validate diffusion MRI models of white matter microstructure struggle to represent the complex fibre configurations found in vivo. Here we demonstrate a 3D printed phantom that realizes several complex fibre configurations inexpensively. We prepare a set of phantoms and use them to characterize the change in diffusion MRI model parameters with fibre curvature and crossing fibres. Most parameters computed by DTI, kurtosis, and NODDI had relationships with fibre crossing angle. These phantoms are a promising tool for evaluating the effect of orientation dispersion on diffusion MRI models of white matter.
Introduction
Diffusion MRI models of white matter microstructure struggle to differentiate between signal variation caused by changes in microstructure and signal variation caused by complex axonal fibre configurations like bending, crossing, and fanning.1,2 The effect of orientation dispersion on diffusion MRI in vivo is difficult to quantify because the underlying fibre geometry is typically unknown. Scans of artificial phantoms offer real scan data with an associated ground truth, but complex fibre configurations are difficult to achieve with existing physical phantoms.3We propose a phantom produced using fused deposition modeling 3D printing of a composite material called PORO-LAY, composed of a rubber elastomer and PVA.4 The PVA dissolves in water, leaving fibrous pores with an orientation determined by the 3D print direction (Fig. 1). Printing complex patterns of material allows these phantoms to exhibit complex diffusion patterns that more closely resemble those seen in vivo. Here we demonstrate the ability to print complex patterns and investigate how they affect the best-fit parameters of a variety of diffusion MRI signal representations.
Methods
A custom extension to the Cura slicer software (Ultimaker, Geldermalsen, The Netherlands) was used to design five cylindrical phantoms, each with diameter 25 mm and height 5 mm. Each layer of PORO-LAY in the phantoms was 100 microns thick. The pattern of in-plane material deposition for each phantom was as follows (Fig. 2):- Straight phantom: Parallel lines oriented in the same direction for each layer.
- Crossing phantom: Parallel lines with directions alternating by 90 degrees from layer to layer.
- Bending phantom: Concentric arcs with the same centre, 10 mm away from the phantom's centre, for each layer.
- Kissing phantom: Layers alternating between parallel lines and concentric arcs with a centre 10 mm away from the phantom's centre.
- Fanning phantom: Concentric arcs for each layer, with the centre alternating between two points, both 5 mm from the phantom's centre.
A ground truth map of arc radius was constructed based on the bending phantom schematic and ground truth maps of crossing angle were constructed based on the fanning and kissing phantom schematics. Using triangular holes in the phantoms as fiducials, a rigid registration was performed to align the ground truth maps to the scan data. For each phantom, DIPY5 was used to compute diffusion tensor imaging (DTI)6 and diffusion kurtosis imaging (DKI)7,8 representations, and the Microstructure Diffusion Toolbox9 was used to compute a Bingham-NODDI10 representation (adjusting the assumed diffusivities to be appropriate for pure water at room temperature). A quadratic regression was performed relating each computed metric to the ground truth values for each voxel.
Results
Of the DTI metrics (Fig. 3), radial diffusivity (RD) showed the strongest dependence on arc radius, and this relationship propagated to mean diffusivity (MD) and fractional anisotropy (FA). Both axial diffusivity (AD) and RD showed a dependence on crossing angle, and the changes in AD and RD offset, resulting in no change in MD and a strong dependence of FA on crossing angle.The primary effect of fibre curvature on DKI (Fig. 4) is an increase in radial kurtosis (RK) with increasing arc radius. All three DKI metrics have a relationship with fibre crossing angle: As crossing angle increases, axial kurtosis (AK) increases after 45 degrees, RK decreases, and mean kurtosis (MK) increases to a plateau at about 60 degrees.
Bingham-NODDI's (Fig. 5) primary orientation dispersion index (ODIP) has little relationship with arc radius, so fibre curvature is reflected by changes in compartment volume fractions. The volume fraction metrics vary considerably in the kissing and crossing phantoms, and little of that variance is explained by crossing angle. ODIP has a strong relationship with crossing angle.
Discussion
These 3D printed phantoms provide a ground truth of fibre curvature and dispersion for real scan data, which would be difficult to achieve with any previously reported technique. They were manufactured with widely accessible equipment in ten minutes of print time per phantom ($0.50 / phantom).Comparing model output to the phantoms’ ground truth data demonstrates the particular utility of some model parameters in describing sub-voxel microstructure. Both forms of orientation dispersion modulate all three DKI metrics, making it difficult to differentiate between microstructural and orientational effects on DKI metrics. DTI’s MD and Bingham-NODDI’s intra-neurite volume fraction are both insensitive to the effect of crossing fibres, so these metrics may be robust indicators of microstructural change. The data suggests Bingham-NODDI’s ODIP is a sensitive indicator of orientation dispersion.
Conclusion
These 3D printed phantoms are a novel and useful tool for characterizing diffusion MRI models using real scan data. This study demonstrates the invariance of MD and intra-neurite volume fraction in the presence of orientation dispersion, and the high sensitivity of ODIP to orientation dispersion.Acknowledgements
This work was supported by a BrainsCAN Stimulus Grant from the Canada First Research Excellence Fund, Brain Canada, and Discovery Grants from the Natural Sciences and Engineering Research Council (NSERC).References
- Alexander AL, Hasan KM, Lazar M, Tsuruda JS, Parker DL. Analysis of partial volume effects in diffusion-tensor MRI. Magnetic Resonance in Medicine. 2001;45(5):770-780. doi:10.1002/mrm.1105
- Jeurissen B, Leemans A, Tournier J-D, Jones DK, Sijbers J. Investigating the prevalence of complex fiber configurations in white matter tissue with diffusion magnetic resonance imaging. Human Brain Mapping. 2013;34(11):2747-2766. doi:10.1002/hbm.22099
- Fieremans E, Lee H-H. Physical and numerical phantoms for the validation of brain microstructural MRI: A cookbook. NeuroImage. 2018;182:39-61. doi:10.1016/j.neuroimage.2018.06.046
- Abu-Sardanah SO, Hussain U, Moore J, Baron C, Peters T, Khan AR. Design and evaluation of a diffusion MRI fibre phantom using 3D printing. In: Proc. SPIE 10573. International Society for Optics; Photonics; 2018. doi:10.1117/12.2293566
- Garyfallidis E, Brett M, Amirbekian B, et al. Dipy, a library for the analysis of diffusion MRI data. Front Neuroinform. 2014;8. doi:10.3389/fninf.2014.00008
- Basser PJ, Mattiello J, LeBihan D. MR diffusion tensor spectroscopy and imaging. Biophysical Journal. 1994;66(1):259-267. doi:10.1016/S0006-3495(94)80775-1
- Jensen JH, Helpern JA, Ramani A, Lu H, Kaczynski K. Diffusional kurtosis imaging: The quantification of non-gaussian water diffusion by means of magnetic resonance imaging. Magnetic Resonance in Medicine. 2005;53(6):1432-1440. doi:10.1002/mrm.20508
- Lu H, Jensen JH, Ramani A, Helpern JA. Three-dimensional characterization of non-gaussian water diffusion in humans using diffusion kurtosis imaging. NMR in Biomedicine. 2006;19(2):236-247. doi:10.1002/nbm.1020
- Harms RL, Fritz FJ, Tobisch A, Goebel R, Roebroeck A. Robust and fast nonlinear optimization of diffusion MRI microstructure models. NeuroImage. 2017;155:82-96. doi:10.1016/j.neuroimage.2017.04.064
- Tariq M, Schneider T, Alexander DC, Gandini Wheeler-Kingshott CA, Zhang H. Bingham–NODDI: Mapping anisotropic orientation dispersion of neurites using diffusion MRI. NeuroImage. 2016;133:207-223. doi:10.1016/j.neuroimage.2016.01.046
Figures

Figure 1: An illustration of PORO-LAY's composition. a: Long fibres of PVA embedded in the elastomeric matrix dissolve when immersed in water, leaving behind fibrous pores that restrict diffusion. b: 3D printed phantoms are composed of beads of PORO-LAY deposed in layers (cross-sections shown). c: Fluorescence microscopy image of the cross-section of a 3D printed PORO-LAY sample, where red material is the elastomeric matrix. Beads of material are outlined in white.
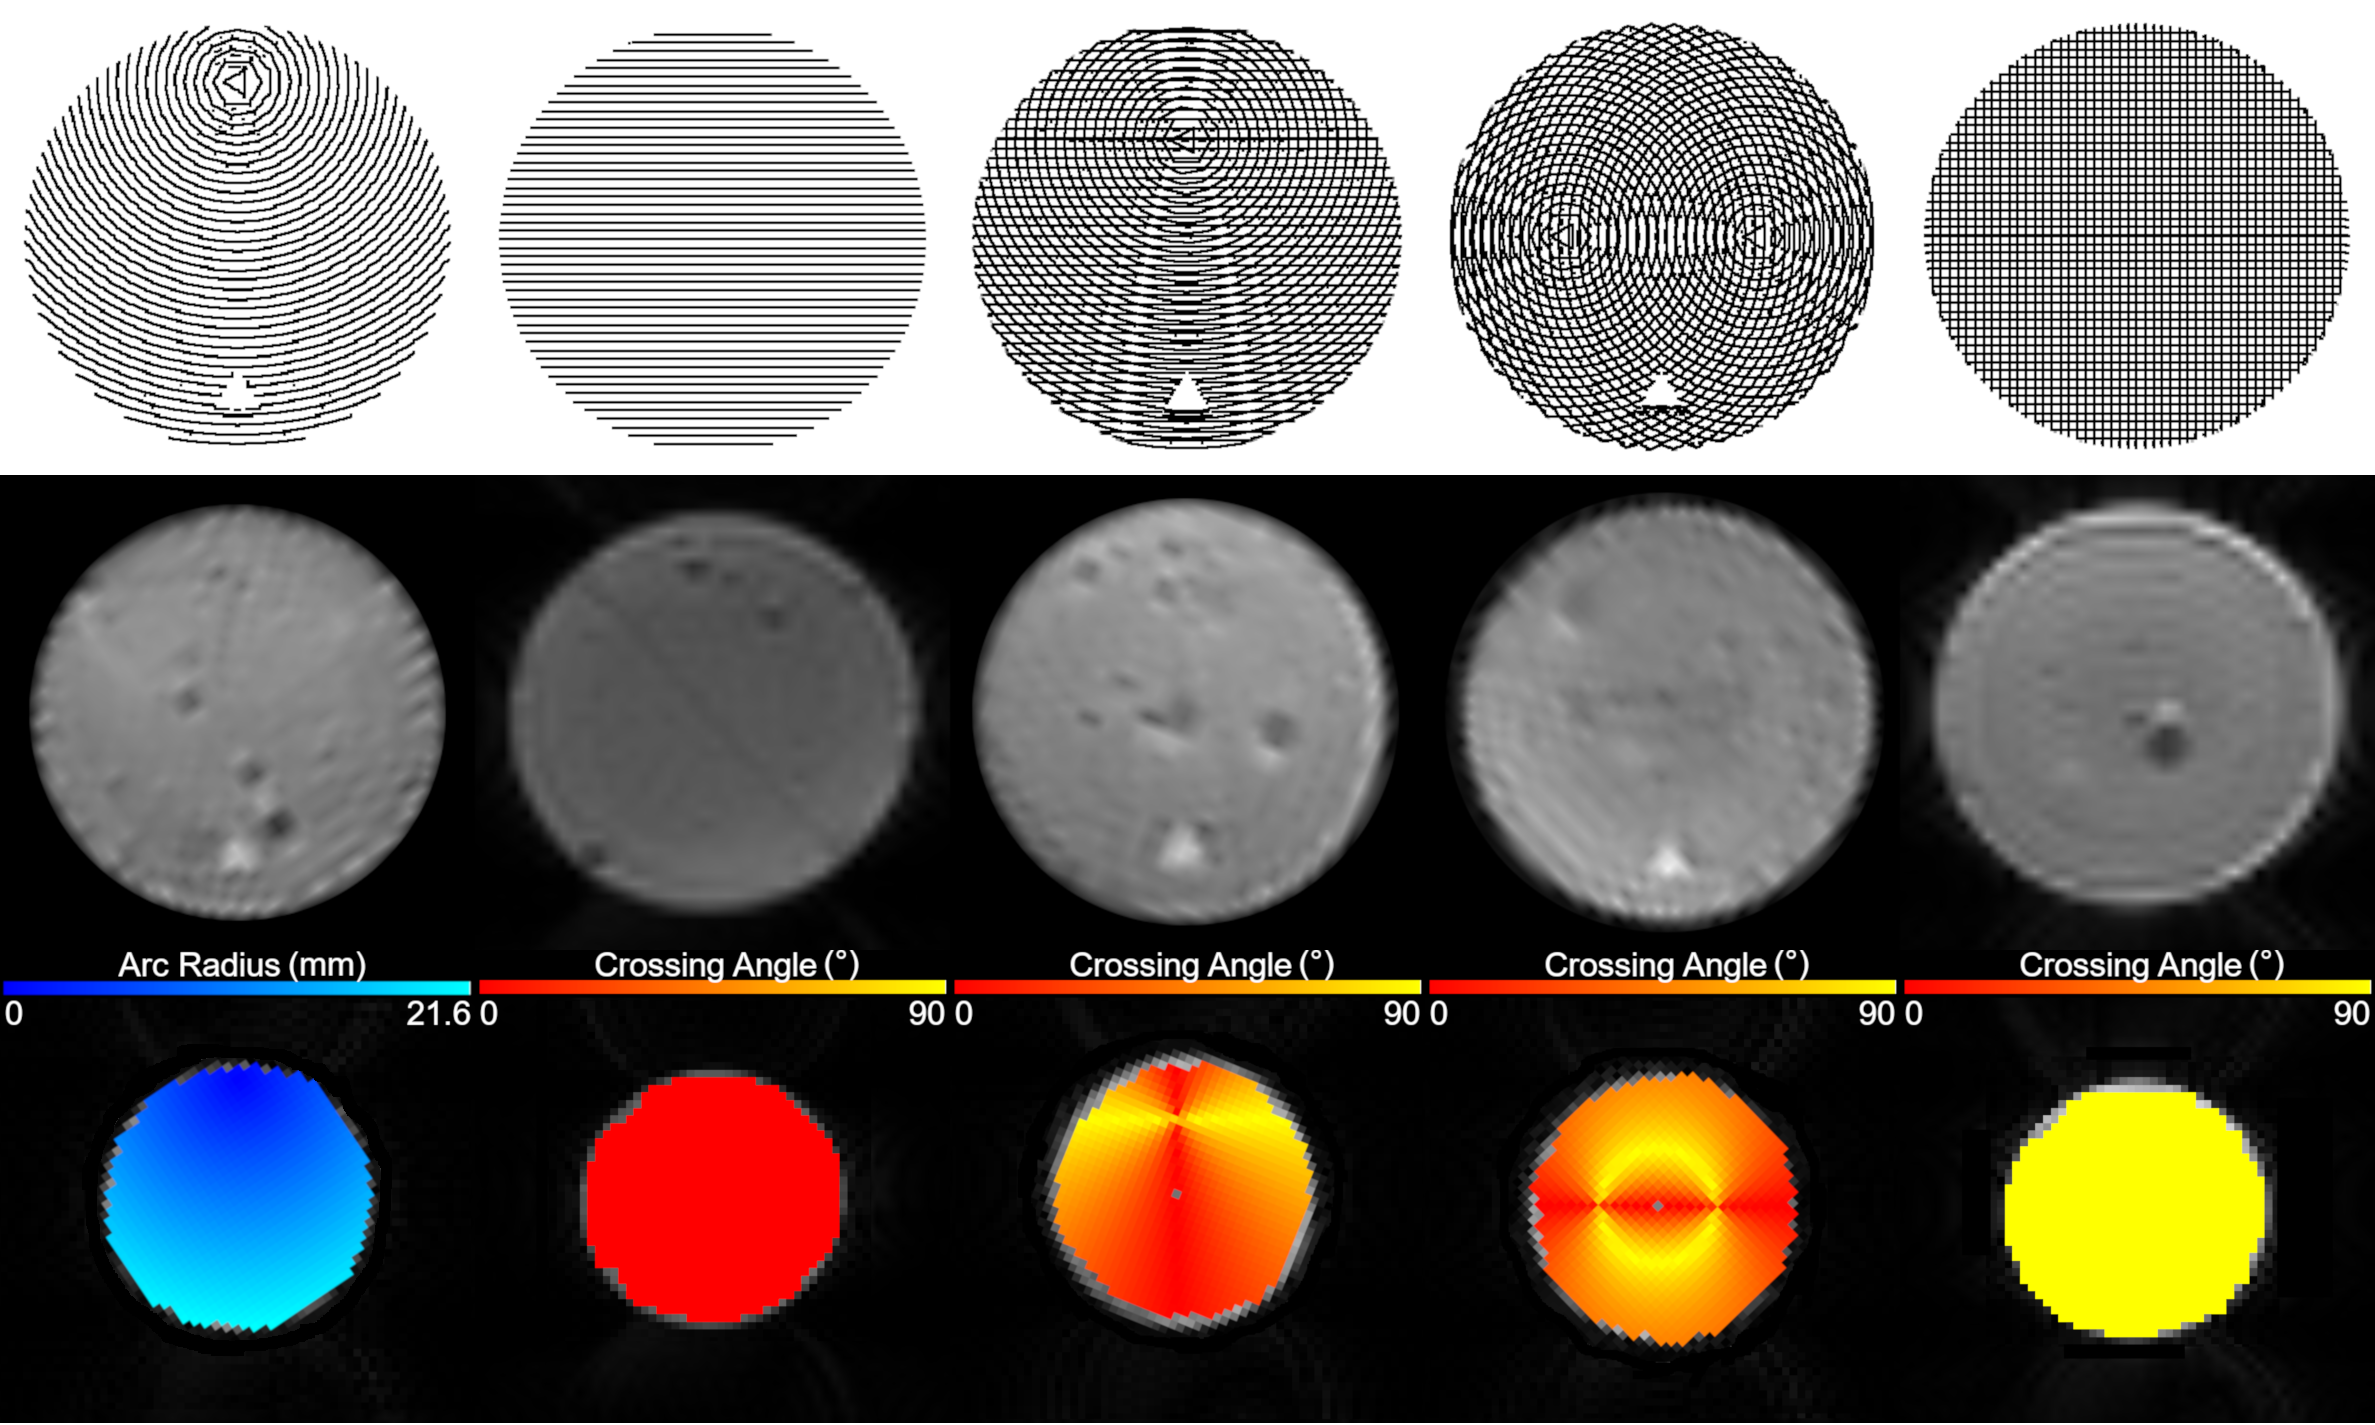
Figure 2: Three stages of the experimental process. From left to right, the columns depict the bending, straight, kissing, fanning, and crossing phantoms. The top row shows the schematic of each phantom, the middle row shows b=0 images of each phantom, and the bottom row shows a ground truth (arc radius for the bending phantom, crossing angle for the others) image overlaid on the b=0 image for each phantom.
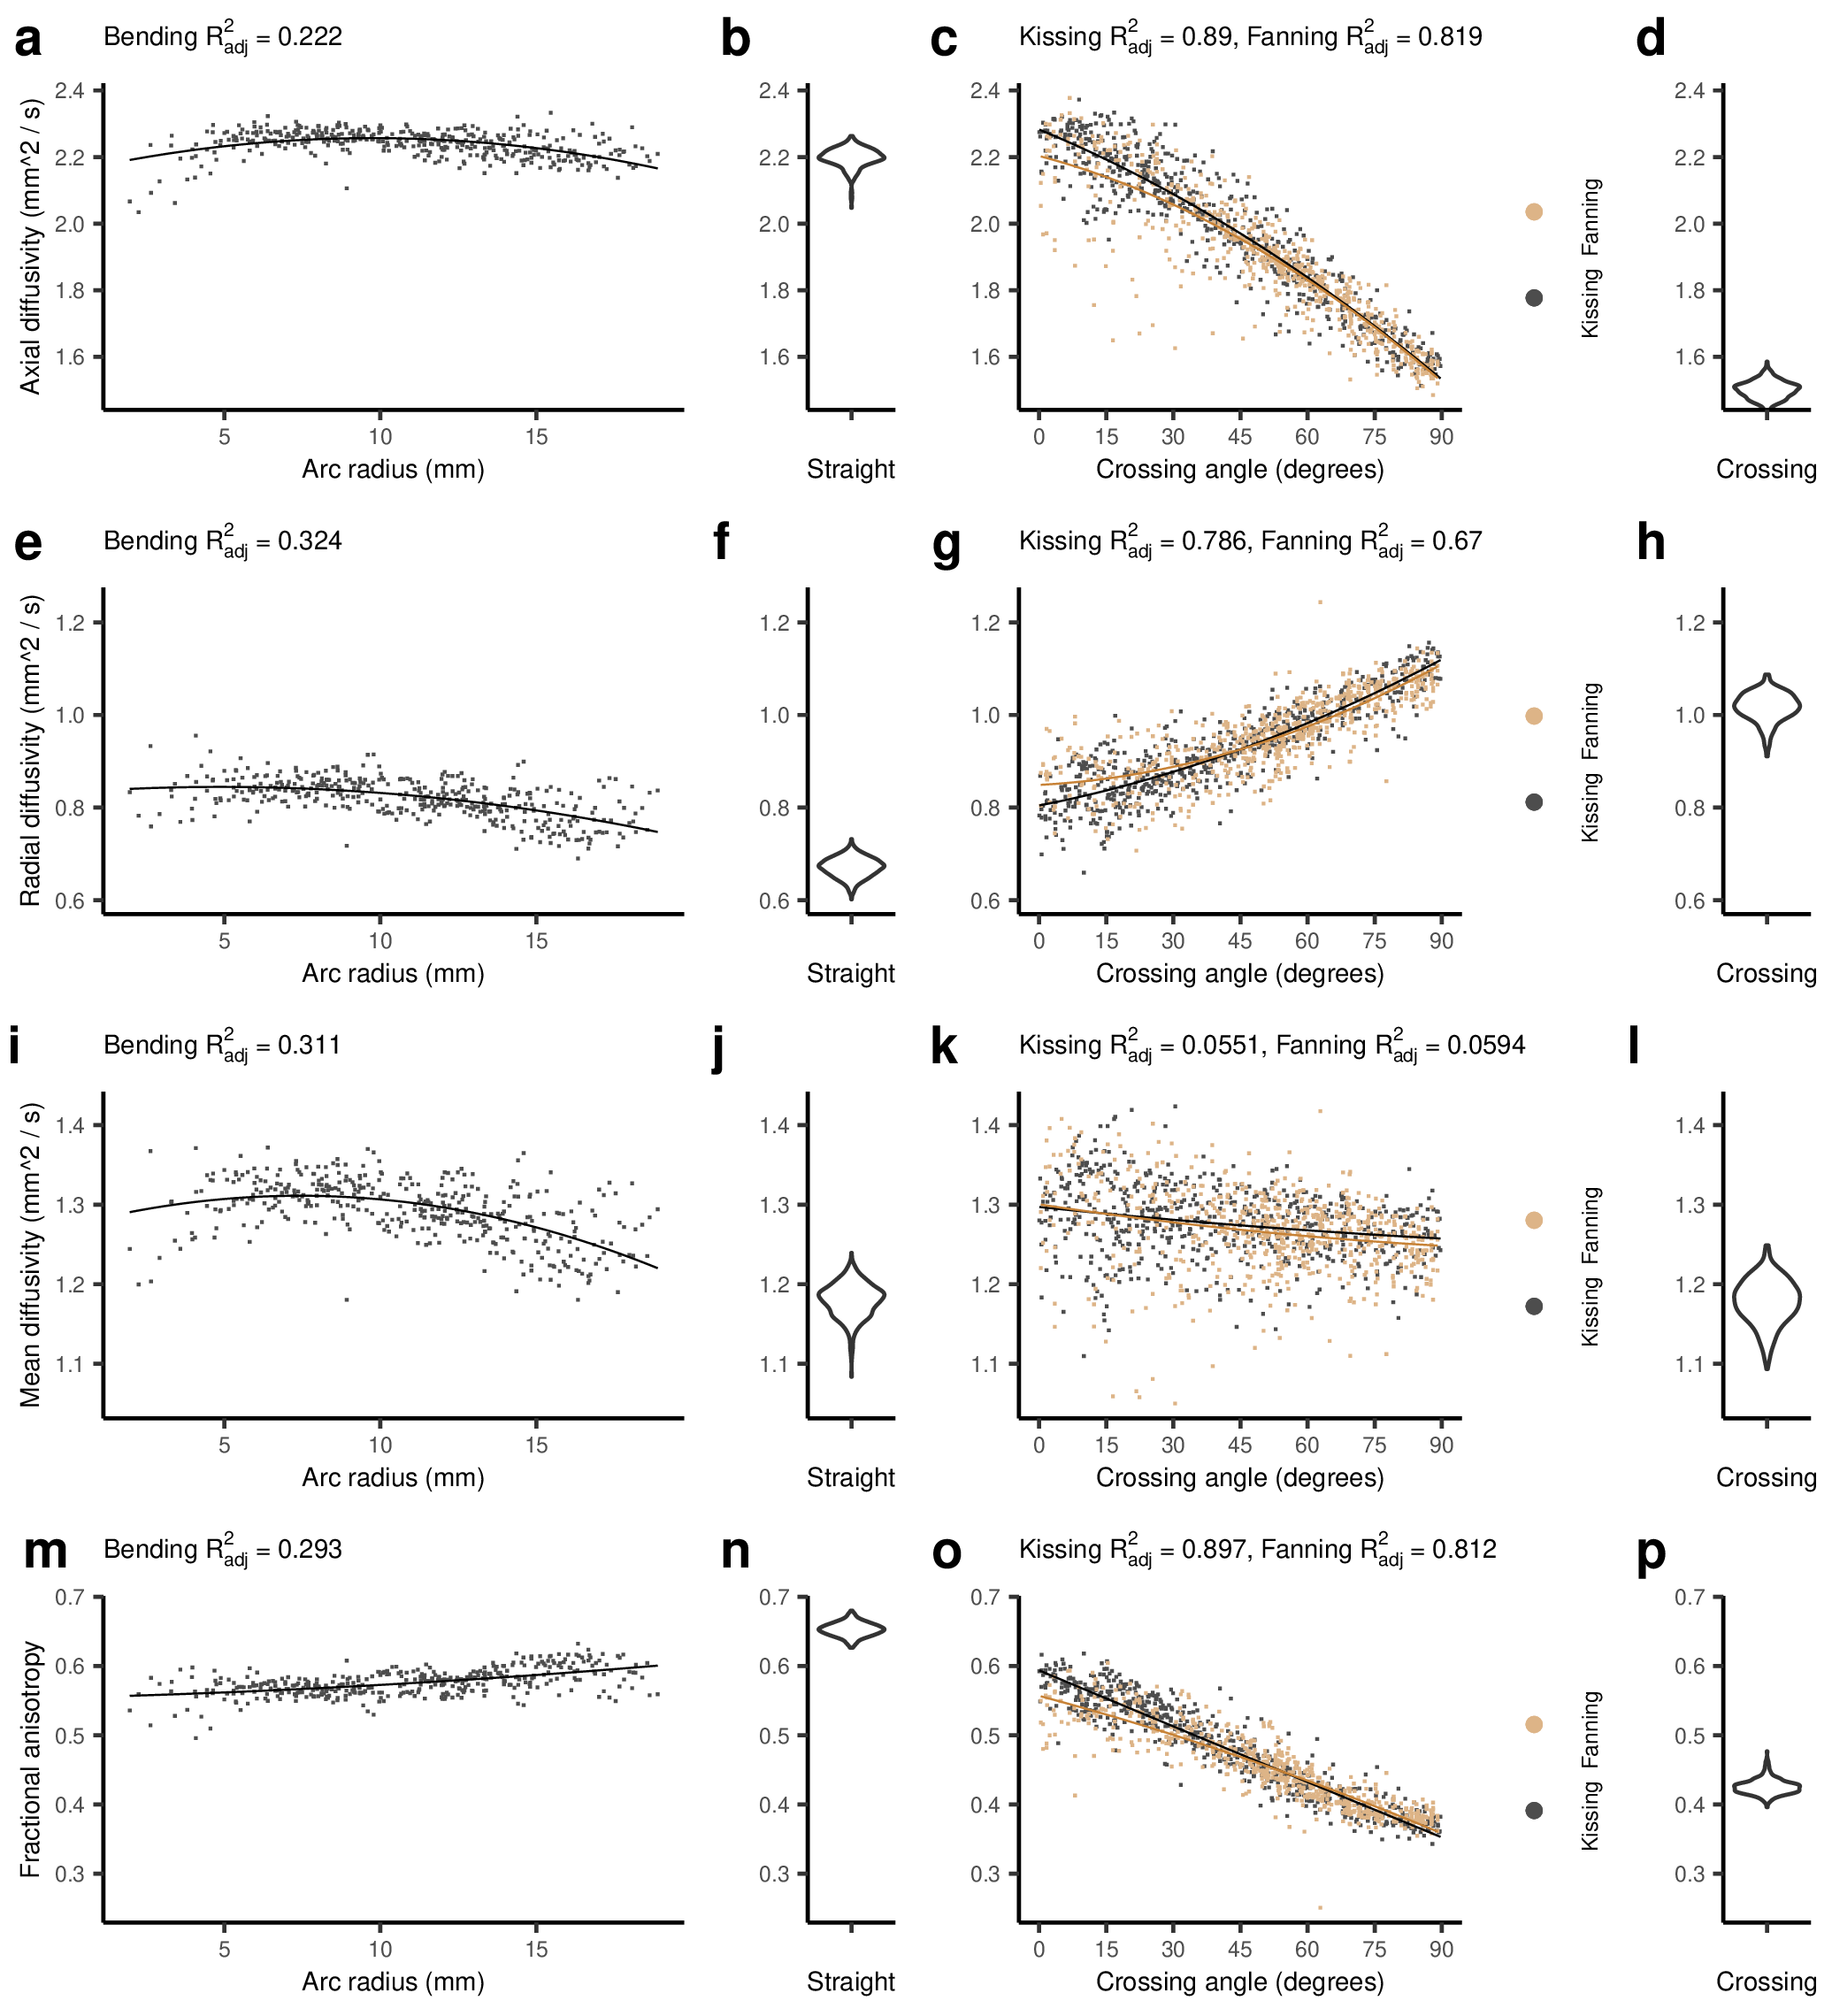
Figure 3: DTI metrics in the five phantoms. From left to right, the columns show: the metric vs. arc radius in the bending phantom, a violin plot of the metric in the straight phantom, the metric vs. crossing angle in the kissing and fanning phantoms, and a violin plot of the metric in the crossing phantom. Scatter plots show the quadratic line of best fit. Each point represents a single voxel measurement. a-d: Axial diffusivity. e-h: Radial diffusivity. i-l: Mean diffusivity. m-p: Fractional anisotropy.
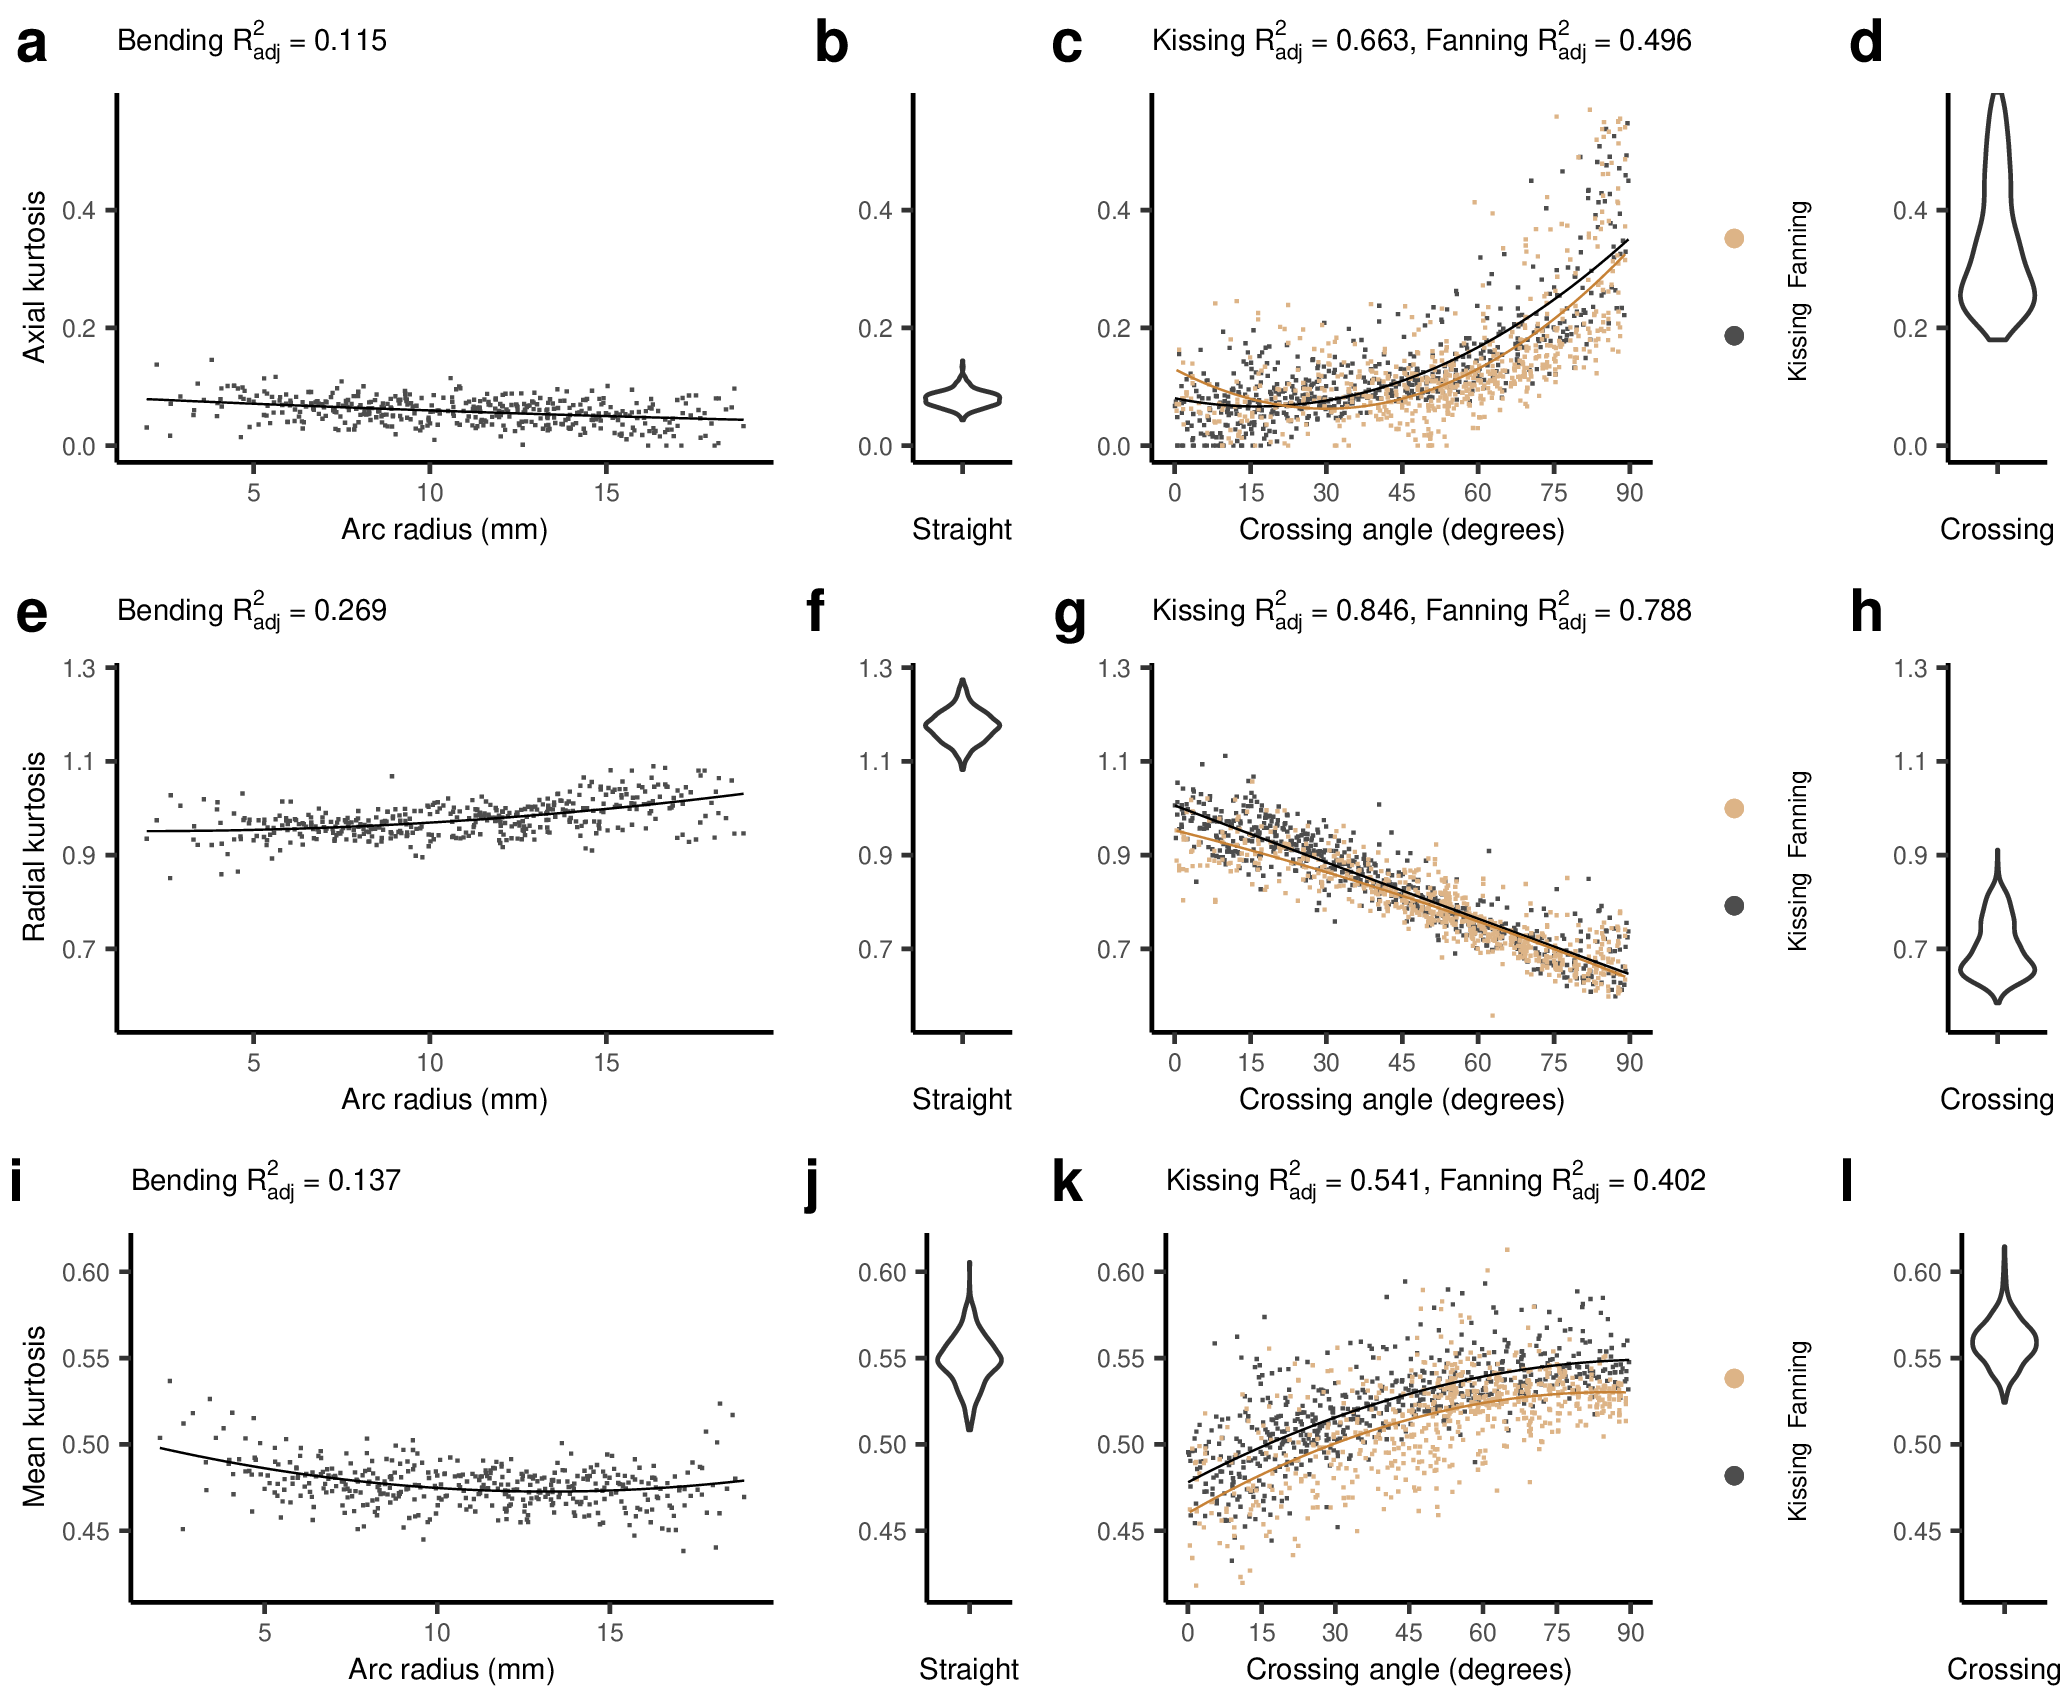
Figure 4: DKI metrics in the five phantoms. From left to right, the columns show: the metric vs. arc radius in the bending phantom, a violin plot of the metric in the straight phantom, the metric vs. crossing angle in the kissing and fanning phantoms, and a violin plot of the metric in the crossing phantom. Scatter plots include the quadratic line of best fit. Each point represents a single voxel measurement. a-d: Axial kurtosis. e-h: Radial kurtosis. i-l: Mean kurtosis.
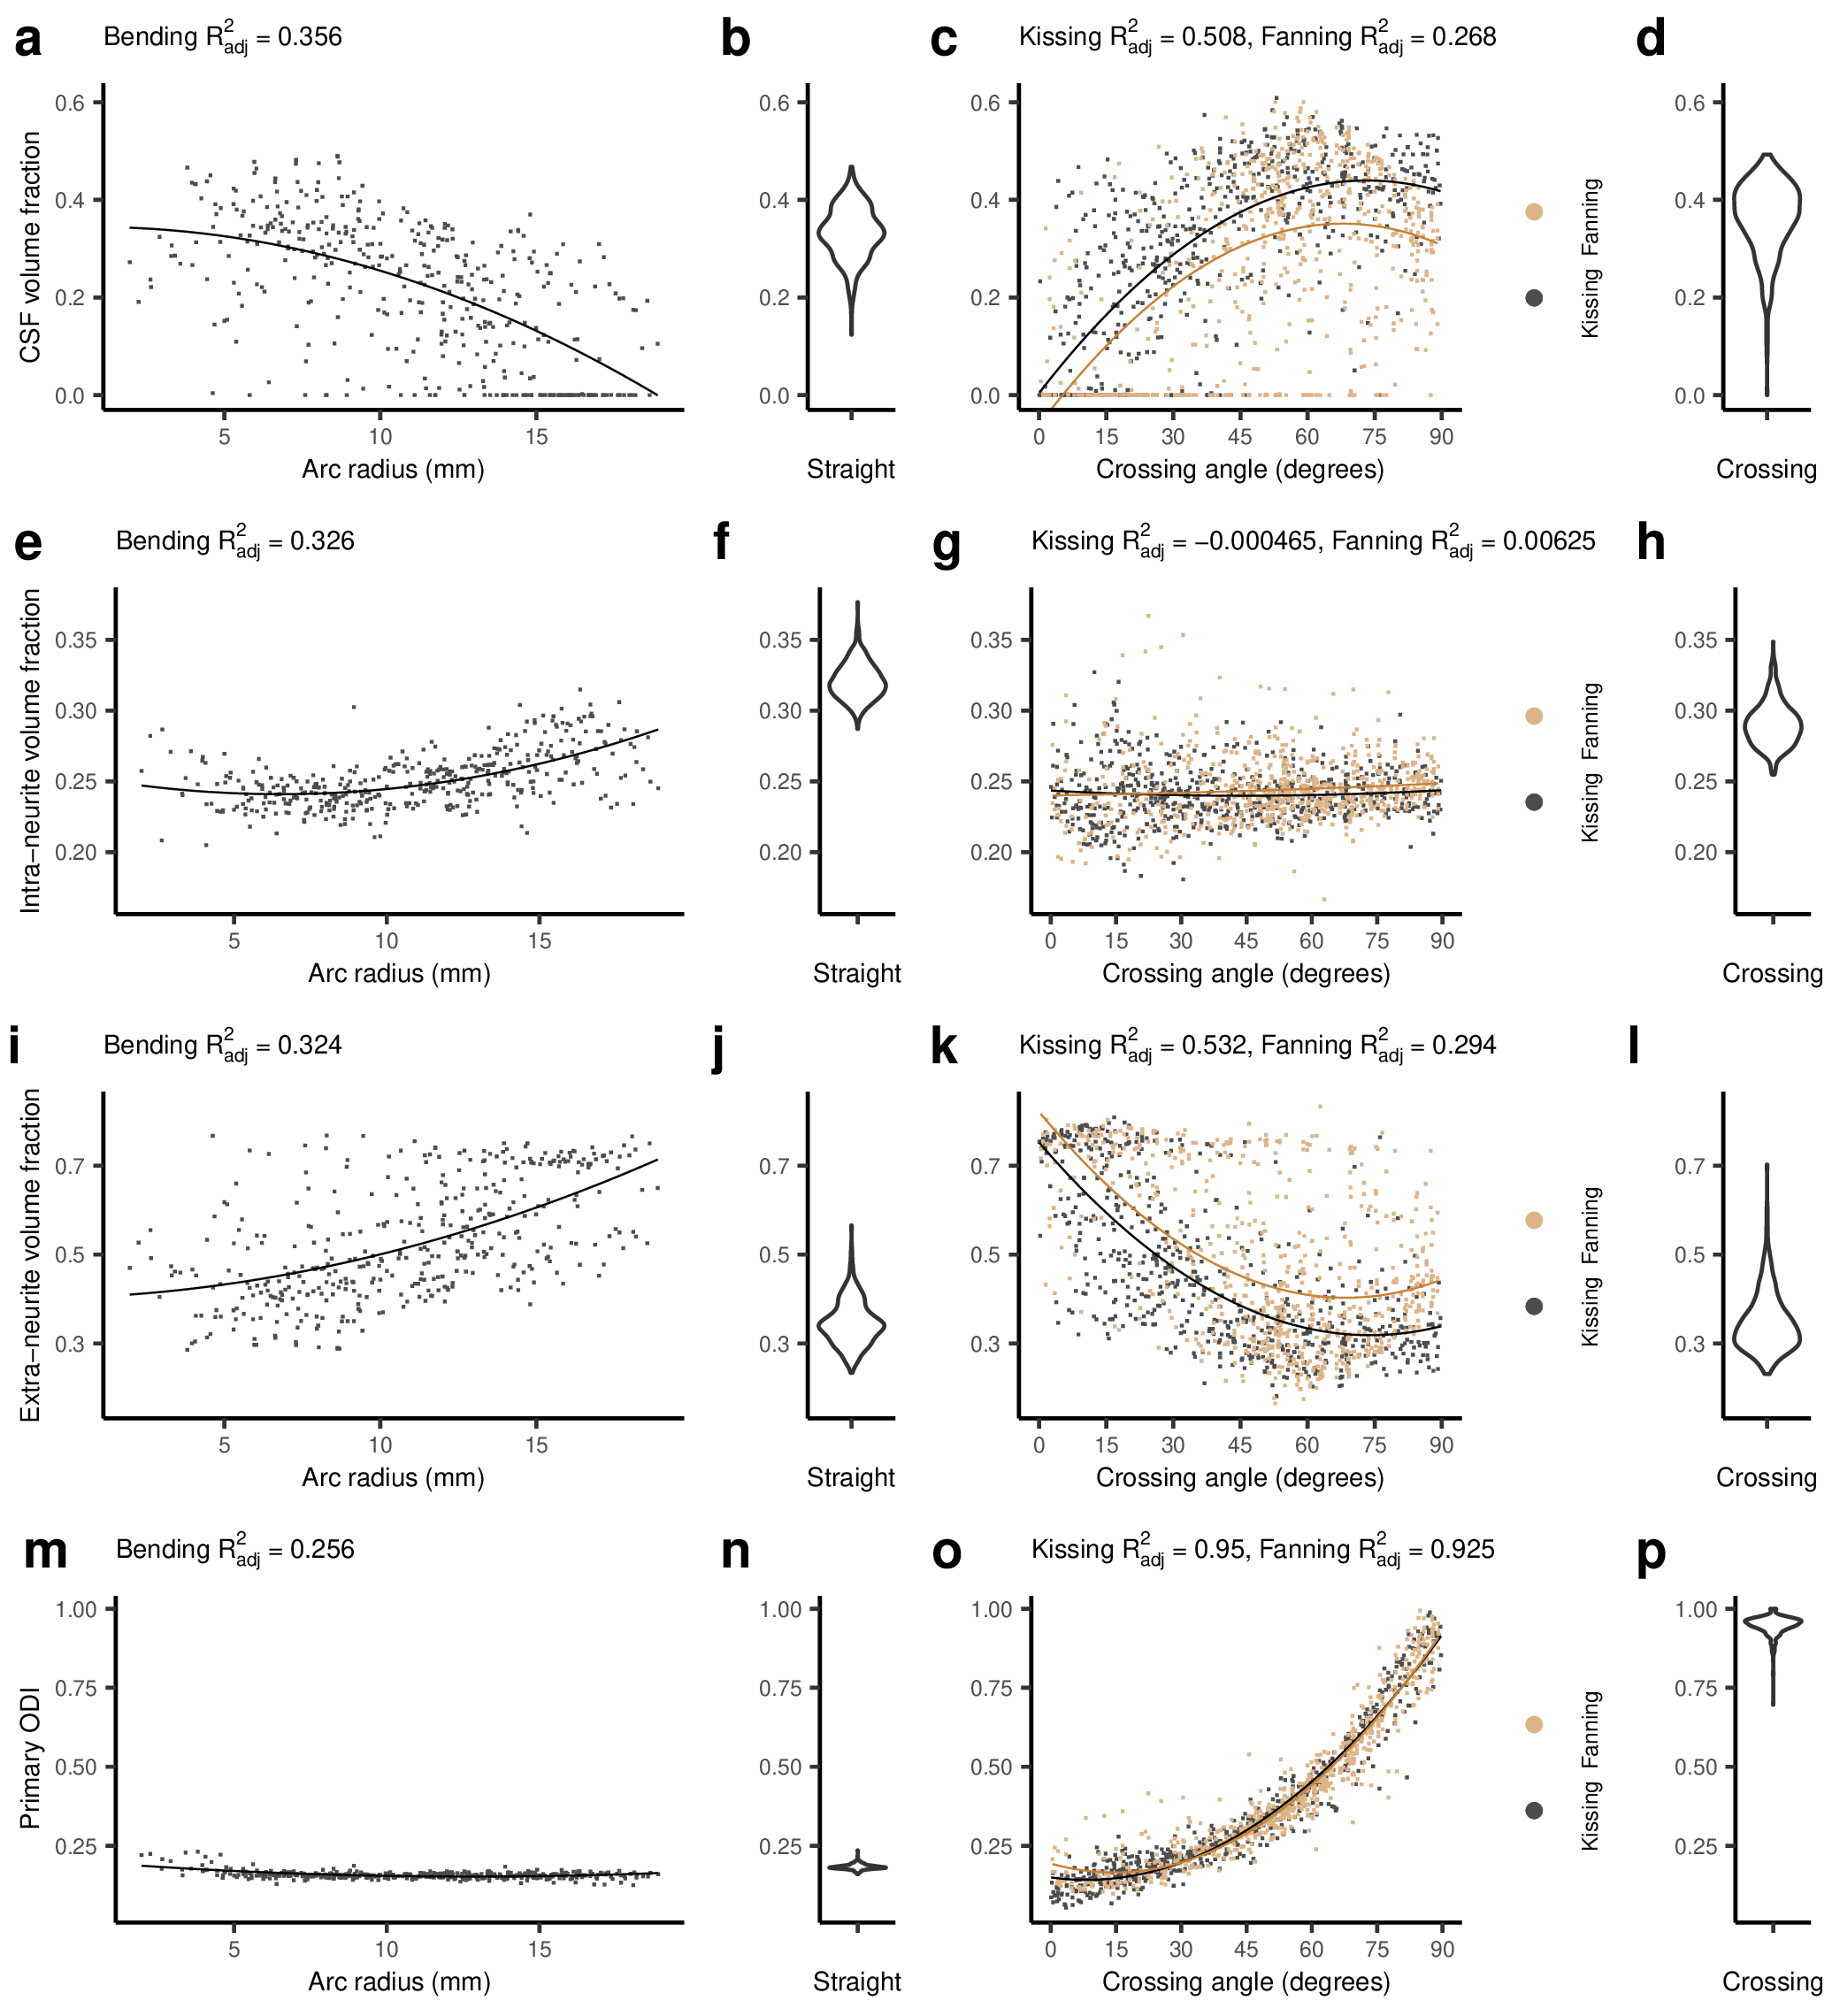
Figure 5: Bingham-NODDI metrics in each phantom. From left to right, the columns show: metric vs. arc radius in the bending phantom, a violin plot of the metric in the straight phantom, metric vs. crossing angle in the kissing and fanning phantoms, and a violin plot of the metric in the crossing phantom. Scatter plots show a quadratic line of best fit. Each point represents one voxel measurement. a-d: CSF volume fraction. e-h: Intra-neurite volume fraction. i-l: Extra-neurite volume fraction. m-p: ODIP.