4498
Phantom validation of diffusion weighted T2- and T2*-relaxometry EPI sequences1Center for Biomedical Imaging, Dept. of Radiology, NYU School of Medicine, New York, NY, United States, 2Center for Advanced Imaging Innovation and Research (CAI2R), NYU School of Medicine, New York, NY, United States, 3Siemens Medical Solutions, New York, NY, United States, 4Dept. of Psychiatry, NYU School of Medicine, New York, NY, United States, 5Clinical Research Division, Nathan Kline Institute for Psychiatric Research, Orangeburg, NY, United States
Synopsis
Combination of diffusion weighted MRI with orthogonal measures such as T2- or T2*-weighting has been proposed to overcome the fit degeneracy found in microstructure modeling of diffusion signals. However, the repetition of diffusion measurements at different TE leads to unacceptably long acquisition times, hindering clinical applicability of this approach. Here, we propose accelerated acquisitions using diffusion weighted multi-spin and multi-gradient echo trains which sample the signal at several TEs after a standard diffusion encoding spin echo. In the current configurations these sequences speed up the acquisitions by 2.6x or 3.6x respectively. We validate these approaches on a phantom.
Purpose
Microstructural modeling of diffusion weighted MRI aims to quantify mesoscopic white matter integrity features [1-4] which might serve as sensitive and specific biomarkers of changes associated with brain development, aging and pathology. To overcome the fit degeneracy found in multi-compartment microstructure modeling [5], novel approaches propose combining diffusion weighted MRI with orthogonal measures such as T$$$_2$$$ or T$$$_2^*$$$–weighting [6-13]. The repetition of diffusion measurements at different echo times (TE) however leads to unacceptably long acquisition times, hindering clinical and research applicability of this approach. This can be mitigated by acquiring multiple spin or gradient echoes in one train after the diffusion weighting.We present accelerated T$$$_2$$$- and T$$$_2^*$$$–diffusion-relaxometry acquisitions leveraging multi-spin and multi-gradient echo readout trains. For each diffusion weighting we acquire multiple full 2D EPI $$$k$$$-spaces for each of several TE (Fig 1). This translates to a 2.6x and a 3.6x reduction in scan time for T$$$_2$$$- and T$$$_2^*$$$–diffusion-relaxometry respectively. In this work we demonstrate the feasibility of these accelerated multi-spin and multi-gradient echo sequences and validate the microstructural parameters of a single T$$$_2$$$- or T$$$_2^*$$$ compartment in a phantom on a clinical 3T scanner.
Methods
Sequence: In the proposed custom-made multi echo EPI diffusion sequences (Fig 1), an initial 90°-180° monopolar diffusion encoding spin-echo block is followed by a multi-spin (MSE, Fig. 1 top) or multi-gradient (MGE, Fig. 1 bottom) echo readout train. All echoes in one train, i.e. the initial spin echo and the subsequent echoes in the MSE and MGE train, are acquired at their distinct TEs with identical EPI readouts and similar diffusion weighting. In the MSE sequence, unwanted ghost echoes are avoided by adding non-repeating crushers on all three gradient axes before and after the 180° pulses. Also for the MSE, a correction is applied for the signal reduction due to 180°-pulse flip angle imperfections. The latter non-negligible signal reduction is corrected by isolating the impact of each 180° RF pulse from the non-diffusion-weighted $$$b_0$$$-image of the acquisition and a set of separately acquired $$$b_0$$$-correction images with carefully chosen echo time combinations. A five-echo train was previously used to improve EPI distortions and SNR by increasing parallel undersampling and observing the weighted sum of the echoes rather than a single echo [14]; a two-echo MSE train was previously demonstrated for diffusion-relaxometry [15].Phantom: A cylindrical phantom, similar to the one used in Cloos et al. [16], was used. This phantom contains seven test tubes, each filled with distilled water doped with different concentrations of manganese (II) chloride tetrahydrate (Cl2Mn4H2O, Sigma-Aldrich, St Louis, MO, USA) to create distinct T$$$_2$$$-values. The liquid used to fill the space in the container is a mixture of distilled water and sodium chloride (110mmol/L). The reference T$$$_2$$$- and T$$$_2^*$$$-values of the test tubes were determined using an MR Fingerprinting approach (MRF, [17]) and a GRE sequence respectively.
Data: Diffusion-relaxometry datasets were collected in a single scan session using a spin echo (SE-EPI), a MSE-EPI, and a MGE-EPI diffusion sequence (Fig 1) (125 directions spread over 4 $$$b$$$-shells, $$$b_{max}\,=\,800\,\mathrm{s/mm^2}$$$ and TE$$$\,=\,71, 107, 143, 179\,\mathrm{ms}$$$ (SE/MSE) or $$$71, 94, 117, 140\,\mathrm{ms}$$$ (MGE)) in a single scan session (SE-EPI: 24:12$$$\,\mathrm{min}$$$, MSE-EPI: 9:04$$$\,\mathrm{min}$$$, MGE-EPI: 6:36$$$\,\mathrm{min}$$$). Other sequence parameters were kept constant: MAGNETOM Prisma, Siemens, Erlangen; 20-channel head coil; TR$$$\,=\,2500-3300\,\mathrm{ms}$$$, 2.5$$$\,\mathrm{mm}$$$ isotropic resolution, FoV$$$\,=\,210\,\mathrm{mm}$$$, 30 slices, multiband acceleration of 2, GRAPPA 2, PF 6/8. $$$b$$$-matrix calculation includes all diffusion, crusher and imaging gradients. Images were denoised [18], intensity corrected (N4) and corrected for susceptibility, eddy currents and subject motion using FSL $$$\mathrm{eddy}$$$ [19]. A single T$$$_2$$$/T$$$_2^*$$$-DTI-compartment was fitted to the data using an unconstrained linear least square estimator in Matlab (Mathworks).
Results and Discussion
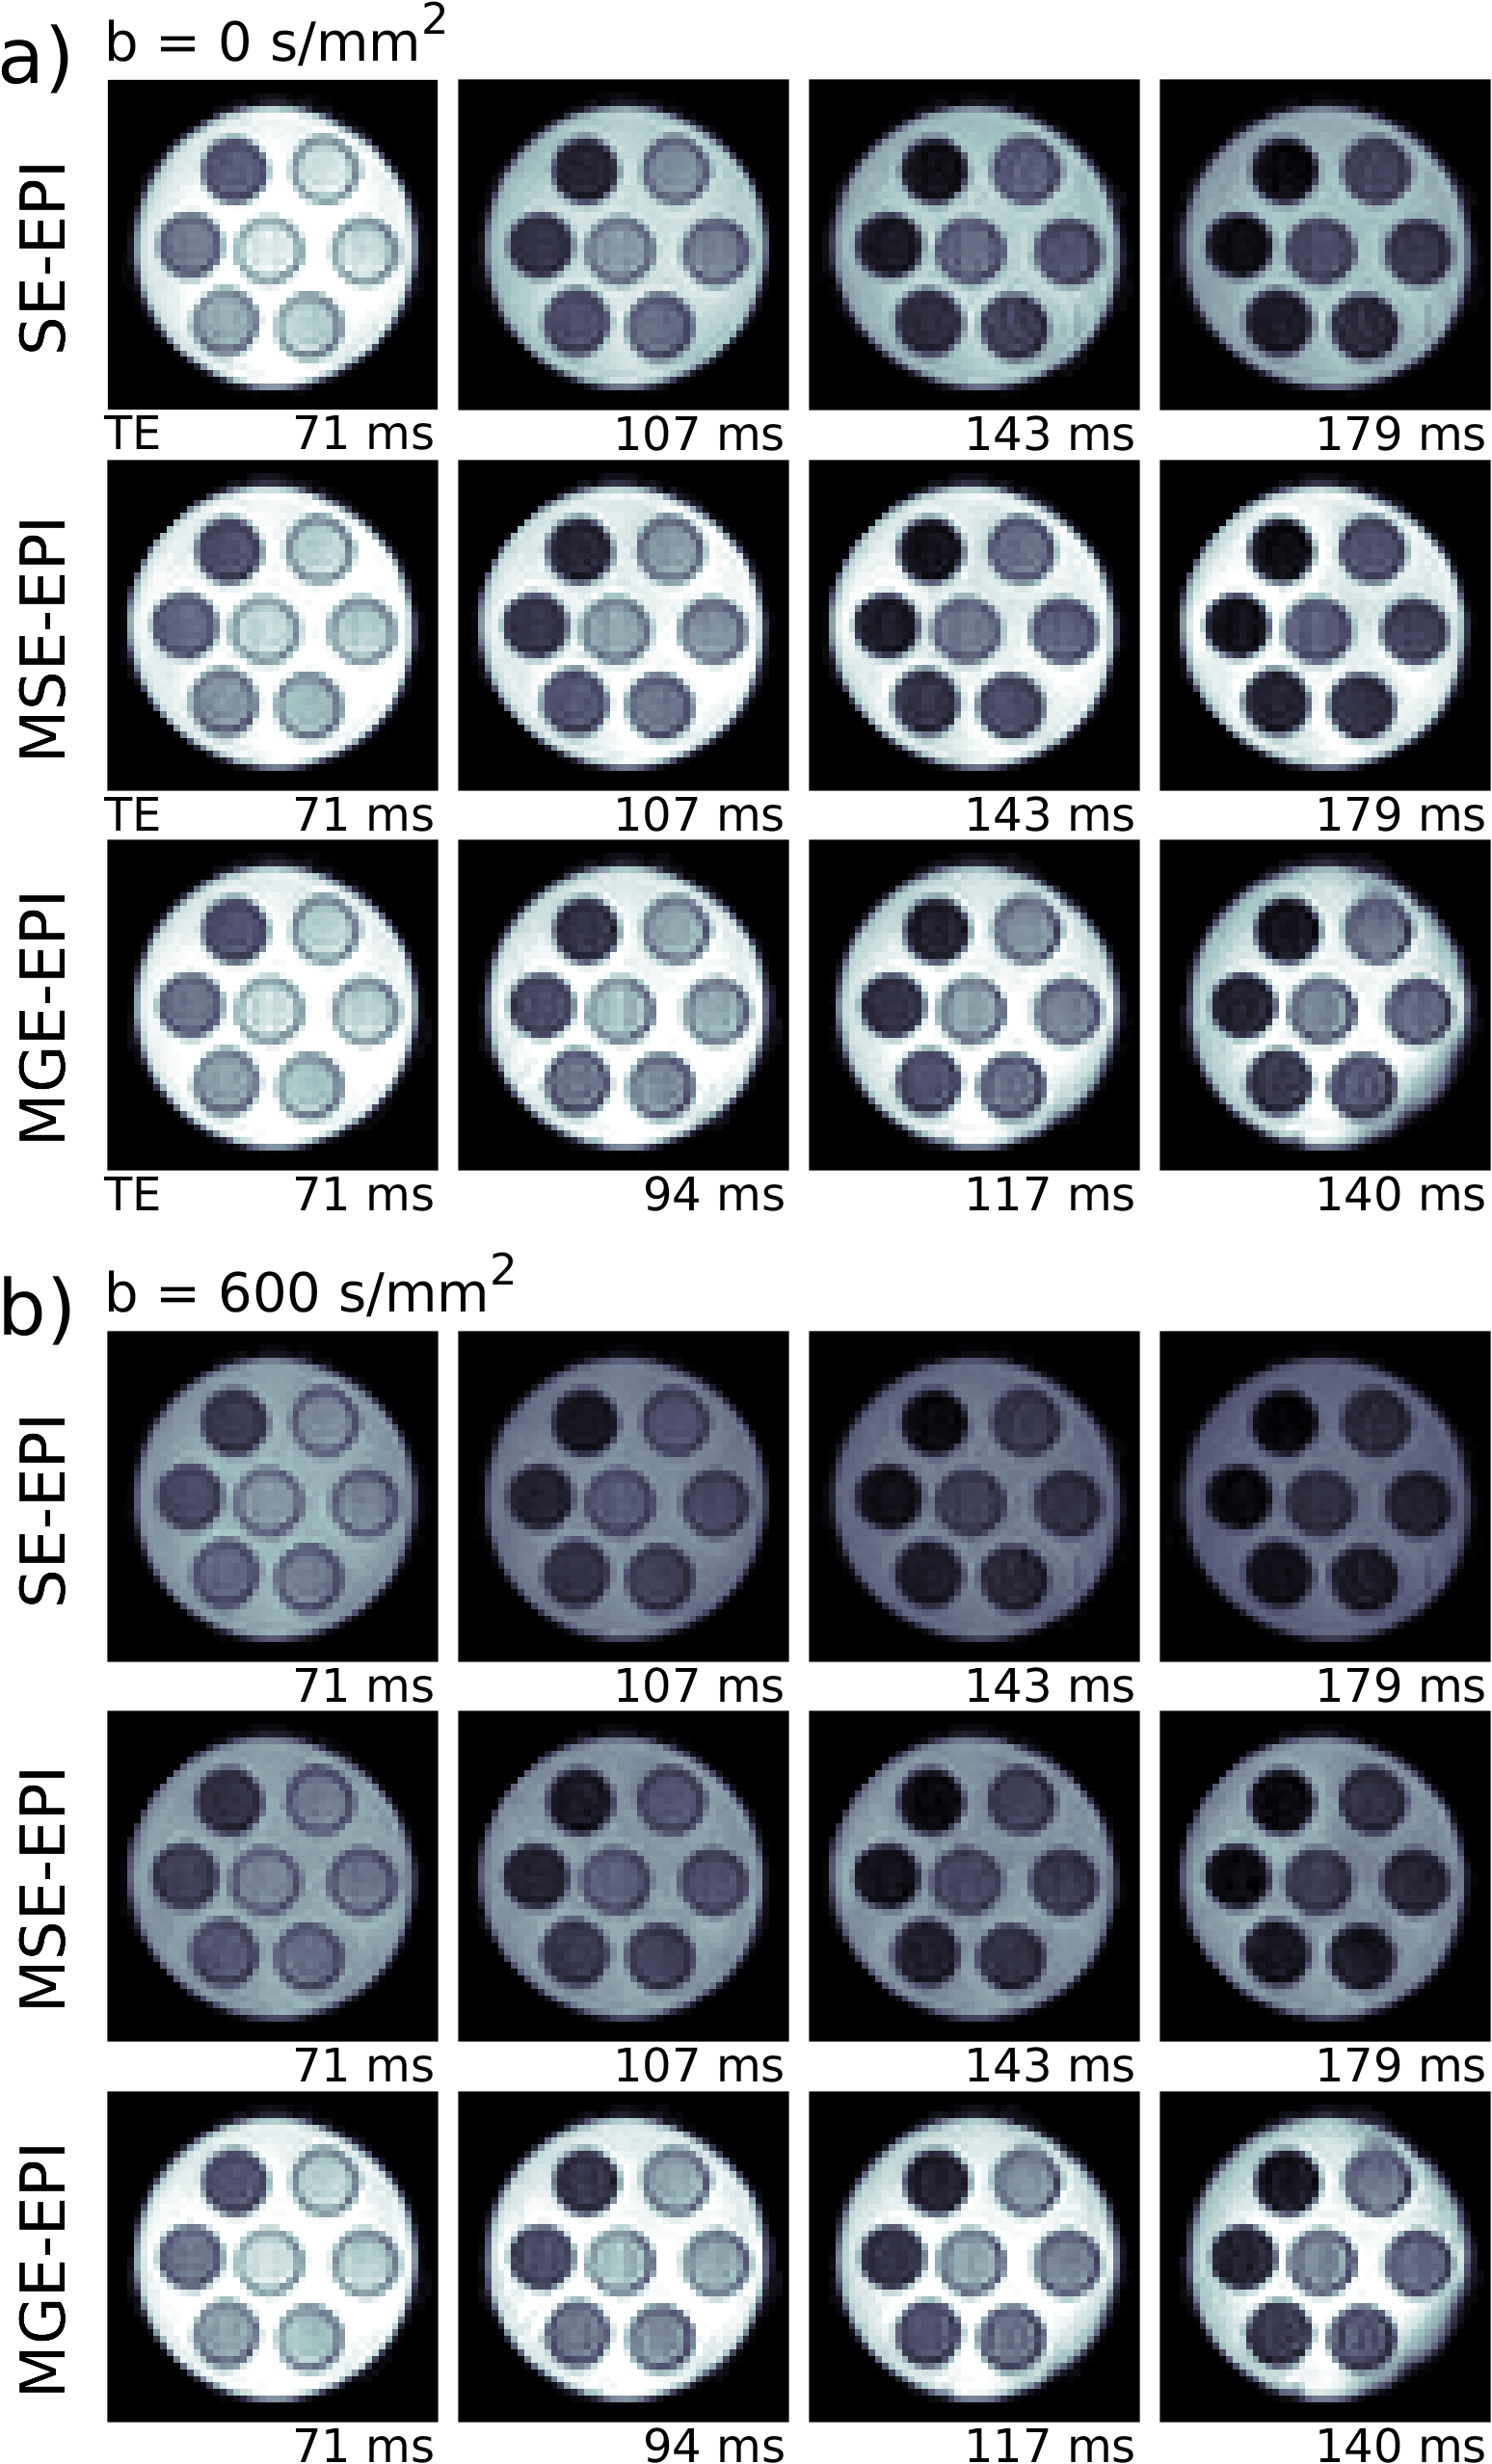
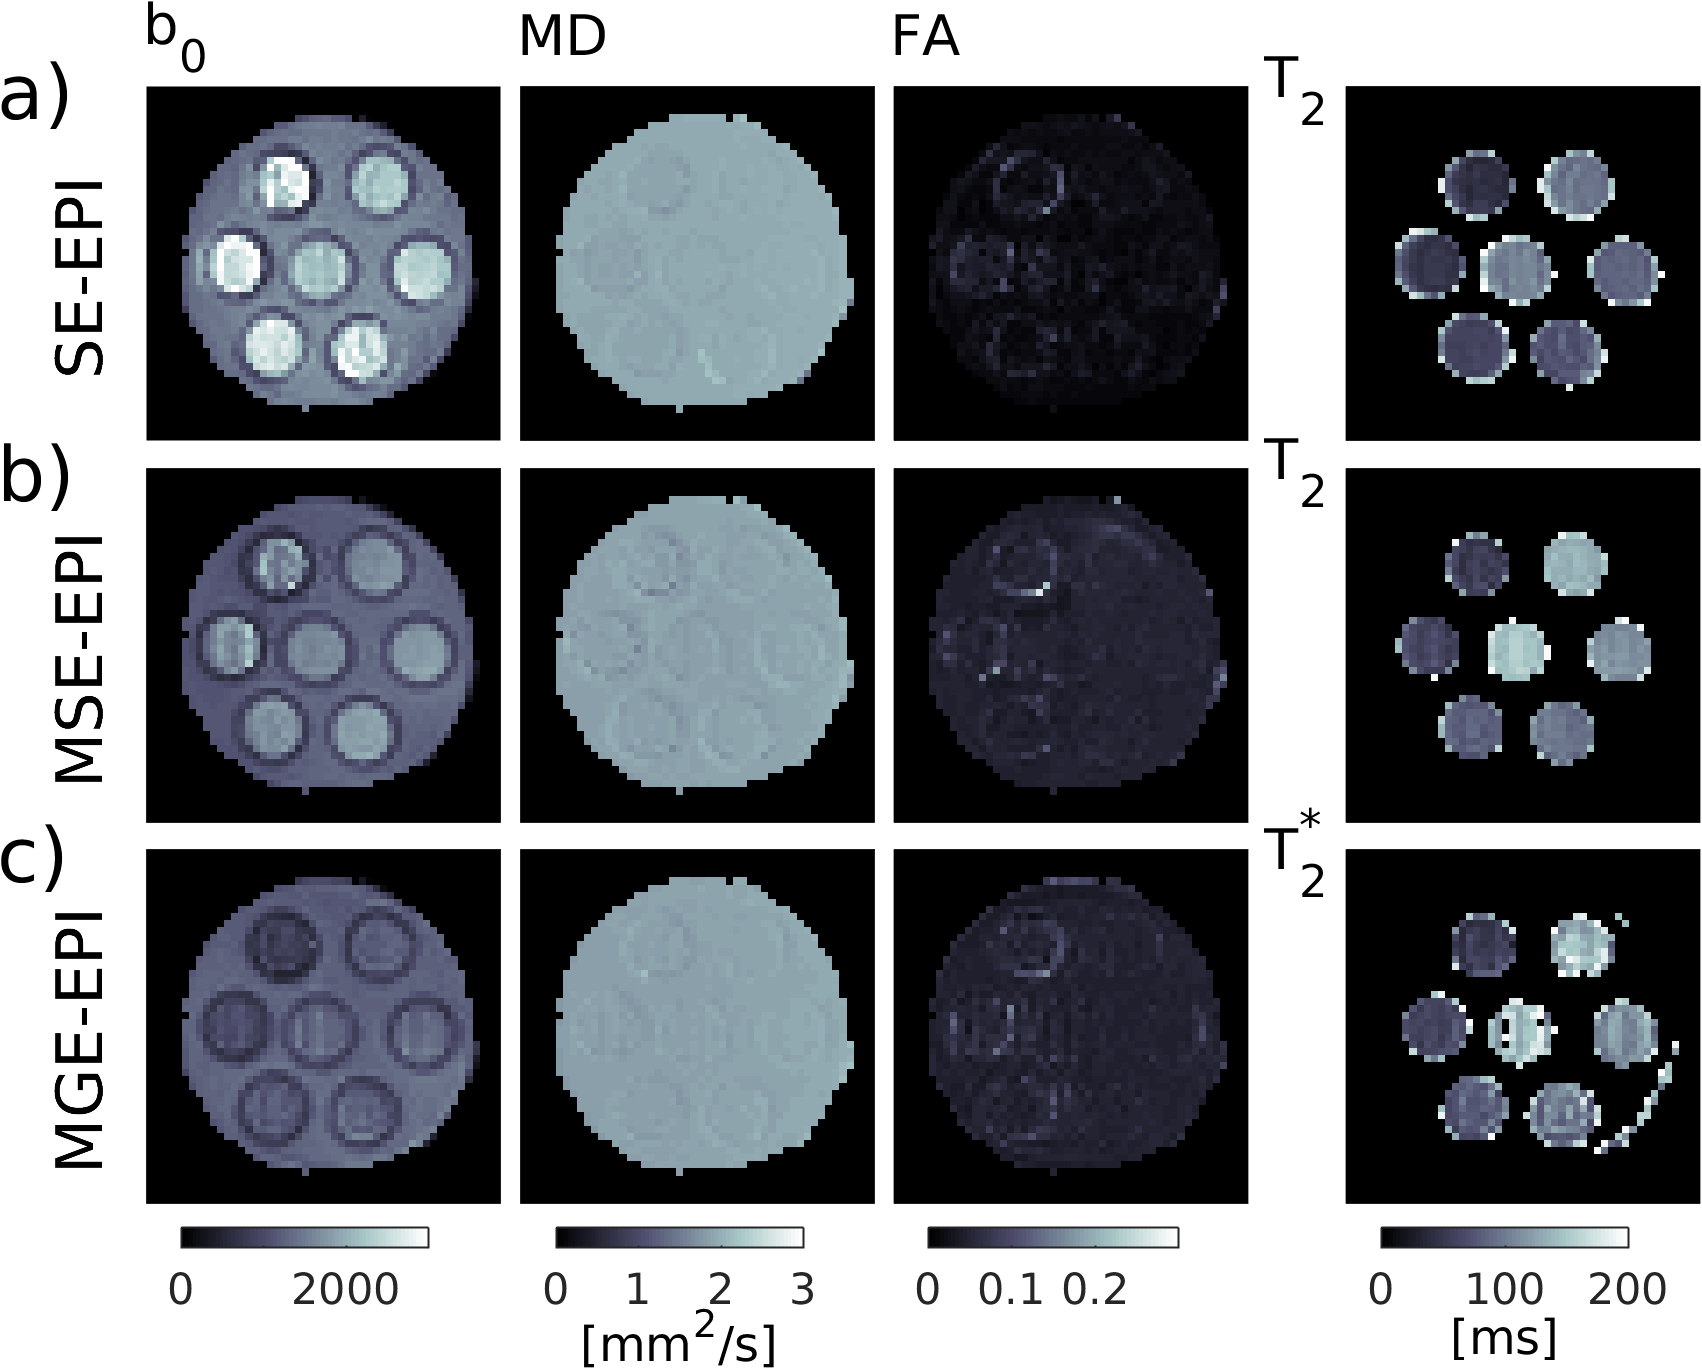
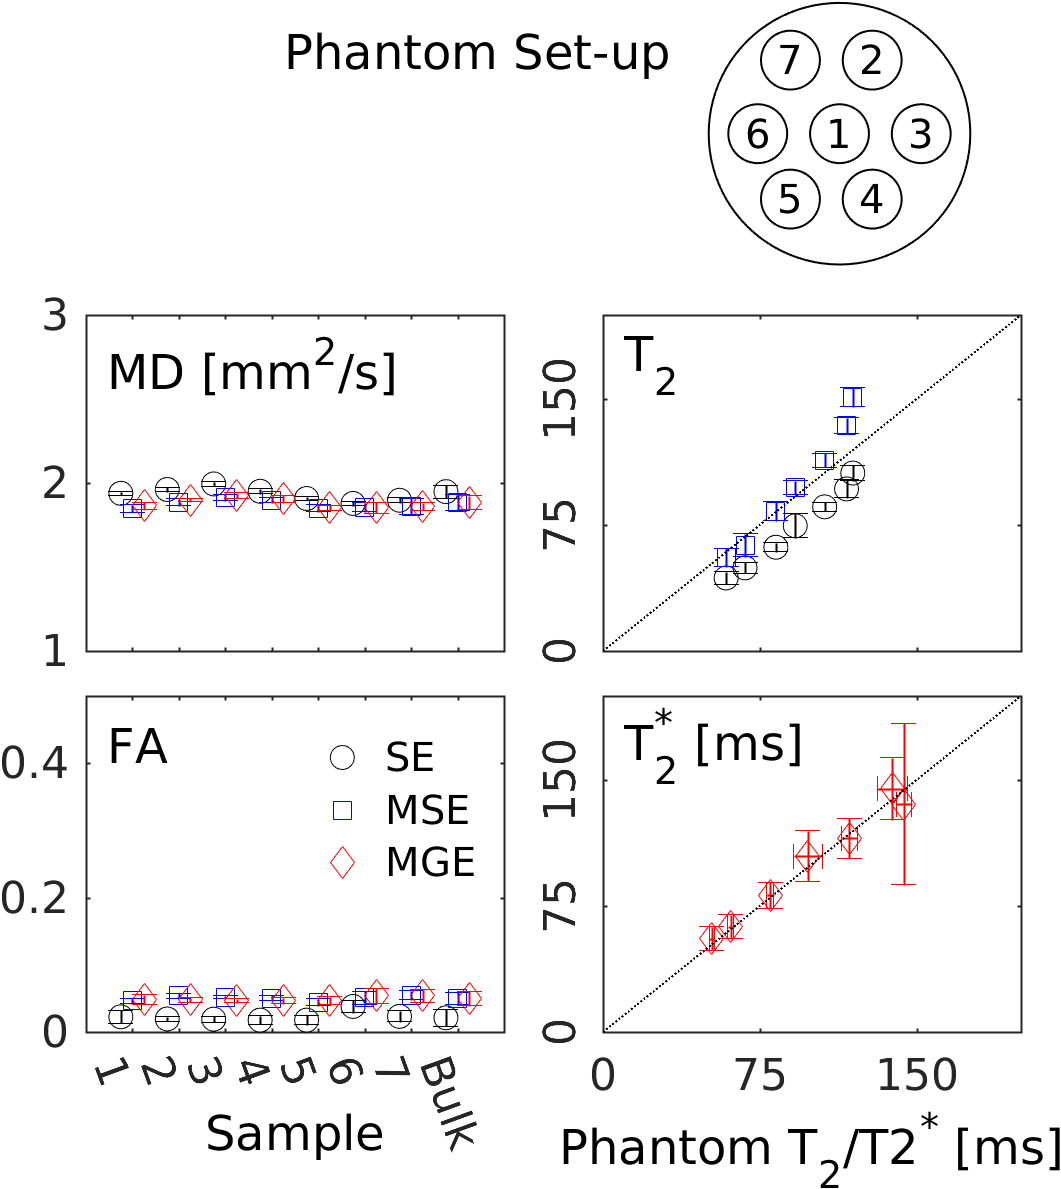
Raw DWI images of the phantom in Fig. 2 at $$$b\,=\,0$$$ and $$$b\,=\,600\,\mathrm{s/mm^2}$$$ illustrate the similarity in image quality between the three sequences. Signal is higher for the MGE-EPI $$$b\,=\,600\,\mathrm{s/mm^2}$$$ images as their TE are shorter. Further in the MGE-EPI, only a slight susceptibility artifact due to the T$$$_2^*$$$-weighting remained after extensive shimming (bottom right hand corner of the phantom). Fig. 3 and 4 display parameter maps and ROI parameter values of a single T$$$_2$$$/T$$$_2^*$$$-DTI compartment fitted to the phantom images (Fig. 2). Mean diffusivity (MD), Fractional Anisotropy (FA) and T$$$_2$$$/T$$$_2^*$$$-maps and values are very similar for the different sequences. The measured T$$$_2$$$ agree with phantom T$$$_2$$$ values (Fig. 4, T$$$_2$$$ as measured with MRF, [17]) with SE-EPI underestimating T$$$_2$$$ and MSE-EPI deviating at the higher end of the T$$$_2$$$-range. MGE-EPI T$$$_2^*$$$-values agree well with GRE-determined values.Conclusion
With multi-spin and multi-gradient echo sequences the combination of diffusion and T$$$_2$$$/T$$$_2^*$$$-weighted measurements can be fused in a single readout train, thus accelerating the acquisition with a factor 2.6x or 3.6x respectively. This shortened acquisition time increases the feasibility of orthogonal diffusion-T$$$_2$$$/T$$$_2^*$$$ acquisitions in research and clinical applications.Acknowledgements
This project is supported in part by the National Institutes of Health (NIH, R01-CA111996, R01-NS082436 and R01-MH00380). This work was performed under the rubric of the Center for Advanced Imaging Innovation and Research (CAI2R, https://www.cai2r.net), a NIBIB Biomedical Technology Resource Center (NIH P41EB017183).References
[1] Novikov DS, Kiselev VG, Jespersen SN. On modeling. Magn. Reson. Med. 2018; 79(6):3172-3193. [2] Novikov D, Jespersen SN, Kiselev VG, Fieremans E. Quantifying brain microstructure with diffusion MRI:Theory and parameter estimation. ArXiv preprint 2016;arXiv:1612.02059. [3] Jespersen, S. N., Kroenke, C. D., Ostergaard, L., Ackerman, J. J., Yablonskiy, D. A.. Modeling dendrite density from magnetic resonance diffusion measurements. Neuroimage 2007; 34 (4), 1473–1486. [4] Jelescu IO, Budde MD. Design and validation of diffusion MRI models of white matter. Front Phys 2017;28. [5] Jelescu IO, Veraart J, Fieremans E, Novikov D. Degeneracy in model parameter estimation for multi-compartmental diffusion in neuronal tissue. NMR in biomedicine 2016;29:33-47. [6] Veraart J, Novikov DS, Fieremans E. TE dependent Diffusion Imaging (TEdDI) distinguishes between compartmental T2 relaxation times. NeuroImage 2017. [7] Kim D, Doyle EK, Wisnowski JL, Kim JH, Haldar JP. Diffusion-relaxation correlation spectroscopic imaging: A multidimensional approach for probing microstructure. Magn. Res. Med. 2017;78:2236-49. [8] Pizzolato M, Canales-Rodriguez E, Daducci A, Thiran J. Multimodal microstructure imaging: joint T2-relaxometry and diffusometry to estimate myelin, intracellular, extracellular, and cerebrospinal fluid properties. Proc Intl Soc Mag Reson Med; 2018; Paris, France. p. 3118. [9] Li Y, Kim M, Lawrence T, Hemant P, Cao Y. Analysis of the T2-Relaxation-Diffusion Correlation MRI in Glioblastoma. Proc Intl Soc Mag Reson Med; 2018; Paris, France. p. 3100. [10] Farrher E, Buschbeck R, Choi C-H, et al. In vivo DTI-based free-water elimination with T2-weighting.Proc Intl Soc Mag Reson Med; 2018; Paris, France. p. 1629. [11] Tax CMW, de Almeida Martins JP, Szczepankiewicz F, Westin CF, Chamberland M, Topgaard D, Jones DK. From physical chemistry to human brain biology: unconstrained inversion of 5-dimensional diffusion-T2 correlation data. 2018; Paris, France. p 1101. [12] Hutter J, Slator PJ, Christiaens D, Teixeira RPAG, Roberts T, Jackson L, Price AN, Malik S, Hajnal JV. Integrated and efficient diffusion-relaxometry using ZEBRA. Sci Rep 2018;8:15138. [13] Slator P. J., Hutter J., Palombo M., Jackson L. H., Ho A., Panagiotaki E., Chappell L. C., Rutherford M. A., Hajnal J. V., Alexander D. C.. Combined diffusion-relaxometry MRI to identify dysfunction in the human placenta Magn Reson Med. 2019. [14] Nana R., Zhao T., Hu X. Single-Shot Multiecho Parallel Echo-Planar Imaging (EPI) for Diffusion Tensor Imaging (DTI) With Improved Signal-to-Noise Radio (SNR) and reduced Distortion. Magn. Reson. Med. 2008;60:1512-1517. [15] Yoneyama M, Sakai K, Kim E, Ogino T, Watanabe A, Van Cauteren M. Simultaneous Diffusion Tensor Imaging and T2 relaxometry in Lumbar Nerve Roots using Dual-Echo Single-Shot DW-EPI in Proc. Intl. Soc. Magn. Reson. Med.;25(Paris, France):5399 2018. [16] Cloos M.A., Knoll F., Zhao T., Block K.T., Bruno M., Wiggins G.C., Sodickson D.K.. Multiparametric imaging with heterogeneous radiofrequency fields Nature Comm. 2016;7:12445. [17] Cloos M. A., Asslander J., Abbas B., Fishbaugh J., Babb J. S., Gerig G., Lattanzi R.. Rapid Radial T1 and T2 Mapping of the Hip Articular Cartilage With Magnetic Resonance Fingerprinting J Magn Reson Imaging. 2019;50:810-815. [18] Veraart J, Novikov DS, Christiaens D, Ades-aron B, Sijbers J, Fieremans E. Denoising of diffusion MRI using random matrix theory. NeuroImage 2016;142:394-406. [19] Jenkinson M, Beckmann CF, Behrens TE, Woolrich MW, Smith SM. FSL. NeuroImage 2012;62:782–790.Figures
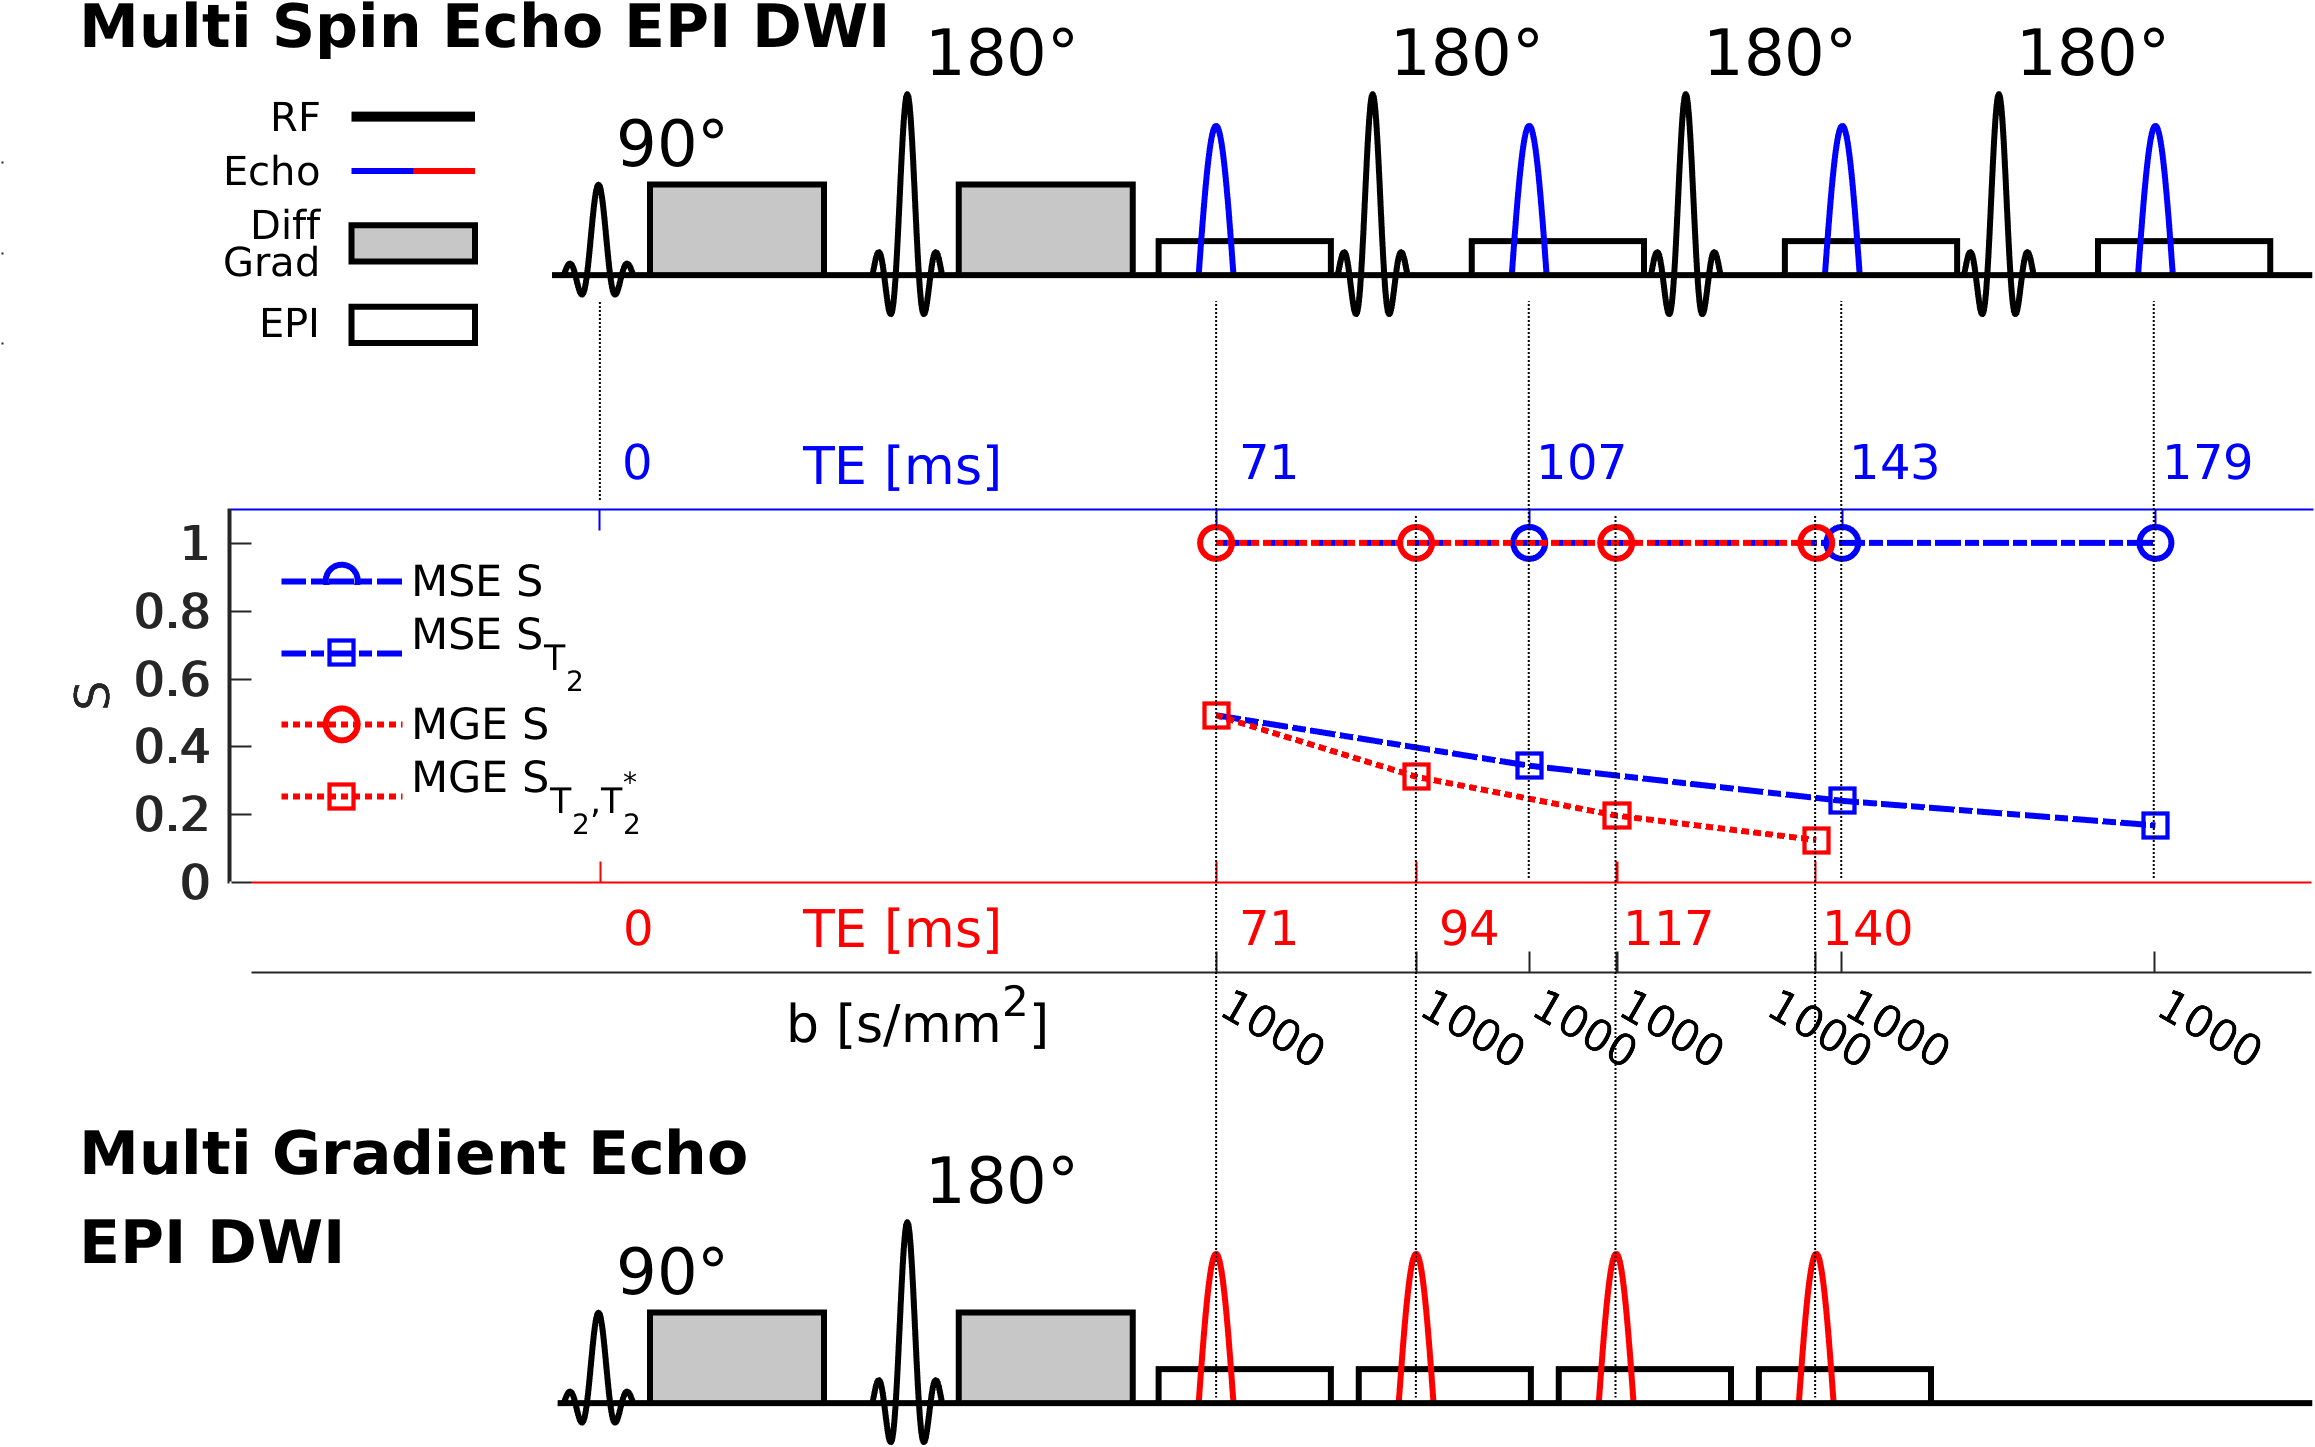
Figure 1: Sequence diagram of a Multi Spin Echo EPI (MSE-EPI) with echo times $$$\,=\,71,107,143$$$ and $$$179\,\mathrm{ms}$$$ (top) and a Multi Gradient Echo (MGE-EPI) diffusion sequence with echo times $$$\,=\,71,94,117$$$ and $$$140\,\mathrm{ms}$$$ (bottom). The expected signal decay due to T$$$_2$$$/T$$$_2^*$$$-relaxation and diffusion is indicated for each sequence (center). By reading out multiple echoes in a train after the standard diffusion encoding, a range of TEs can be sampled, thus encoding the diffusion contrast at several TE in a single echo train.