4496
Water diffusion pore imaging on a 14.1 T spectrometer using glass capillary phantoms in the presence of extraporal fluid1Medical Physics in Radiology, German Cancer Research Center (DKFZ), Heidelberg, Germany, 2Faculty of Physics and Astronomy, Heidelberg University, Heidelberg, Germany, 3Institute of Radiology, University Hospital Erlangen, Friedrich-Alexander-Universität Erlangen-Nürnberg (FAU), Erlangen, Germany, 4Molecular Structure Analysis, German Cancer Research Center (DKFZ), Heidelberg, Germany, 5Faculty of Medicine, Heidelberg University, Heidelberg, Germany
Synopsis
Diffusion pore imaging (DPI) can be used to retrieve the pore space function of arbitrary closed pores. In this study we show that DPI of glass capillaries is possible even under difficult experimental conditions. By separating the long gradient into a CPMG-like gradient echo train and matching the magnetic susceptibility, it was possible to acquire diffraction patterns of glass capillaries that were placed orthogonal to the main magnetic field. Furthermore, the feasibility of doing DPI in the presence of water outside the pores was demonstrated for the first time.
Introduction
Diffusion pore imaging enables the direct measurement of the shape of arbitrary closed pores that are filled with an NMR-detectable medium [1-3]. The first implementation of diffusion pore imaging on an NMR spectrometer [1] made use of the long–narrow approach [4] in order to retrieve the phase information necessary for reconstruction of the pore space function. To achieve correct measurements for $$$20$$$ µm capillaries, a CPMG train of 180° pulses was used in [1], where the long gradient with low amplitude was split into many short pulses. Also, the short high-amplitude gradient at the end of the pulse train was spilt into two parts separated by a 180° pulse. More recently, it has been shown that it is also possible to use a spin echo approach with a readout gradient in order to counteract gradient imperfections [3]. The aim of this study was to show that diffusion pore imaging is possible under more realistic conditions including magnetic field gradients introduced by susceptibility effects or water outside the pores, the latter being demonstrated for the first time.Methods
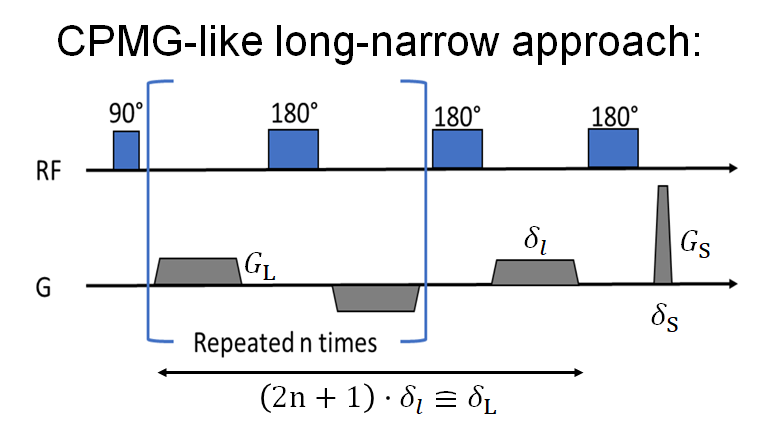
Glass capillaries of $$$3.5$$$ mm length and inner diameter $$$25$$$ µm were stacked horizontally inside a $$$5$$$-mm NMR tube, i.e. with orthogonal orientation to the main magnetic field. The capillaries were filled with a saturated aqueous NaCl solution – necessary to weaken the susceptibility effects introduced by the glass capillaries – resulting in a free diffusion coefficient $$$D=1.48$$$ μm2/ms for the water inside the capillaries at $$$T=298$$$ K. For the first experiment, a Bruker Diff30 Probe ($$$G_\text{max}=18$$$ T/m) was used and any residual NaCl solution on the outside of the capillaries was dispersed by filling the NMR tube with Flourinert. A schematic representation of the pulse sequence used for both experiments is presented in Figure 1. The long gradient of the long–narrow approach was split into a CPMG-like gradient pulse train separated by inserting 180° pulses. The long gradient was split into $$$39$$$ segments of $$$d_l=10.221$$$ ms each, yielding a total time of $$$\delta_\text{L}=400$$$ ms. The narrow gradient had a duration of $$$\delta_\text{S}=1.9$$$ ms with $$$G_\text{S,max}=2.7$$$ T/m, resulting in $$$q_\text{max}=1370$$$ mm-1.In a second experiment, the influence of an NMR detectable medium surrounding the pores was investigated. The NMR tubes were filled with the same NaCl solution that was used to fill the capillaries. For this experiment, we used a Bruker TBI Probe with a maximum gradient amplitude of $$$G_\text{max}=0.68$$$ T/m in z-direction. The long gradient for this experiment was split into $$$25$$$ segments of $$$\delta_l=16$$$ ms each, yielding a total time of $$$\delta_\text{L}=400$$$ ms. The narrow gradient had a duration of $$$\delta_\text{S}=6$$$ ms with $$$G_\text{S,max}=0.68$$$ T/m, resulting in $$$q_\text{max}=1080$$$ mm-1.
q-Values and the sampling of the gradient ramps had to be selected in order to match the available 16-bit raster of the gradient amplifier for all experiments.
Results
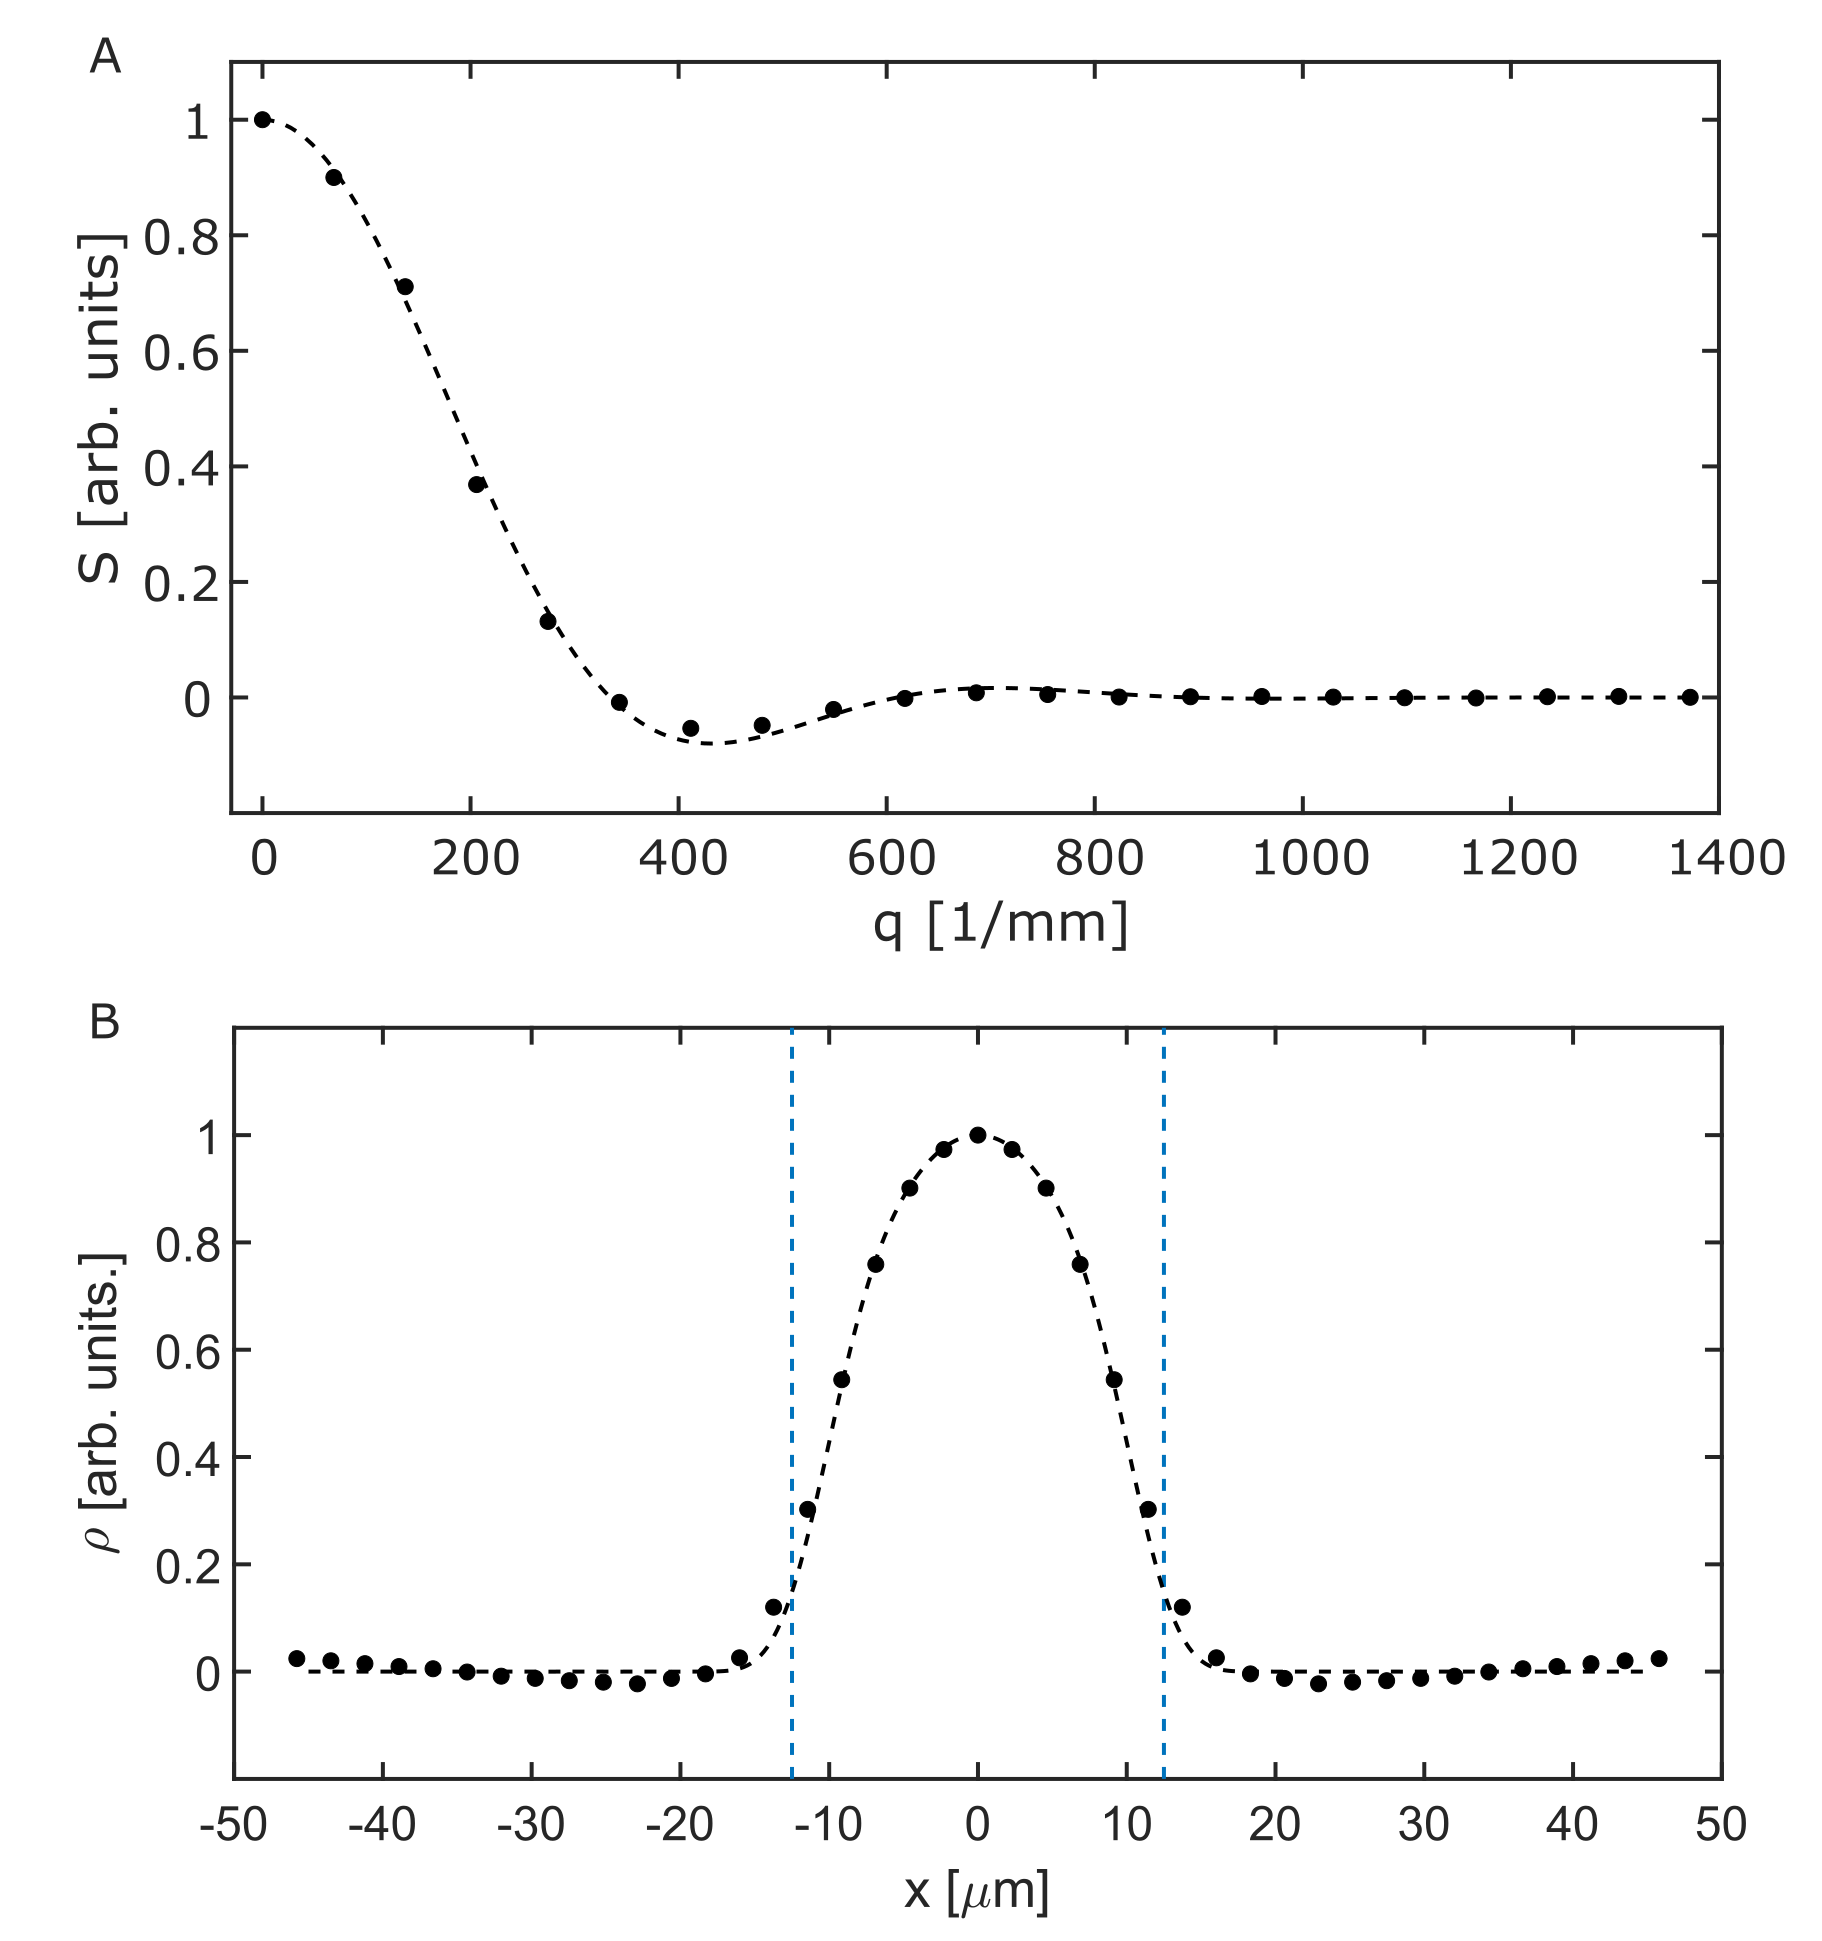
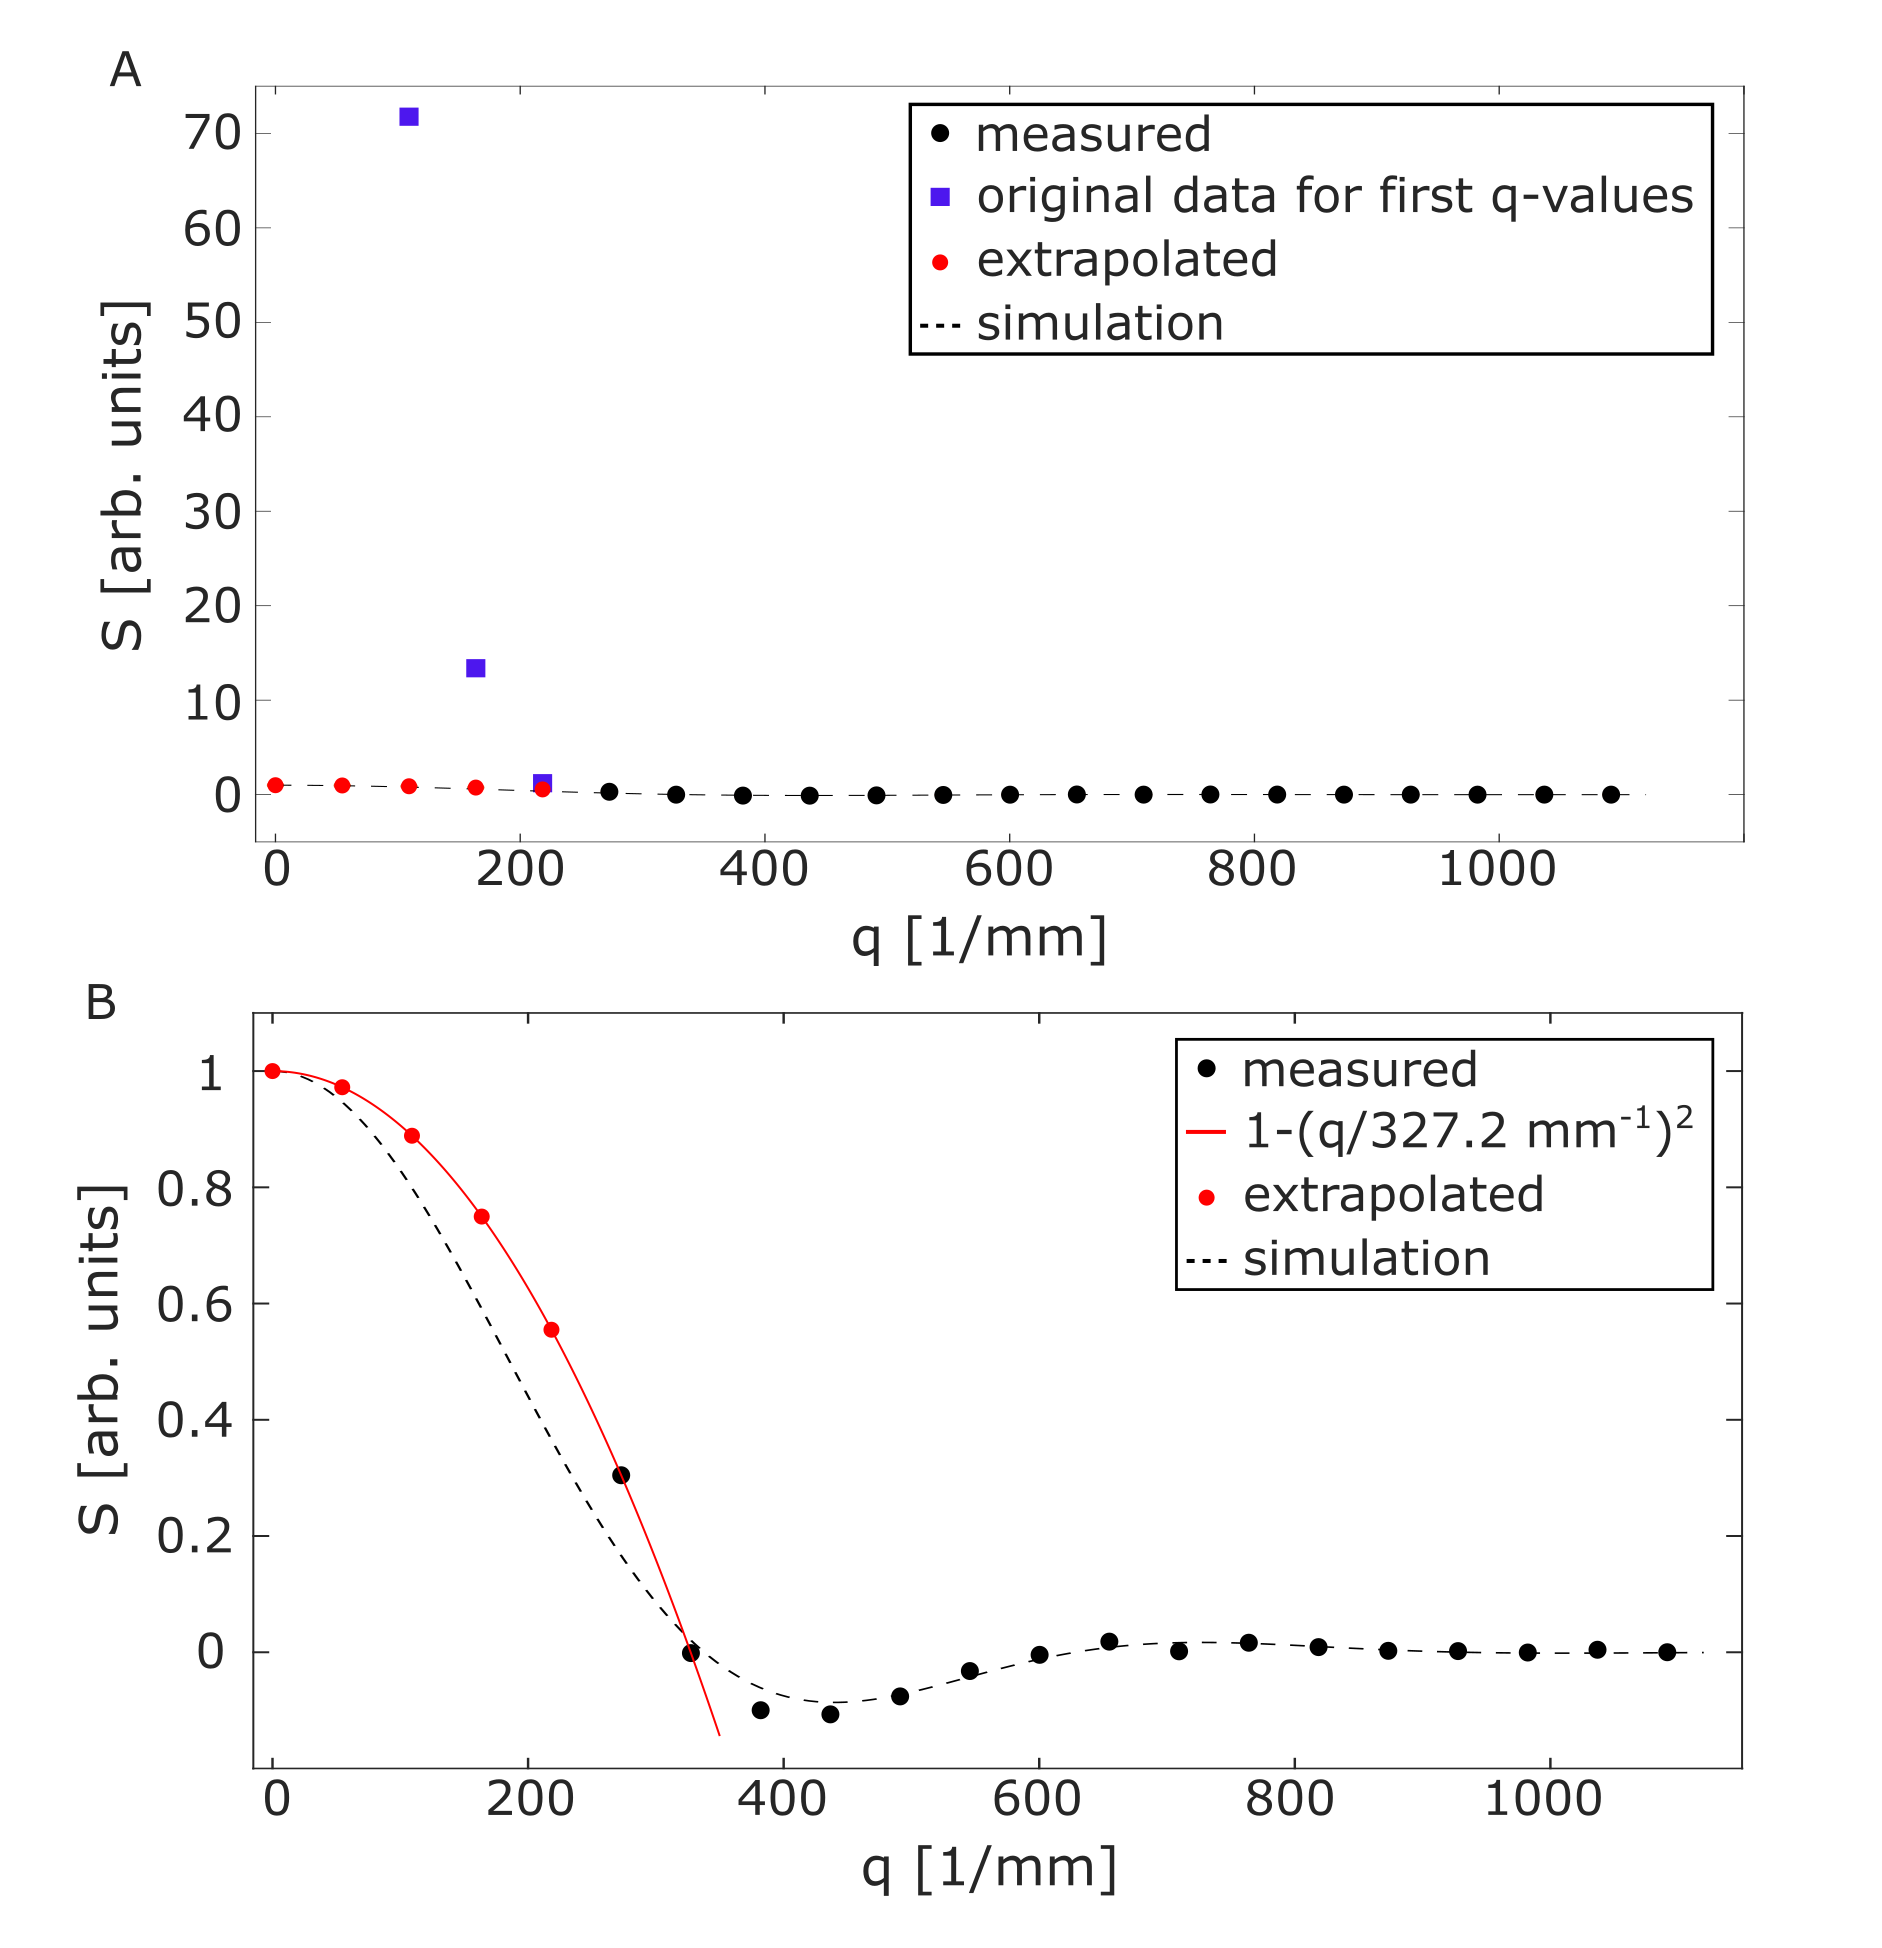
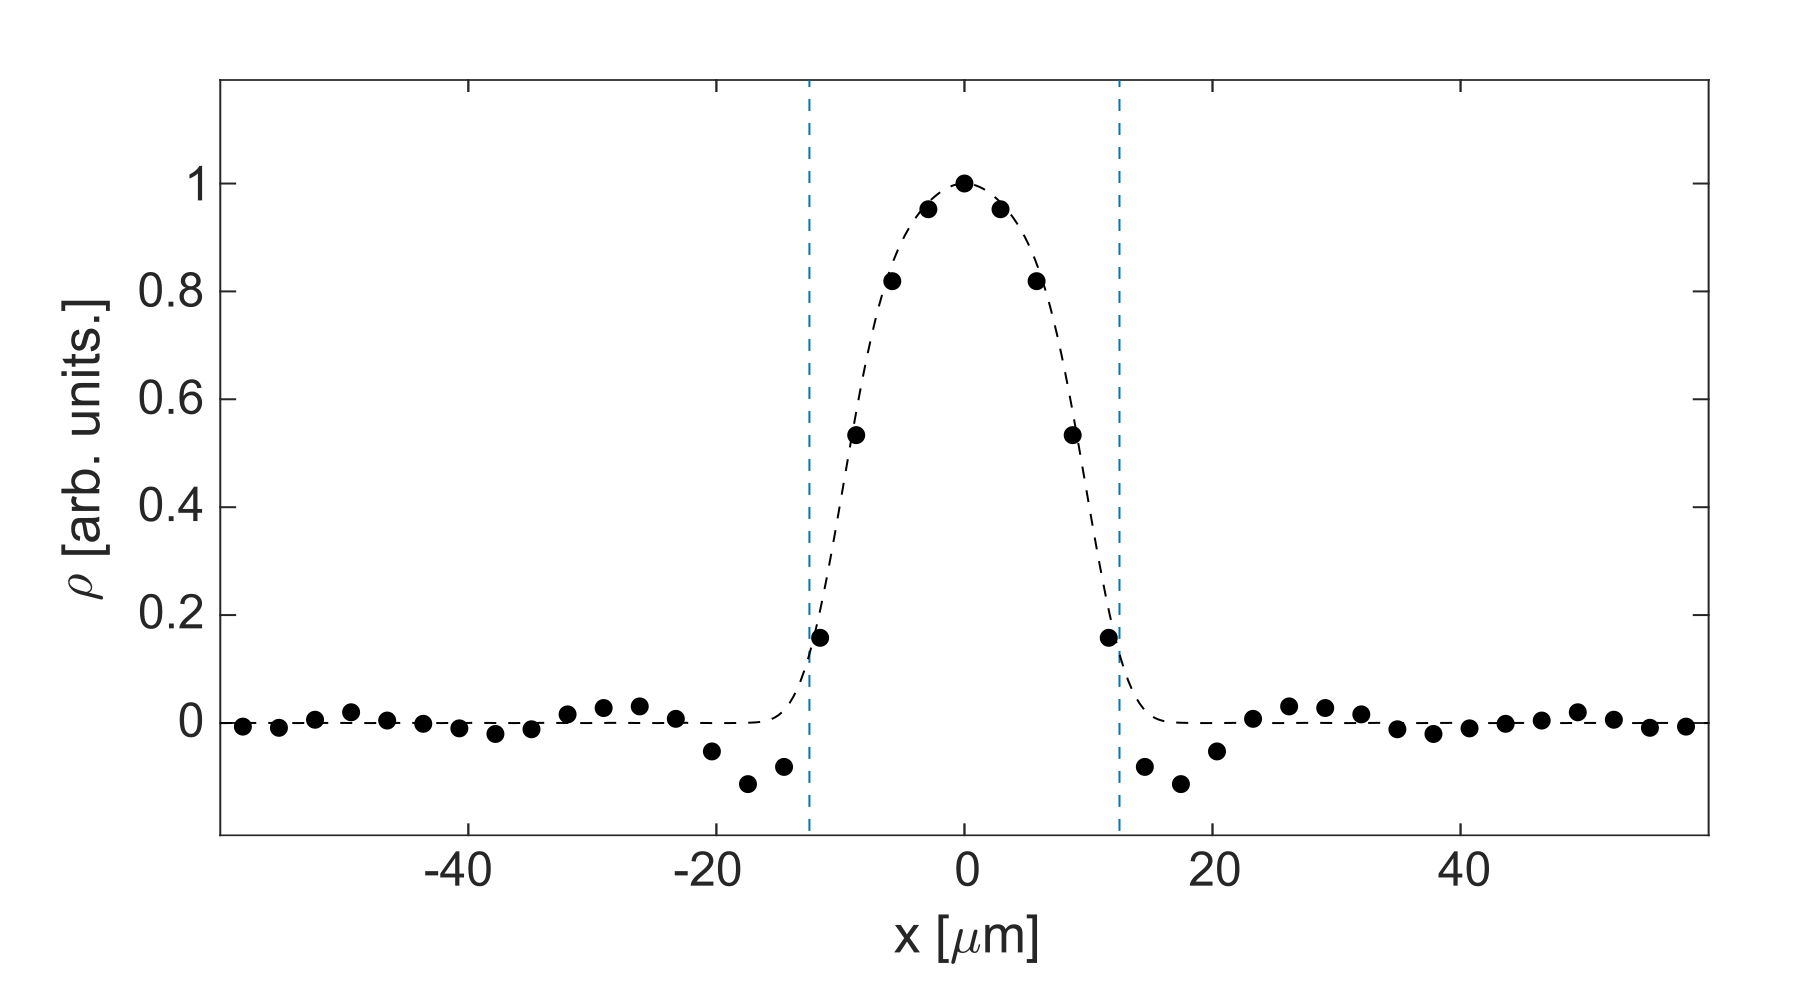
Figure 2A shows the signal as a function of the q-value together with simulated data. It is seen that the experimental result agrees well with the matrix-based simulation. Figure 2B shows the pore space function, which is the Fourier transform of Figure 2A. The pore space function clearly yields a diameter of 25 µm, though it is slightly smeared out at the edges. The results for the measurement with NaCl solution surrounding the capillaries are shown in Figure 3A. As the signal of the first five measurements is highly dominated by signal from the external water, as indicated by the purple squares in Figure 3A, the first part of the curve was extrapolated by using a parabola as a rough expansion of the Gaussian phase approximation: $$S(q)=S_0\cdot(1-(q/a)^2),$$where $$$a$$$ and $$$S_0$$$ were fitted using the first two reliably measured data points. The extrapolated curve as well as the measured data points are shown in Figure 3B. Measured data points are again in good agreement with the matrix-based simulation. The extrapolated data points show a moderate deviation from the matrix-based simulations. The reconstructed pore space function is shown in Figure 4. While the diameter of the capillaries can still be determined, minor deviations from simulation results are observed.
Discussion
The need for strong gradients is the main limiting factor of DPI. Nevertheless, we were able to demonstrate the feasibility of DPI with an ultra-high gradient system using $$$25$$$ µm capillaries without exploiting the full gradient strength available. Furthermore, we were able to show that diffusion pore imaging is possible in the presence of water outside the pores. A denser sampling near the first zero crossing might improve extrapolation. Further, a very high extraporal signal fraction was used here; in biological samples, this problem will be significantly reduced. Results might be improved by implementing a bipolar gradient pair in the first part of the CPMG train. By using this gradient pair as a filter for the water inside the pores that is more restricted, it might be possible to partly suppress the surrounding water signal, enabling the direct measurement of smaller q-values instead of extrapolating them. This work may therefore pave the way to applications with µm-sized objects such as living cells.Acknowledgements
Financial support by the DFG (Grant No. KU 3362/1-1) is gratefully acknowledged.References
[1]: Hertel, Stefan, Mark Hunter, and Petrik Galvosas. "Magnetic resonance pore imaging, a tool for porous media research." PRE 87.3 (2013): 030802.
[2]: Hertel, Stefan Andreas, et al. "Magnetic-resonance pore imaging of nonsymmetric microscopic pore shapes." PRE 92.1 (2015): 012808.
[3]: Bertleff, Marco, et al. "1D and 2D diffusion pore imaging on a preclinical MR system using adaptive rephasing: Feasibility and pulse sequence comparison." JMR 278 (2017): 39-50.
[4]: Laun, Frederik Bernd, et al. "Determination of the defining boundary in nuclear magnetic resonance diffusion experiments." PRL 107.4 (2011): 048102.
Figures