4494
Structural connectome of autonomic and sensory brainstem nuclei in humans based on 7 Tesla high spatial and angular resolution diffusion imaging1Brainstem Imaging Laboratory, Department of Radiology, Athinoula A. Martinos Center for Biomedical Imaging, Massachusetts General Hospital and Harvard Medical School, Boston, MA, United States, 2Department of Psychiatry and Psychology, Mayo Clinic, Rochester, MN, United States, 3Department of Otolaryngology, Head and neck Surgery, Mayo clinic, Rochester, MN, United States, 4Institute of Life Sciences, Sant'Anna School of Advanced Studies, Pisa, Italy, 5Laboratory of neuromotor physiology, IRCCS, Santa Lucia Foundation, Rome, Italy, 6Centre of SpaceBiomedicine, University of Rome for Vergata, Rome, Italy
Synopsis
With the advancement of imaging technologies and signal processing tools, ample progress has been made in cortical and sub-cortical brain structural connectivity mapping; however, this is still missing in living humans for brainstem nuclei. Through high spatial-resolution 7 Tesla HARDI MRI and a recently developed probabilistic brainstem nuclei atlas, we built a structural connectome of autonomic and sensory brainstem nuclei in living humans. Interestingly, our connectome corresponded well with established non-human connectivity data. We foresee this connectome as basis for structural and functional studies of autonomic and sensory circuits in health and disease.
Introduction
The major brainstem nuclei of the autonomic and sensory system consist of the raphe magnus (RMg), lateral and medial parabrachial nuclei (LPB, MPB), viscero-sensory motor nuclei (VSM), vestibular nuclei (Ve), superior olivary complex (SOC), as well as superior and inferior colliculus (SC, IC). These nuclei are vital in regulating involuntary body functions such as respiration, heartbeat and visceromotor activity (RMg, LPB, MPB, VSM), as well as in processing balance (Ve), spatial orientation (Ve) and sensory information (SOC, SC, IC)1-3. A diagram of structural connectivity pathways (“connectome”) of brainstem autonomic and sensory nuclei, a crucial resource to evaluate the structure and function of these nuclei in health and disease, is available in animals4-5; yet, such a diagram is missing in humans due to limitations (e.g. contrast, resolution) in conventional structural and diffusion brainstem MRI, and the lack of localization of these tiny structures in vivo.Purpose
To develop the structural connectome of autonomic and sensory brainstem nuclei in healthy living humans based on high spatial resolution 7 Tesla HARDI and our recently developed in vivo human probabilistic brainstem nuclei atlas6-9.Methods
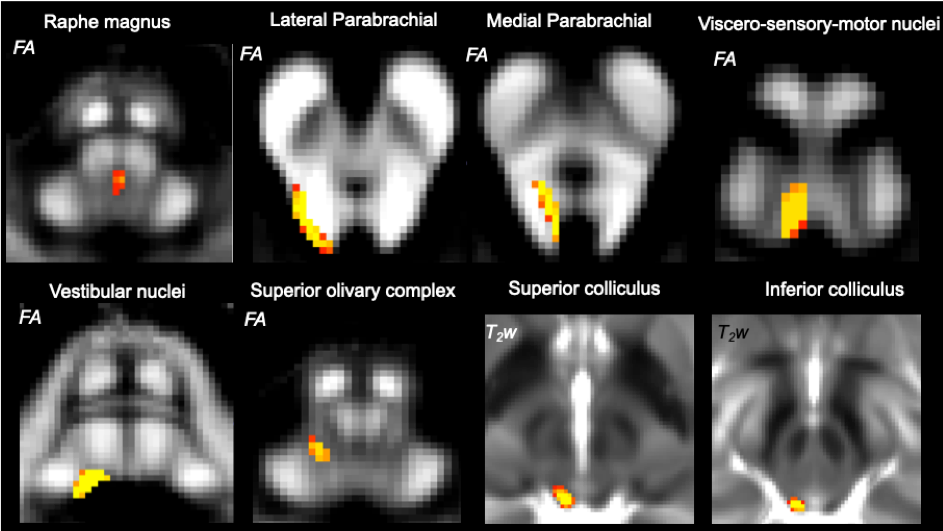
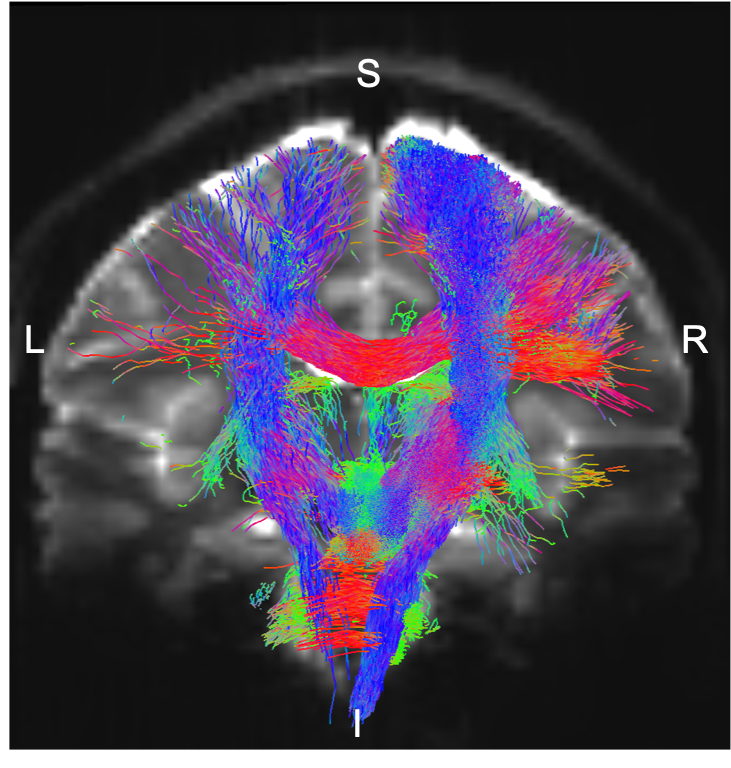
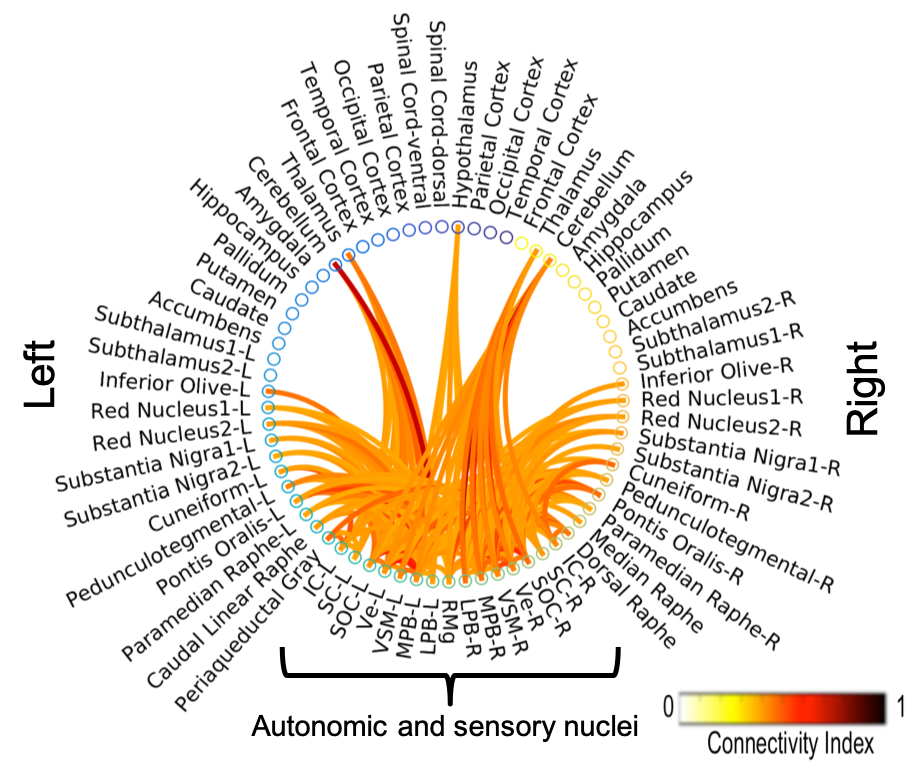
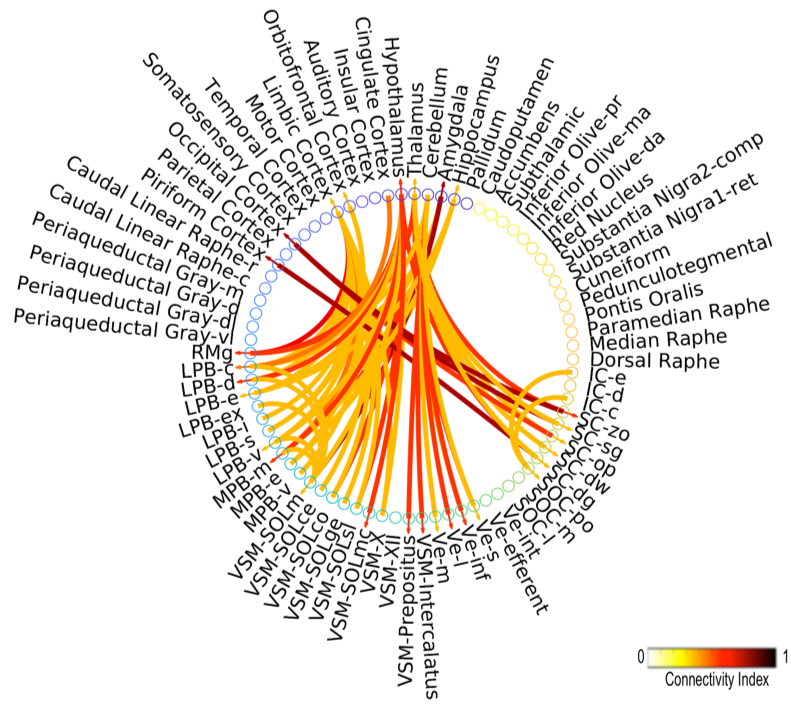
Data acquisition: Twelve healthy subjects (6m/6f; age 29 ± 3) underwent 7 Tesla MRI under IRB-approval. T1-weighted multi-echo MEMPRAGE image: with parameters repetition-time/echo-times/inversion-time/flip-angle/FOV/bandwidth/GRAPPA-factor: 2.51s/1.6, 3.5, 5.3, 7.2 ms/1.5 s/7°/256×256×176 mm3/“651 Hz/pixel”/2, acquisition-time: 6′34′′. HARDI: common single-shot 2D spin-echo EPI (using a prototype sequence which supports unipolar diffusion encoding) with parameters n. slices/echo-time/repetition-time/phase-encoding direction/bandwidth/partial-Fourier/n. diffusion-directions/b-value: 82 /66.8 ms/7.4 s/“anterior/posterior”/“1456 Hz/pixel”/“6/8”/60/2500 s/mm2, seven interspersed “b0” images (T2-weighted, non-diffusion weighted, b-value = 0 s/mm2), acquisition-time: 8′53′′. To perform distortion-correction we also acquired seven “b0” images with opposite phase-encoding direction.Data analysis: a) Preprocessing: We computed the root-mean-square MEMPRAGE image across echo-times, rotated it to standard-orientation (“RPI”), cropped the most inferior slices containing the spinal-cord (in order to aid its coregistration to MNI-space) and bias-field corrected it (SPM8); we then parcellated the resulting image with Freesurfer10. HARDIs were rotated to standard-orientation, de-noised11, motion and distortion-corrected (FSL, topup/eddy). We then computed the diffusion tensor, tensor-invariants (e.g. fractional anisotropy, FA) and S0 (T2-weighted) image from the preprocessed HARDIs (FSL, dtifit). To map the Freesurfer parcellation to native HARDI-space, we computed an affine boundary-based transformation (FSL, FLIRT-BBR) between the preprocessed MEMPRAGE image and single-subject S0 images. To map the brainstem nuclei atlas to native HARDI-space, we computed the bivariate high-dimensional diffeomorphic transformations (ANTs) between stereotactic (IIT-MNI) FA/S0 templates12 and single-subject FA/S0 images using an intermediate group-based optimal bivariate template. b) Definition of seed and target regions for HARDI-based connectivity analysis: As seed regions, we used the structural probabilistic atlas labels6-9 of eight brainstem nuclei (RMg, LPB-R/L, MPB-R/L, VSM-R/L, Ve-R/L, SOC-R/L, SC-R/L, IC-R/L) involved in autonomic and sensory function (Figure 1) mapped from stereotactic-space to native-space (using the coregistration transformations explained above). As target regions, we used the probabilistic atlas labels of 41-brainstem nuclei6-9, as well as the 167 cortical/subcortical regions clubbed into 27 bilateral regions obtained in each subject from the MEMPRAGE Freesurfer-parcellation (mapped to native space as explained above). For display-purposes, we grouped cortical parcellations within each cerebral lobe (frontal/parietal/temporal/occipital). c) Single-subject HARDI-based connectivity analysis: We performed probabilistic tractography using MRtrix3 iFOD2 algorithm based on constrained spherical deconvolution, with an maximum angle between successive steps of 120 degrees and a minimum streamline length of 1 mm (Figure 2). We propagated 100,000 streamlines from each seed-mask, and computed a “structural-connectivity-index” (range: [0 1]) for each pair of seed-target masks (= fraction of streamlines propagated from the seed reaching the target mask). d) Group HARDI-based connectivity analysis: We averaged across subjects the structural-connectivity-index of brainstem nuclei with target-regions to yield a group structural connectome of these nuclei. We displayed this connectome using a 2D circular diagram13. e) Prediction model: As a validation of the DTI-based connectome, we derived a prediction model of expected structural-connectivity pathways of these nuclei based on animal literature4,5.
Results and Discussion
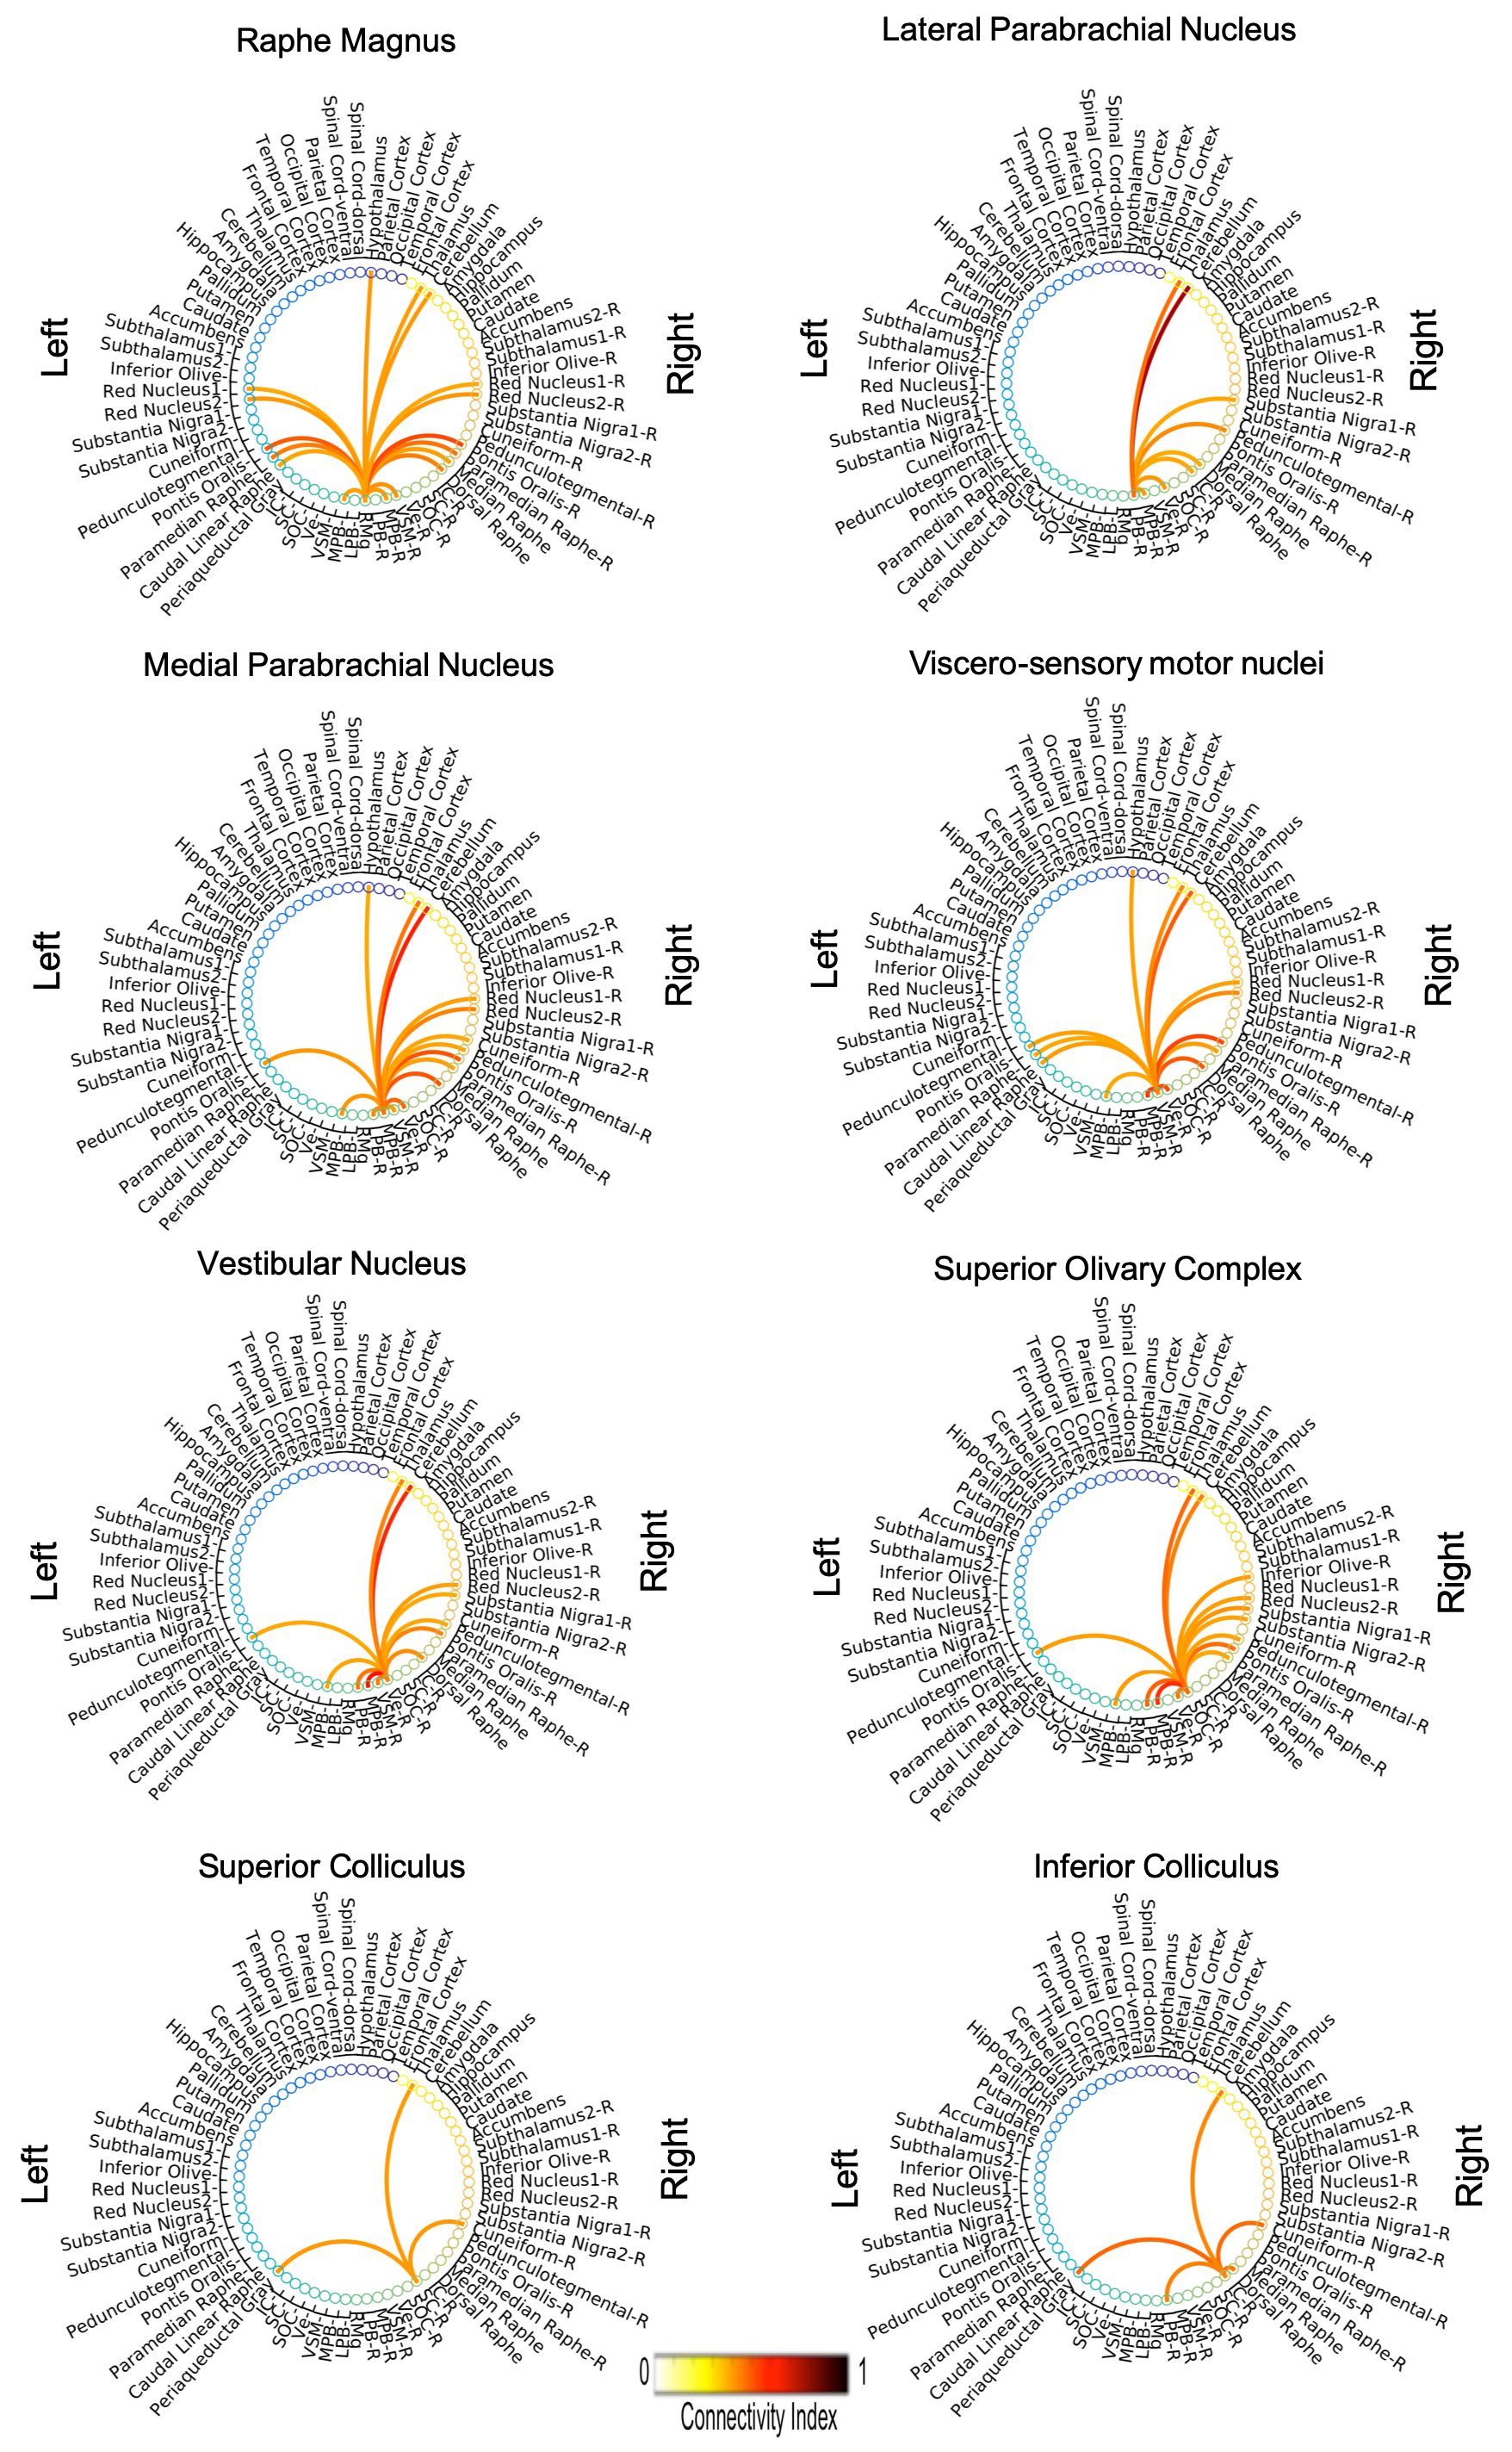
The investigated eight autonomic and sensory brainstem nuclei demonstrated high connectivity with the thalamus, cerebellum and hypothalamus in healthy adult controls (Figures 3-4). Interestingly, the structural connectome displayed dense connectivity among autonomic and sensory brainstem nuclei, thus, indicating pathway specificity within the autonomic-sensory network. The rodent connectome (Figure 5) demonstrated high connectivity with the thalamus, cerebellum, hypothalamus, and high interconnectivity among autonomic and sensory brainstem nuclei, which matched our human connectome results. In addition, the rodent connectome showed connectivity to the amygdala, hippocampus and cortex.Conclusion
We mapped the structural connectome of eight major nuclei involved in autonomic and sensory functions, in good agreement with animal studies. The structural connectome of autonomic and sensory brainstem nuclei in living humans can be used as a tool to evaluate the structure and function of these nuclei in health and a broad set of diseases (e.g. autonomic dysfunction, vestibular disorders, eye movement and visual-field deficits, hallucinations in Parkinson’s disease) and prospectively for neurosurgical planning.Acknowledgements
NIH-NICDC-R21DC015888, NIH-NIBIB-K01EB019474; MGH-Claflin-Distinguished-Scholar; Dr. Thorsten Feiweier for providing the diffusion sequence used in this study.References
1. Olszewski J, Baxter D, Karger S. (Ed.), Cytoarchitecture of the Human Brainstem, JB Lippincott Company, Philadelphia and Montreal North America, 1954.
2. Staab JP, Balaban CD, Furman JM. Threat assessment and locomotion: clinical applications of an integrated model of anxiety and postural control. Semin Neurol. 2013; 33, 297-306
3. Balaban CD. Neural substrates linking balance control and anxiety. Physiol Behav. 2002; 77, 469-475.
4. Bota M, Dong HW, Swanson LW. Brain architecture management system. Neuroinformatics. 2005; 3(1):15-48.
5. Stephan KE, Kamper L, Bozkurt A et al. Advanced database methodology for the Collation of Connectivity data on the Macaque brain (CoCoMac). Philos. Trans. R. Soc. Lond. B Biol. Sci. 2001; 356 1159–1186
6. Bianciardi M, Toschi N, Edlow BE, et al., Toward an in vivo neuroimaging template of human brainstem nuclei of the ascending arousal, autonomic, and motor systems. Brain Connect. 2015; 5: 597-607.
7. Bianciardi M, Strong C, Toschi N, et al., A probabilistic template of human mesopontine tegmental nuclei from in vivo 7T MRI. Neuroimage. 2018; 170: 222-230.
8. García-Gomar MG, Strong C, Toschi N, et al. In vivo probabilistic structural atlas inf the inferior and superior colliculi, medial and lateral geniculate nuclei and superior olivary complex in humans based on 7 Tesla MRI. Front. Neurosci. 2019; 13(764): 1-15.
9. Singh K, Indovina I, Augustinack JC, et al. Probabilistic atlas of the lateral parabrachial nucleus, medial parabrachial nucleus, vestibular nuclei complex and medullary viscero-sensory-motor nuclei complex in living humans form 7 Tesla MRI. Biorxiv. 2019. (https://www.biorxiv.org/content/10.1101/814228v1)
10. Desikan RS, Segonne F, Fischl B, et al. An automated labeling system for subdividing the human cerebral cortex on MRI scans into gyral based regions of interest. Neuroimage. 2006; 31: 968-980.
11. Manjon JV, Coupé P, Concha L, et al., Diffusion Weighted Image Denoising Using Overcomplete Local PCA. PLoS ONE. 2013; 8(9): e73021.
12. Varentsova A, Zhang S, Arfanakis K., Development of a high angular resolution diffusion imaging human brain template. Neuroimage. 2014; 91: 177-186.
13. Irimia A, Chambers MC, Torgerson CM, et al., Circular representation of human cortical networks for subject and population-level connectomic visualization. Neuroimage. 2012; 60: 1340-1351.
Figures