4490
Assessing brain wiring patterns using tractography fiber clustering to study sex differences of the frontostriatal white matter connections
Fan Zhang1, Mark Vangel1, Marek Kubicki 1, Martha E Shenton1, Lauren J O'Donnell1, and James J Levitt1
1Harvard Medical School, Boston, MA, United States
1Harvard Medical School, Boston, MA, United States
Synopsis
We studied structural connectivity differences between females and males in frontostriatal white matter connections. We proposed a novel method to measure the topographical organization of the frontostriatal circuits, leveraging a data-driven fiber clustering of whole-brain dMRI tractography. The proposed topographical measure provides important information to assess the segregated and integrative brain wiring patterns in the human brain. We applied this technique to test for sex differences in a cohort of 100 healthy subjects. We identified significant group differences in the frontostriatal white matter connections, potentially related to the sex-specific brain wiring patterns.
Introduction
Sex-biased conditions have been shown to associate with the sexual dimorphism of the brain structural connections1. Diffusion MRI (dMRI) is the only non-invasive method that can map the living human brain’s connections and has been used to explore structural differences between the brains of the human sexes2–6.In this work, we utilize dMRI to test for structural connectivity differences between females and males in frontostriatal white matter connections. Previous studies have identified significant sex differences of the white matter in the frontal lobe, by analyzing dMRI-based quantitative microstructure measures such as fractional anisotropy and mean diffusivity5,6. These measures are useful for the assessment of differences in the underlying tissue microstructure between different populations. However, they do not provide topographical information of the WM connections, which is important for assessing the brain wiring pattern7.
Therefore, we propose a novel method, using fiber clustering of whole-brain dMRI tractography to assess the topographical organization of frontostriatal structural connectivity, which allows us to quantify the degree of deviation from a topographic, parallel, arrangement. The proposed method provides important information to assess the segregated and integrative brain wiring patterns in the human brain8. We applied the proposed method to study sex differences in a cohort of 100 healthy subjects.
Methods
Study population and dMRI data: We studied 100 healthy adult subjects from the Human Connectome Project (HCP)9 (46 females and 54 males; age-matched with p=0.91). dMRI data (b=0/3000s/mm2, 90 directions, 18 b=0, TE/TR=89.5/5520ms, and 1.25x1.25x1.25mm3) was used. Whole-brain tractography was computed using an Unscented Kalman Filter (UKF) method10 implemented in SlicerDMRI11.A novel topographical measure of the frontostriatal WM connections: 1) We identified WM connections from the prefrontal cortex (PFC) and the striatum (S). We leveraged a data-driven fiber clustering atlas12 that allows for a whole-brain tractography parcellation into 2000 fiber clusters for each HCP subject under study. We identified fiber clusters of interest (i.e., from PFC to S) according to their connected anatomical brain regions, in particular, the Freesurfer13 regions including orbital, lateral and medial PFC regions and the caudate. 2) We quantified the topographical relationship of fiber clusters of interest. For each pair of clusters, we measured the mean fiber endpoint distance within PFC (i.e., cortical distance DPFC) and the mean fiber endpoint distances terminating in the caudate (i.e., striatal distance DS)(Figure-1). A high DPFC and a low DS describe a convergent (integrative) pattern of frontostriatal WM connection, while a low DPFC and a high DS describe a divergent (segregated) pattern. For each pair of clusters, we measured the ratio of the fiber endpoint distances: RD=(DPFC-DS)/(DPFC+DS) for an integrated measure including both DPFC and DS.
Statistical analysis: 1) We first compared sex differences for all pairs of clusters using RD. For each subject, we put the RD values of all pairs of clusters together as a feature vector. Across all subjects, we performed a principal component analysis (PCA)14 for feature dimension reduction to focus on the cluster pairs that are the most discriminative between the two groups. Then, we performed a Hotelling T-Squared test15 for computing group differences using the features after PCA reduction. We tested for multiple dimension reduction strategies (i.e. different dimensions after PCA), where a p-value was computed per strategy (FDR corrected for multiple comparisons across all strategies). 2) We also compared sex differences for each cluster uring RD. For each cluster and each subject, we put the RD values with respect to the remaining clusters together as a feature vector. Then, we performed a Hotelling T-Squared test to computing group differences of each cluster. FDR was performed for multiple comparison corrections across all clusters.
Results
We identified 17 WM fiber clusters that connect PFC and S in both the left and right hemispheres. These resulted in a total of 136 pairs of fiber clusters per hemisphere, yielding 136 RD values. The statistical comparison across all pairs of clusters shows that when the dimension was higher or equal to 23 and 34 in the left and right hemispheres, respectively, there were significant group differences (Figure-2). For the comparison on each individual cluster, we found that clusters #10 (connecting the left rostral middle frontal gyrus) and #16 (connecting the left lateral orbito frontal gyrus) in the left hemisphere were significantly different, and cluster #3 (connecting the right rostral middle frontal gyrus) in the right hemisphere was significantly different (Figure-3).Discussion
We found significant sex differences of the WM connections in the frontostriatal circuits, which are important in modulating human cognitive control and reward processing16. The identified significant group differences were potentially related to the different brain wiring patterns in the frontal lobe between females and males. In particular, we found three individual clusters that connect the associative dorsolateral prefrontal cortex that is associated with executive functions and the limbic orbitolateral prefrontal cortex that is associated with functions including reward processing17.Conclusion
We proposed a novel method to investigate the topographical structural connectivity in frontostriatal white matter connections. We applied this method to study white matter sexual differences in a cohort of 100 healthy subjects. In the future, we plan to use this methodology to assess diverse groups including comparing healthy subjects versus those with psychosis.Acknowledgements
The authors gratefully acknowledge the support of the following NIH grants: P41EB015898, R01MH108574, P41EB015902, R01MH119222, U01CA199459.References
1. de Vries, G. J. & Södersten, P. Sex differences in the brain: the relation between structure and function. Horm. Behav. 55, 589–596 (2009).2. Ingalhalikar, M. et al. Sex differences in the structural connectome of the human brain. Proc. Natl. Acad. Sci. U. S. A. 111, 823–828 (2014).
3. Oh, J. S. et al. Tractography-guided statistics (TGIS) in diffusion tensor imaging for the detection of gender difference of fiber integrity in the midsagittal and parasagittal corpora callosa. NeuroImage 36, 606–616 (2007).
4. Thiebaut de Schotten, M. et al. Atlasing location, asymmetry and inter-subject variability of white matter tracts in the human brain with MR diffusion tractography. Neuroimage 54, 49–59 (2011).
5. Lebel, C., Caverhill-Godkewitsch, S. & Beaulieu, C. Age-related regional variations of the corpus callosum identified by diffusion tensor tractography. Neuroimage 52, 20–31 (2010).
6. Szeszko, P. R. et al. Sex differences in frontal lobe white matter microstructure: a DTI study. Neuroreport 14, 2469–2473 (2003).
7. Wedeen, V. J. et al. The geometric structure of the brain fiber pathways. Science 335, 1628–1634 (2012).
8. Draganski, B. et al. Evidence for segregated and integrative connectivity patterns in the human Basal Ganglia. J. Neurosci. 28, 7143–7152 (2008).
9. Glasser, M. F. et al. The minimal preprocessing pipelines for the Human Connectome Project. Neuroimage 80, 105–124 (2013).
10. Malcolm, J. G., Shenton, M. E. & Rathi, Y. Filtered multitensor tractography. IEEE Trans. Med. Imaging 29, 1664–1675 (2010).
11. Norton, I. et al. SlicerDMRI: Open Source Diffusion MRI Software for Brain Cancer Research. Cancer Res. 77, e101–e103 (2017).
12. Zhang, F. et al. An anatomically curated fiber clustering white matter atlas for consistent white matter tract parcellation across the lifespan. Neuroimage 179, 429–447 (2018).
13. Fischl, B. FreeSurfer. Neuroimage 62, 774–781 (2012).
14. Wold, S., Esbensen, K. & Geladi, P. Principal component analysis. Chemometrics Intellig. Lab. Syst. 2, 37–52 (1987).
15. Hotelling, H. The Generalization of Student’s Ratio. in Breakthroughs in Statistics: Foundations and Basic Theory (eds. Kotz, S. & Johnson, N. L.) 54–65 (Springer New York, 1992).
16. Barch, D. M. & Dowd, E. C. Goal Representations and Motivational Drive in Schizophrenia: The Role of Prefrontal–Striatal Interactions. Schizophr. Bull. 36, 919–934 (2010).
17. Szczepanski, S. M. & Knight, R. T. Insights into human behavior from lesions to the prefrontal cortex. Neuron 83, 1002–1018 (2014).
Figures
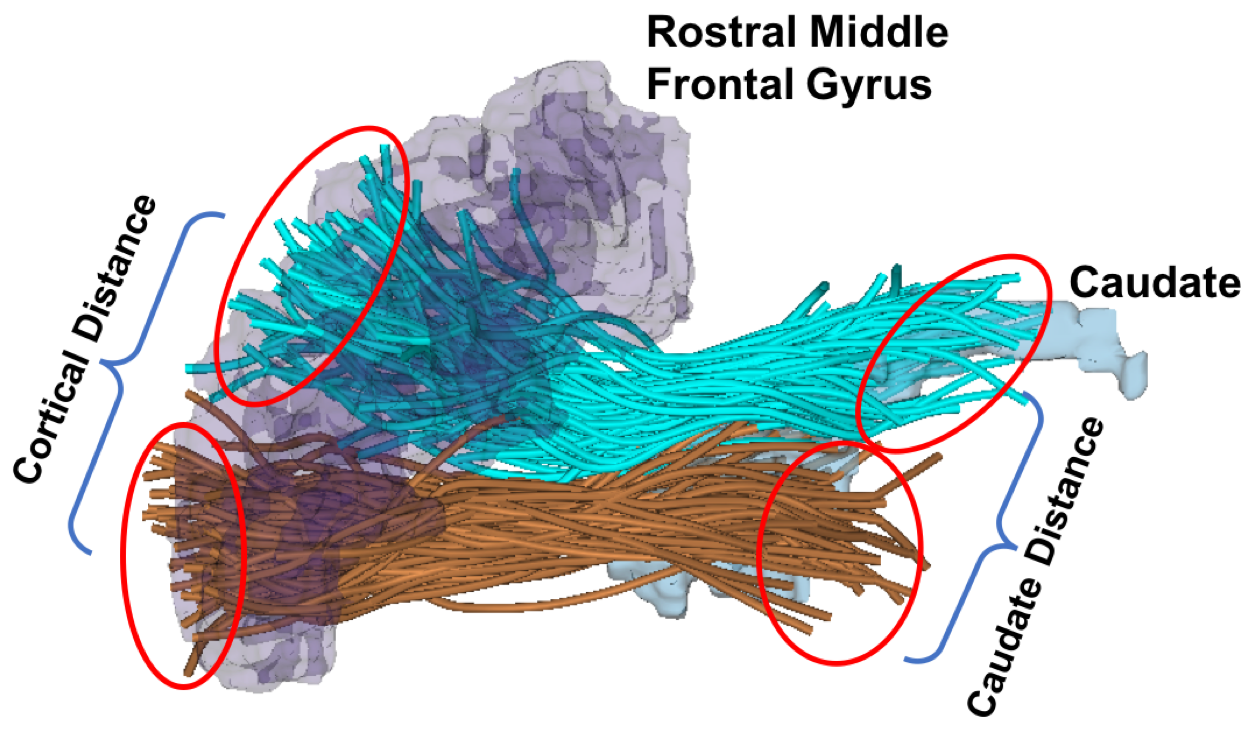
Figure-1: Computation of the mean fiber endpoint distance within PFC (i.e., cortical distance, DPFC) and the mean fiber endpoint distances terminating in the caudate (i.e., striatal distance, DS). Two example clusters (cyan and brown streamlines) of interest that connects the rostral middle frontal gyrus (purple 3D model) to the caudate (blue 3D model) in the left hemisphere.
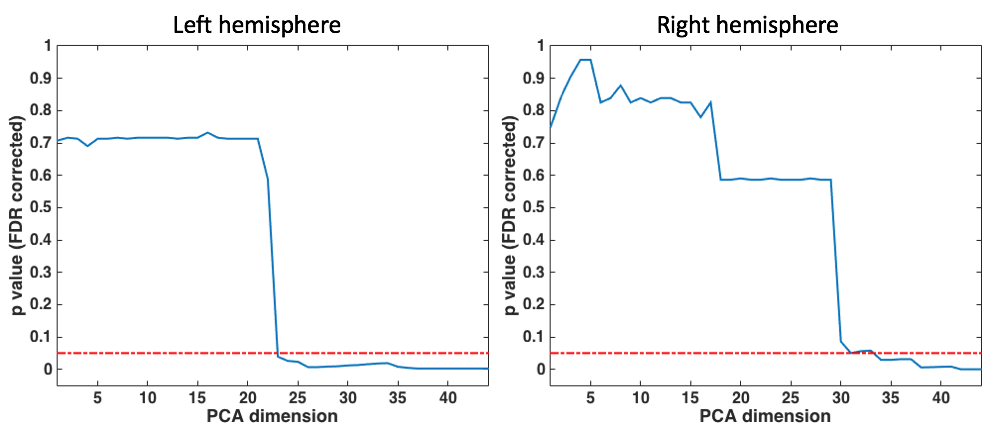
Figure-2: Statistical comparison between females and males using the RD values of all cluster pairs (a total of 136 cluster pairs per subject). Significant group differences (p<0.05, after FDR correction) are identified when the dimension after PCA is higher or equal to 23 and 34 in the left and right hemispheres, respectively.
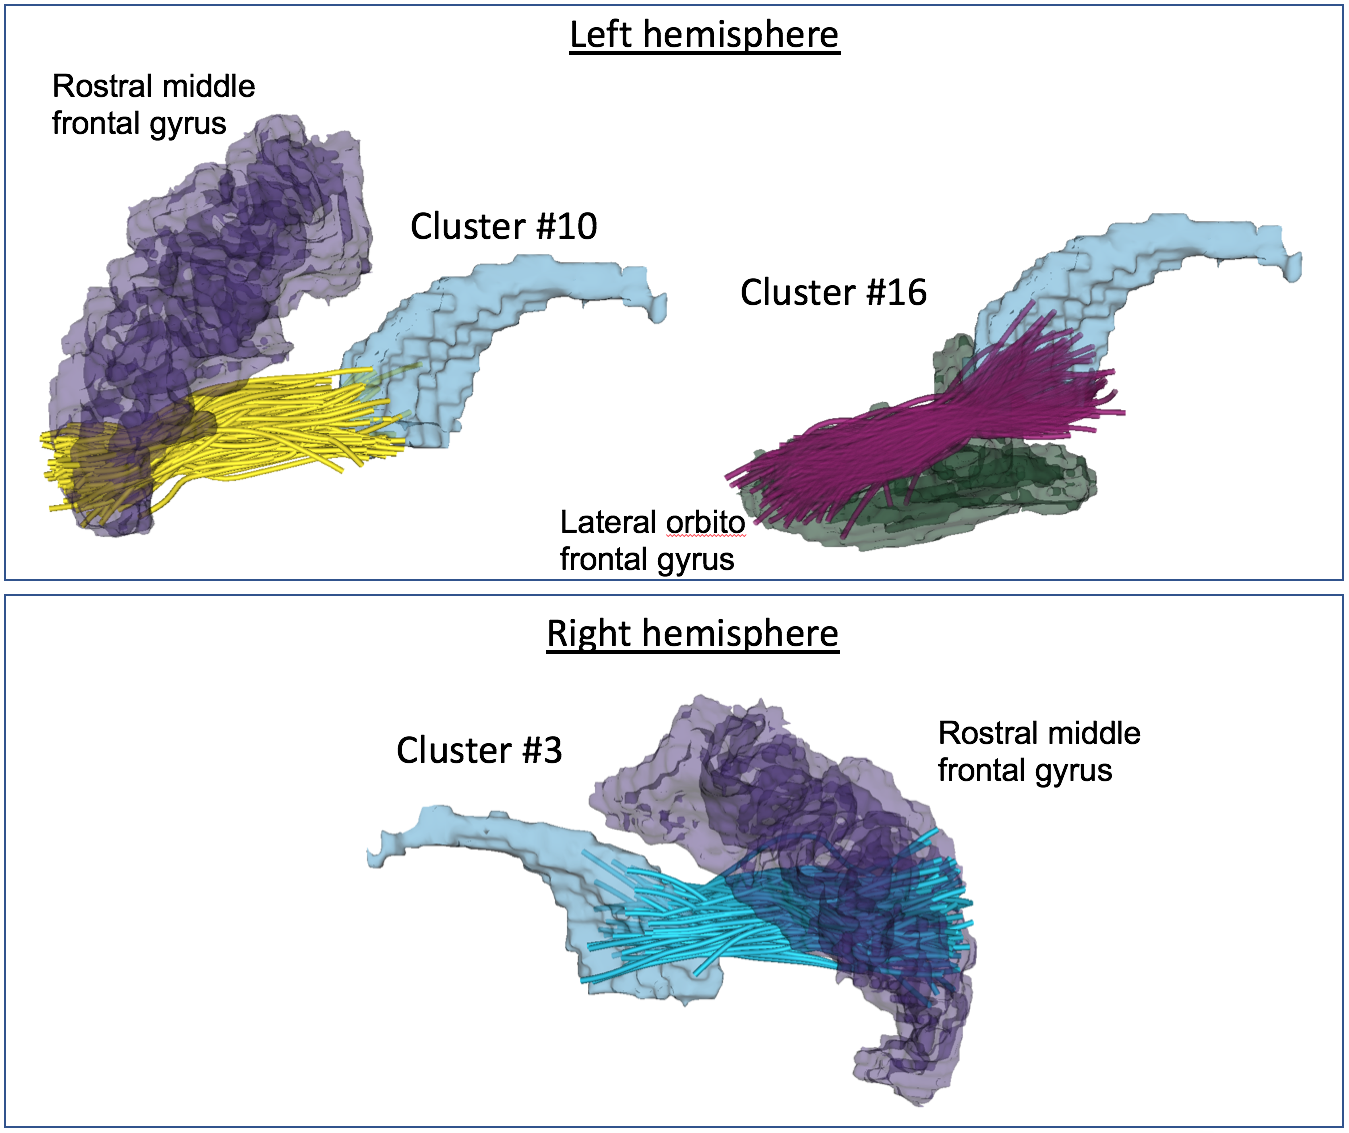
Figure-3: Visualization of the fiber clusters that are significantly different between females and males. Two clusters are identified in the left hemisphere, connecting the left rostral middle frontal gyrus (purple 3D model) and the left lateral orbito frontal gyrus (blue 3D model) to the left caudate (blue 3D model). One cluster is identified in the right hemisphere, connecting to the right rostral middle frontal gyrus (purple 3D model) to the right caudate (blue 3D model).