4488
Assessing scan-rescan reproducibility of surgically relevant white matter tractography reconstructions
Kan Yan Chloe Li1,2, Leevi Kerkelä1, Jonathan D Clayden1, Kiran K Seunarine1, Matt G Hall1,2, and Chris A Clark1
1UCL Great Ormond Street Institute of Child Health, London, United Kingdom, 2National Physical Laboratory, Teddington, United Kingdom
1UCL Great Ormond Street Institute of Child Health, London, United Kingdom, 2National Physical Laboratory, Teddington, United Kingdom
Synopsis
Tractography is regularly used in neuroscientific research and neurosurgical planning for its ability to delineate fibre bundles non-invasively. The construction and analysis of tractograms often requires user-defined parameter choices such as streamline density thresholding for estimating tract volume. In this study, we assessed the reproducibility of a manual tractography pipeline that is applied in neurosurgical planning for oncology and epilepsy operations, and quantified the effect of streamline density thresholding on reproducibility. The pipeline was found to be robust in terms of reproducibility over the range of investigated thresholding levels with some variability between tracts.
Introduction
Tractography is regularly used in neuroscientific research and is widely used for pre-neurosurgical planning for oncology and epilepsy patients1–3. However, tractography is known to suffer from reliability issues4,5. Most tractography pipelines require user-defined parameter choices whose effect on reproducibility of the output have not been thoroughly studied. Here, we quantified the intra- and inter-subject variability of three surgically relevant white matter tractographic reconstructions: arcuate fasciculus (AF), corticospinal tract (CST), and optic radiation (OR). Additionally, we quantified the effect of streamline density threshold level on the reproducibility of these tracts.Methods
Imaging experiments9 healthy volunteers were scanned and rescanned 2 weeks later using the same protocol. Data was acquired using a Siemens Magnetom Prisma 3T scanner with a maximum gradient strength of 80 mT/m and a 64-channel quadrature head coil (Siemens Healthcare, Erlangen, Germany). An echo-planar multiband diffusion-weighted sequence with the following acquisition parameters was used: Δ = 28.7 ms; δ = 28.7 ms; b-values = 1000 and 2200 s/mm2; 60 diffusion-weighting gradient directions distributed uniformly over a sphere for both b-values; TE = 60 ms; TR = 3050 ms; FOV = 220x220 mm; flip angle = 90°; isotropic resolution = 2x2x2 mm3; 66 slices. Pre-processing steps include correction of susceptibility and eddy current induced distortions using FSL’s topup and eddy algorithms6.
Tractography
Tractograms of the AF, CST, and OR were performed using MRtrix37 using multi-shell multi-tissue constrained spherical deconvolution8. Seeds, target regions, and inclusion/exclusion criteria were defined in their appropriate positions based on anatomical landmarks (Figure 1). The resulting tractograms were confirmed by an experienced neurosurgeon. 5 million seeds were used per tract and the final tractograms contained 5000 streamlines each. Tract volumes were calculated from sets of streamlines by streamline density thresholding. Using the default pipeline (Figure 1), the streamline density threshold was set at 20 streamlines per voxel based on visual inspection of how well the tract volume resembles prior neuroanatomical knowledge. To quantify the effect of streamline density threshold on tract reproducibility, the density threshold was varied from 0 to 250 in 26 uniformly distributed steps.
Registration
Scan-rescan tractograms were registered into halfway space per subject by applying NiftyReg9 on b=0 images. The registration results were further fine-tuned by maximising the mutual information content of b=0 images with affine registration in DiPy10.
Reproducibility analysis
Tractogram reproducibility was assessed using the Dice similarity coefficient (DSC)11,12 to quantify the overlap between scan (A) and rescan (B) tract segmentation:
$$DSC = \frac{2\mid{A\cap{B}\mid}}{\mid{A\mid}+{\mid{B}\mid}}$$
Tract volume reproducibility was assessed using the coefficient of variation (COV):
$$COV = \frac{\sigma}{\mu}$$
where σ and μ represents the intra-subject standard deviation and population mean, respectively. Intraclass correlation coefficient (ICC)13 was employed to compare the inter-subject variability to intra-subject variability in tract volume:
$$ICC = \frac{MSS_{{inter}}-{MSS_{intra}}}{MSS_{{inter}}+{(n-1)}{MSS_{intra}}}$$
where MSSinter and MSSintra represents inter-subject mean sum of squares and intra-subject mean sum of squares, respectively, and n is the number of scans per subject.
Results
Default pipelineFigure 2 illustrates tract volumes of each tract in a representative subject’s scan-rescan data. DSC scores for each tract are presented in Table 1. The mean DSC scores were 0.772±0.129 (left AF), 0.771±0.084 (right AF), 0.829±0.049 (left CST), 0.832±0.063 (right CST), 0.764±0.134 (left OR), and 0.786±0.057 (right OR). The average intra-subject COV values were: 0.039±0.067 (left AF), 0.047±0.056 (right AF), 0.035±0.018 (left CST), 0.015±0.011 (right CST), 0.082±0.063 (left OR), and 0.043±0.023 (right OR).
The effect of density thresholding on reproducibility
Figure 3 shows the tract volume reproducibility measures over a range of streamline density thresholds. Tract volume (Figure 3A) is highly sensitive to the streamline density threshold particularly at lower threshold values. Very low thresholds (<0.3%) resulted in unrealistically high tract volumes. The DSC scores (Figure 3B) for all investigated tracts diminish as tract volume decreases by increasing the threshold. With ICC (Figure 3C) and COV (Figure 3D), the tracts do not follow a similar trend and there is large variability between tracts.
Discussion
The high DSC scores suggest that the tractography pipeline is reproducible in healthy subjects. However, the DSC scores are dependent on the thresholding level. The high ICC and low COV values suggest that tract volume can be used to measure subject-specific information reproducibly. These results concur with existing studies’ findings14.Many tractography users select streamline density threshold values through trial and error due to unknown ground truth. To make tractography more clinically beneficial, tractographic reconstructions must be as complete as possible to closely resemble the actual tract. Unreasonably high thresholds will result in unrealistically small, narrow reconstructions, which might impose a higher risk of inadvertent tract injury if the neurosurgeon(s) relied on the reconstruction.
Reproducibility measures showed the pipeline to be robust over the range of thresholds. An optimum threshold level was not defined due to high variability between tracts and variance along the curve for individual tracts. This can be investigated in future work.
Conclusion
The clinically relevant tractography pipeline is reproducible over the range of density thresholds studied. Our results suggest that different tracts or hemispheres have different optimum streamline density thresholds.Acknowledgements
This work is funded by National Physical Laboratory and the NIHR GOSH BRC. The views expressed are those of the authors and not necessarily those of the NHS, the NIHR or the Department of Health.References
- Mori, S., Crain, B. J., Chacko, V. P. & van Zijl, P. C. M. Three-Dimensional Tracking of Axonal Projections in the Brain by Magnetic Resonance Imaging. Annals of Neurology. 45, 247–269 (1999).
- Johansen-Berg, H. & Behrens, T. E. J. Just pretty pictures? What diffusion tractography can add in clinical neuroscience. Current Opinion in Neurology. 19, 379–385 (2006).
- Essayed, W. I. et al. White matter tractography for neurosurgical planning: A topography-based review of the current state of the art. NeuroImage: Clinical. 15, 659–672 (2017).
- Catani, M. From hodology to function. Brain. 130, 602–605 (2007).
- Jbabdi, S. & Johansen-Berg, H. Tractography: Where Do We Go from Here? Brain Connectivity. 1, 169–183 (2011).
- Alexander, D. C., Barker, G. J. & Arridge, S. R. Detection and modeling of non-Gaussian apparent diffusion coefficient profiles in human brain data. Magnetic Resonance in Medicine. 48, 331–340 (2002).
- Tournier, J.-D. et al. MRtrix3: A fast, flexible and open software framework for medical image processing and visualisation. NeuroImage. 202, 116137 (2019).
- Jeurissen, B., Tournier, J. D., Dhollander, T., Connelly, A. & Sijbers, J. Multi-tissue constrained spherical deconvolution for improved analysis of multi-shell diffusion MRI data. NeuroImage. 103, 411–426 (2014).
- Modat, M. et al. Fast free-form deformation using graphics processing units. Computer Methods and Programs in Biomedicine. 98, 278–284 (2010).
- Garyfallidis, E. et al. Dipy, a library for the analysis of diffusion MRI data. Frontiers in Neuroinformatics. 8, 1–17 (2014).
- Dice, L. Measures of the amount of ecologic association between species. Ecology. 26, 207–302 (1945).
- Zou, K. H. et al. Statistical Validation of Image Segmentation Quality Based on a Spatial Overlap Index. Academic Radiology. 11, 178–189 (2004).
- Shrout, P. E. & Fleiss, J. L. Intraclass correlations: Uses in assessing rater reliability. Psychological Bulletin. 86, 420–428 (1979).
- Besseling, R. M. H. et al. Tract specific reproducibility of tractography based morphology and diffusion metrics. PLoS One. 7, 1–10 (2012).
Figures

Figure 1: Manual tractography pipeline used for delineating the CST, AF, and OR of 9 healthy volunteers. After fitting constrained CSD to the diffusion-weighted data, the regions of interest (ROI) were manually drawn as depicted on the colour-encoded diffusion tensor eigenvector map (1). Seeds, target regions, and inclusion/exclusion criteria (1,3) were defined in their appropriate positions based on anatomical landmarks. To convert the tractograms from sets of streamlines (4) into binary voxel maps, tract volumes (5) were calculated by thresholding based on voxel density.
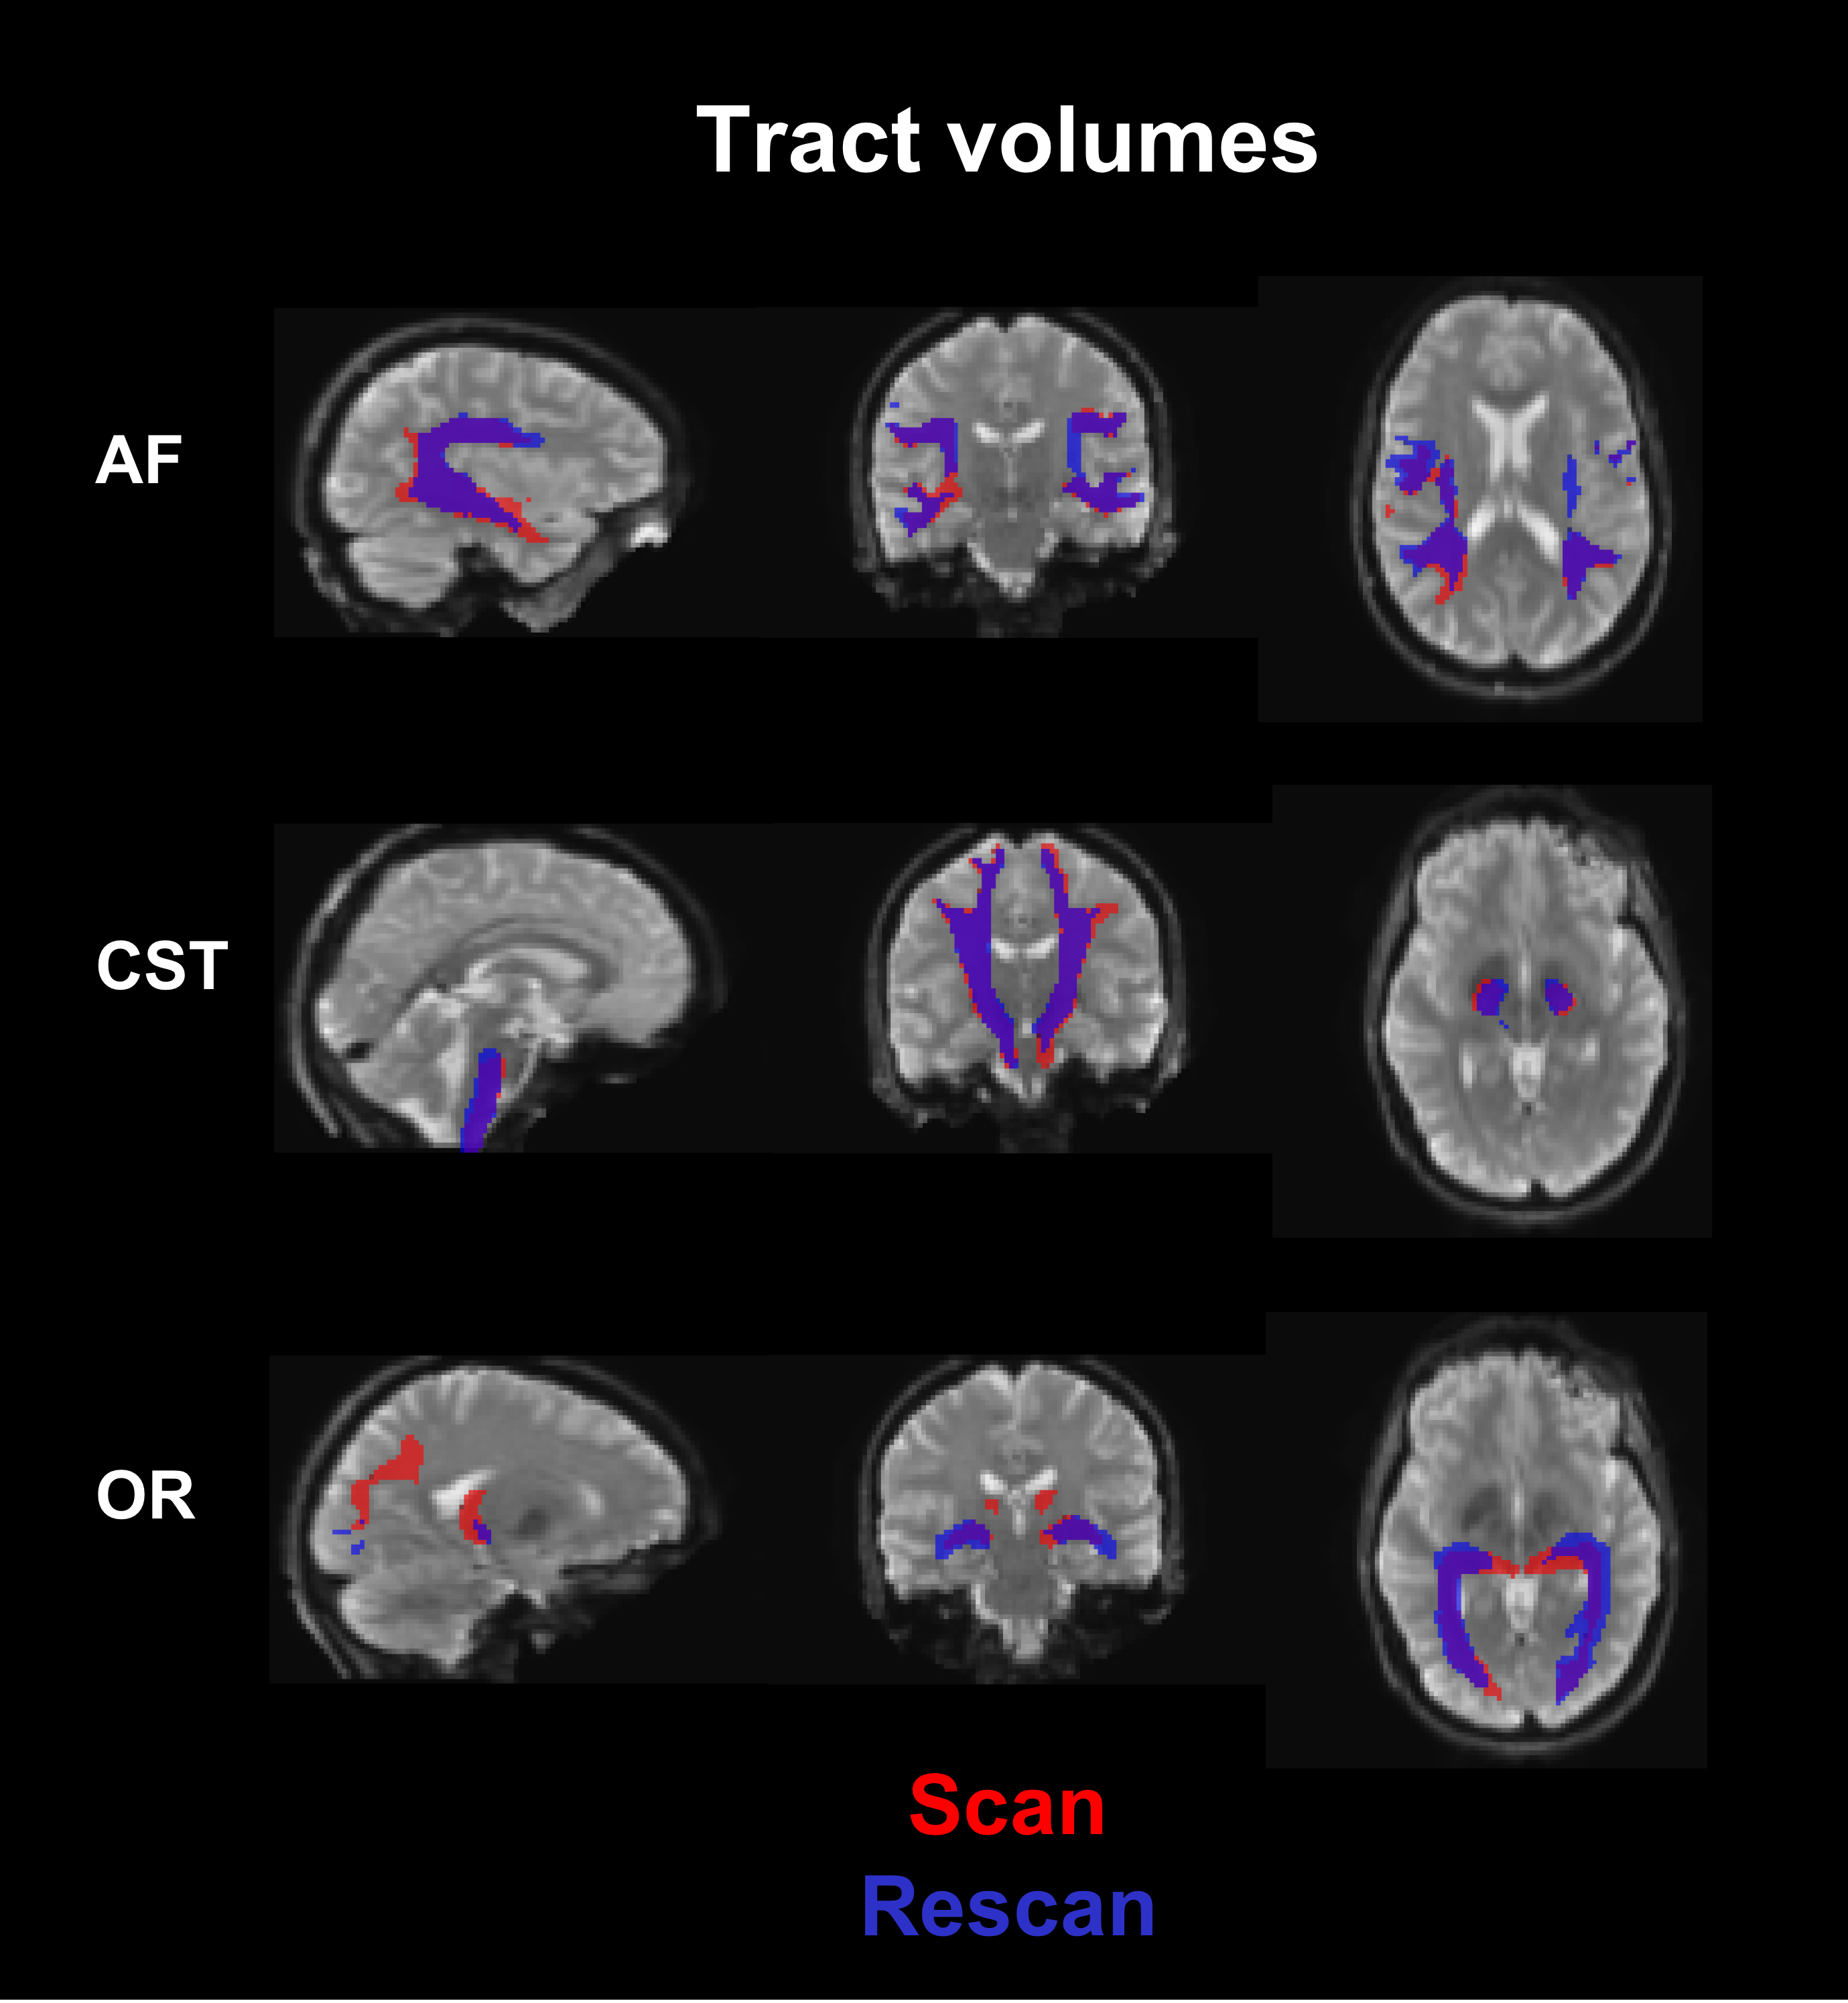
Figure 2: Example of scan-rescan tract volumes in a representative subject using the default pipeline. Sagittal (left), coronal (middle), and axial (right) views of the brain and the tracts are shown with the scan and rescan tracts in red and blue, respectively.
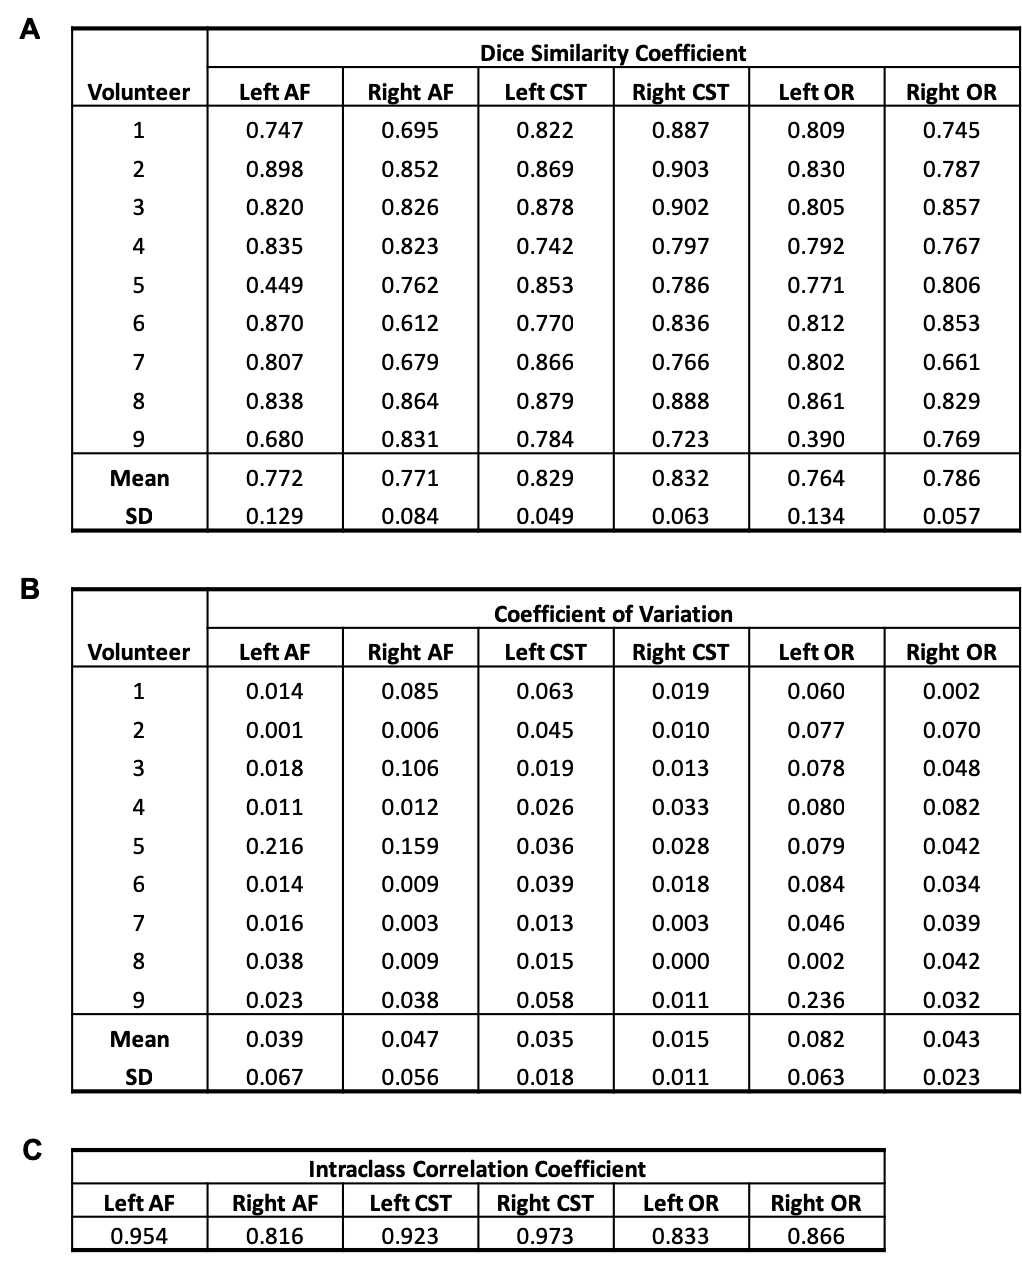
Table 1: Tract reproducibility measures using the default manual tractography pipeline: dice similarity coefficient (A), coefficient of variation (B) and intraclass correlation coefficient (C).
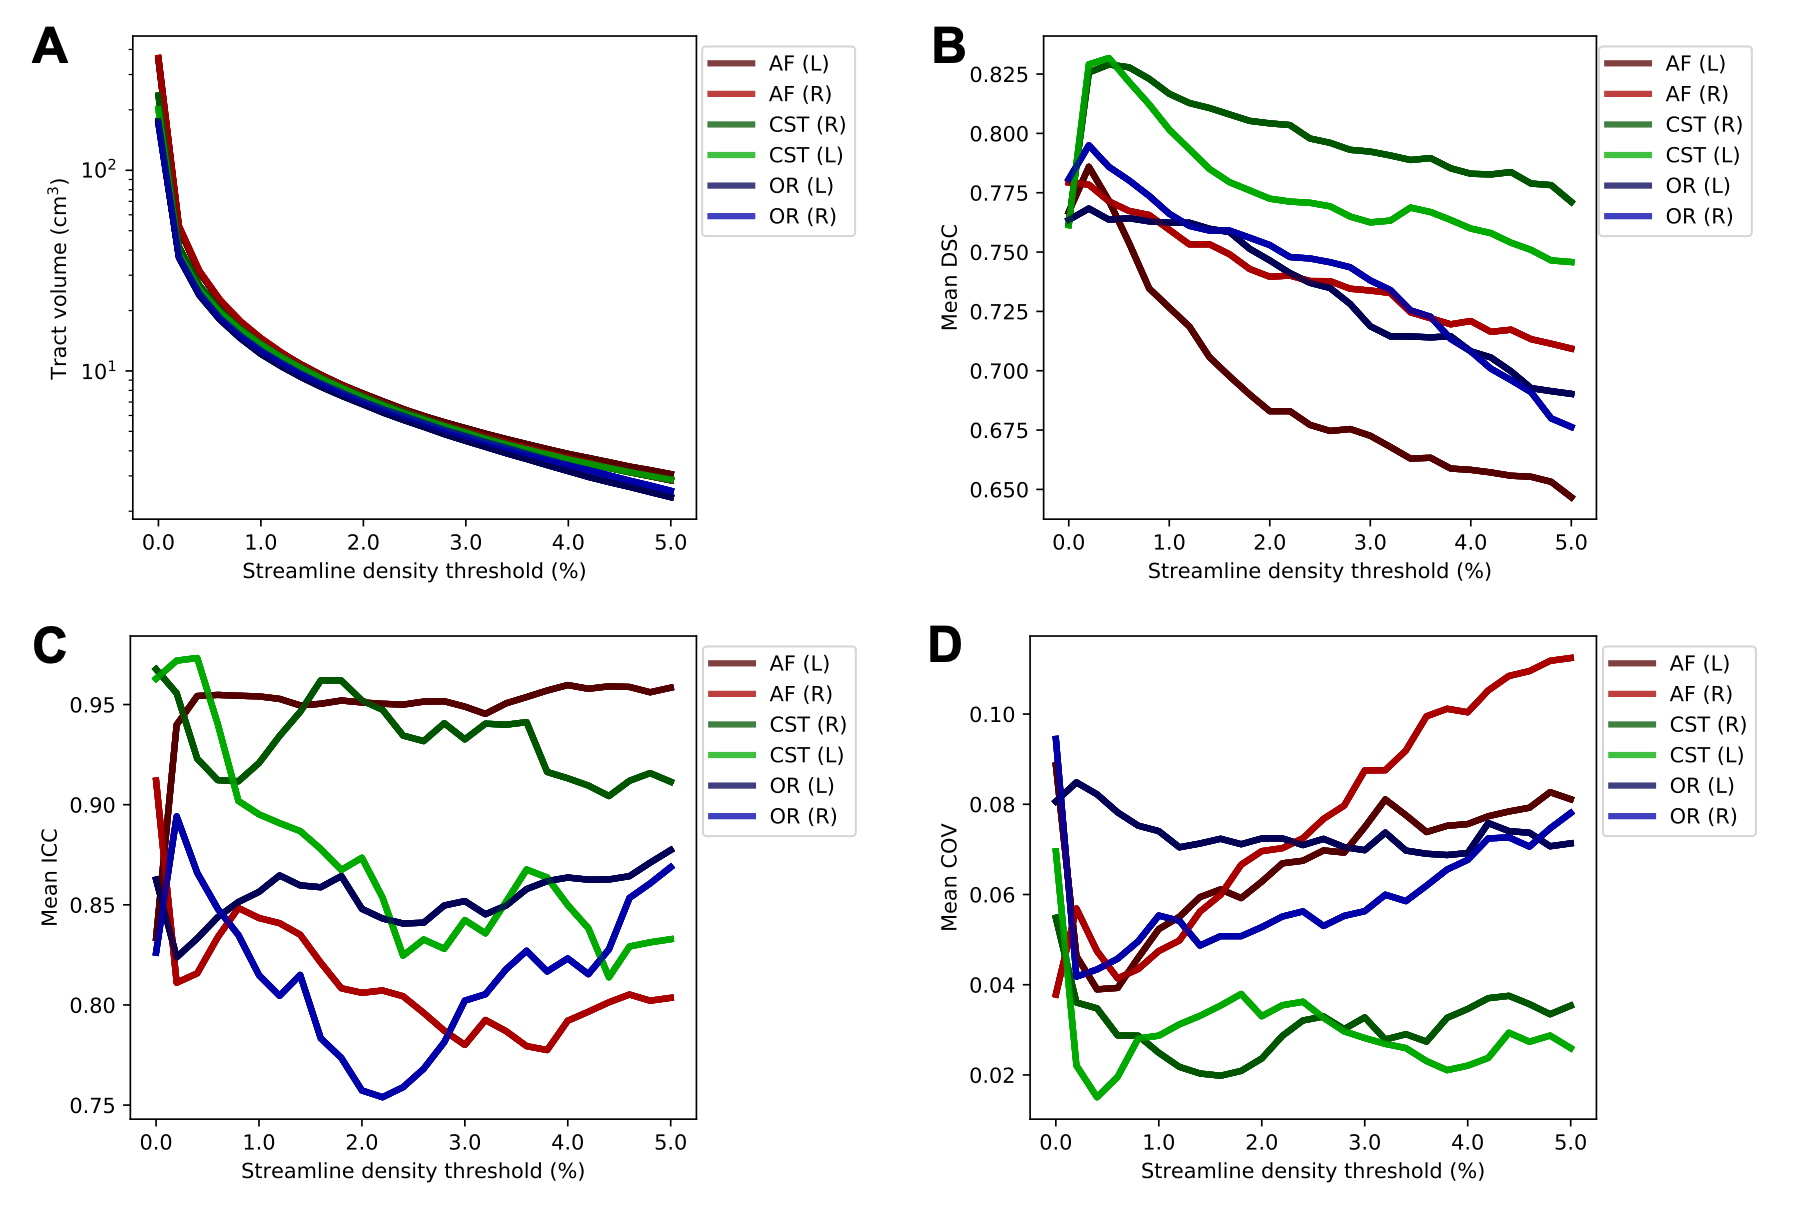
Figure 3: Effect of streamline density thresholding on reproducibility measures. The mean values of tract volume (A), dice similarity coefficient (DSC) (B), intraclass correlation coefficient (ICC) (C), and coefficient of variation (COV) (D) over subjects at different levels of streamline density thresholding. The streamline density threshold is given as the percentage of the total number of streamlines in the tractograms, which is 5000. The default pipeline threshold is at 0.4%.