4487
Does introduction of priors improve reliability to segment hyperdirect connections using tractography for Deep Brain Stimulation ?1UMR 1099 LTSI, RENNES, France
Synopsis
A better knowledge of subthalamic nucleus connections could help predict the clinical outcome of deep brain stimulation in the context of Parkinson’s disease. However, diffusion weighted images used in clinical context are generally of poor resolution. In this study, we compared a whole brain versus an a-priori-based tractography method in order to segment hyperdirect connections linking subthalamic nucleus to cortex on normal controls acquired in clinical context. In systematically comparing our hyperdirect connections segmentation results with high resolution data set, we showed better reliability when using the a-priori-based tractography compared to the whole-brain method.
INTRODUCTION
A better knowledge of SubThalamic Nucleus (STN) connections could help predict1,2 the clinical outcome of Deep Brain Stimulation (DBS) in the context of Parkinson’s Disease (PD). DBS is supposed 1) to decrease the synchronization oscillatory activity between STN and cortex in PD through modulation of its hyperdirect connections3,4 and 2) to activate axons preferentially over cell bodies5. However, hyperdirect connections of the STN remain difficult to segment using tractography mainly because they link a deep nucleus with large cortical areas which make overlap between different results challenging6. Moreover, Diffusion Weighted Images (DWI) used in clinical context are generally of poor resolution. In this study, we compared two different tractography methods (one with7 and one without8 anatomical and orientational priors) in order to segment hyperdirect connections on Normal Controls (NC) from the Parkinson Progression Marker Initiative9 (PPMI) data base.MATERIAL AND METHODS
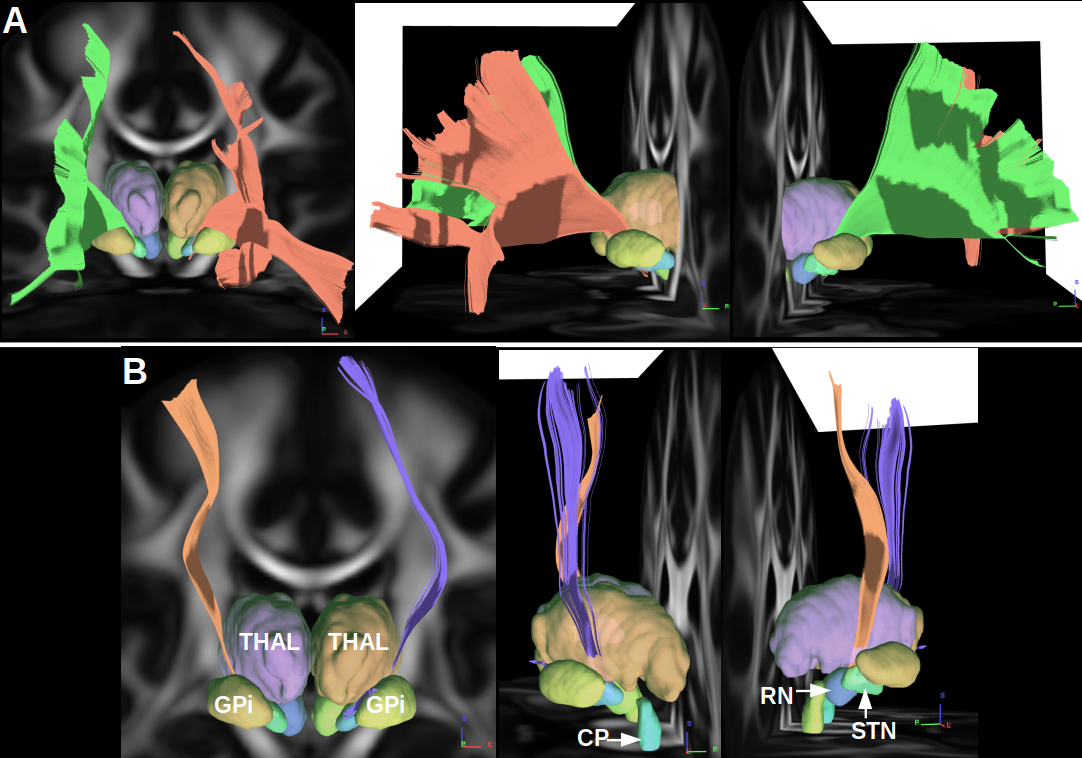
High resolution data setHyperdirect connections linking sensori-motor and associative cortex were segmented using a group average computed from a total of 1021 data sets acquired on healthy subjects from the Human Connectome Project10. A deterministic tractography11 (angular threshold 80) was initiated from 50 millions of random seeds located within the internal capsule. Four exclusion masks were defined thanks to the DISTAL atlas12 : Globus Pallidum internus (GPi), Red Nucleus (RN), Cerebral Peduncle (CP), THALamus (THAL). Last, sensori-motor, associative and limbic cortical masks were defined as targets while the other two were used as exclusion masks using the Automated Anatomical Labeling (AAL) atlas13.
Whole brain and a-priori-based tractography methods used on PPMI data base
31 acquisitions of NC from the PPMI database were included on this study. PPMI DWI were acquired on 3 Tesla MRI (2 mm3 resolution) along 64 directions using a b-value of 1000 s/mm2 and a single b=0 image. T1 images (1 mm3 resolution) were also acquired.
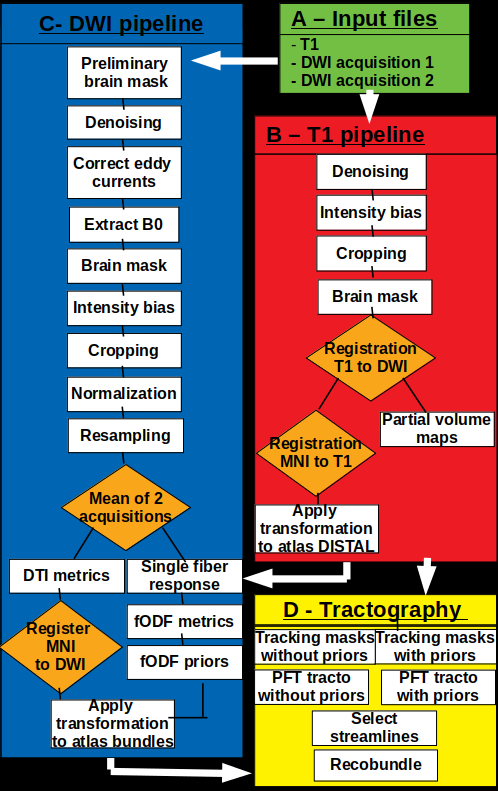
In order to define some masks for tractography such as partial volume maps, preprocessed (denoising, intensity bias correction) T1 images were non-linearly registered into the diffusion space using the b=0 image resampled to 1 mm (see Fig. 1). Then, the same inclusion (STN, sensori-motor, associative) and exclusion masks (GPi, RN, PC, THAL) as those defined in the high-resolution data set were computed via non-linear geometric registration of the DISTAL and AAL atlases into the diffusion space.
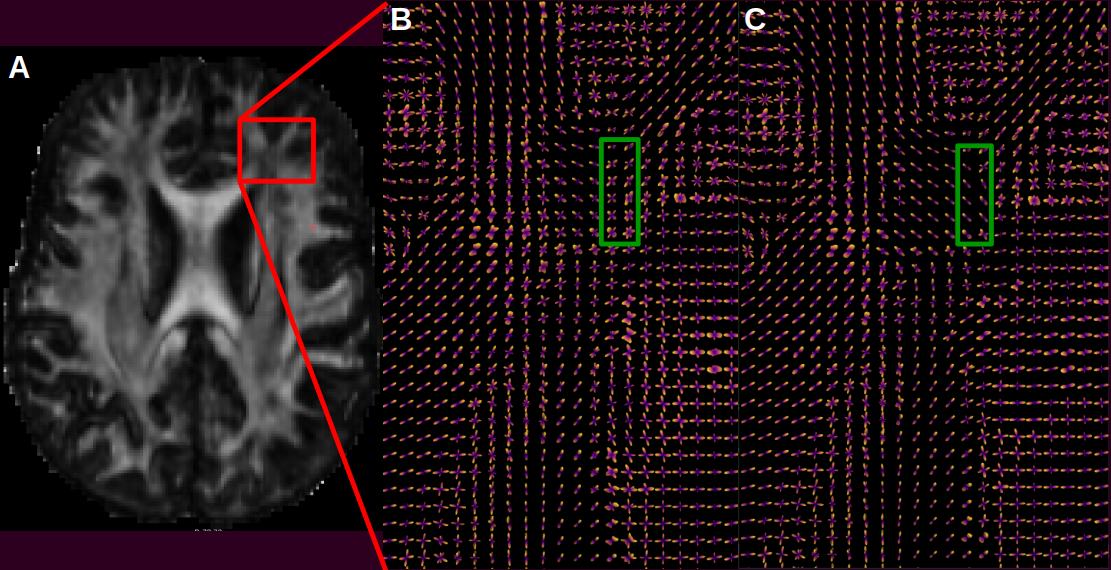
After preprocessing of DWI (denoising, correction of eddy currents, intensity bias, resampling to 1mm, average of two acquisitions), the Fiber Orientation Distribution (FOD) was computed using constrained spherical deconvolution (Descoteaux’s basis harmonics of order 8). Then, hyperdirect connections assessed using the high-resolution data set were linearly registered into diffusion space in order to introduce priors in modulating the FOD using tracts orientation distribution. This modified FOD map was denoted e-FOD following the method of Rheault et al.7
Based on the already computed FOD map, inclusion, and exclusion masks, a whole brain probabilistic tractography was initiated from 5 seeds located in each white matter8 voxel.
An a-priori-based probabilistic tractography method grounded on e-FOD was achieved using 5 seeds in each voxel located within a bundle specific seeding mask7,8.
For both tractography methods, segmentation of hyperdirect connections was achieved first in selecting streamlines passing between STN and associative or sensori-motor cortical masks, then in using the recobundle15 tool between selected streamlines and hyperdirect segmentation achieved on high-resolution data set.
Whole brain versus a priori-based tractography methods
For each type of hyperdirect segmentation, weighted-Dice6 (wDice) values were computed between segmentations achieved on PPMI and high-resolution data set. A paired Wilcoxon test was used in order to compare the wDICE values obtained between both tractography methods.
RESULTS
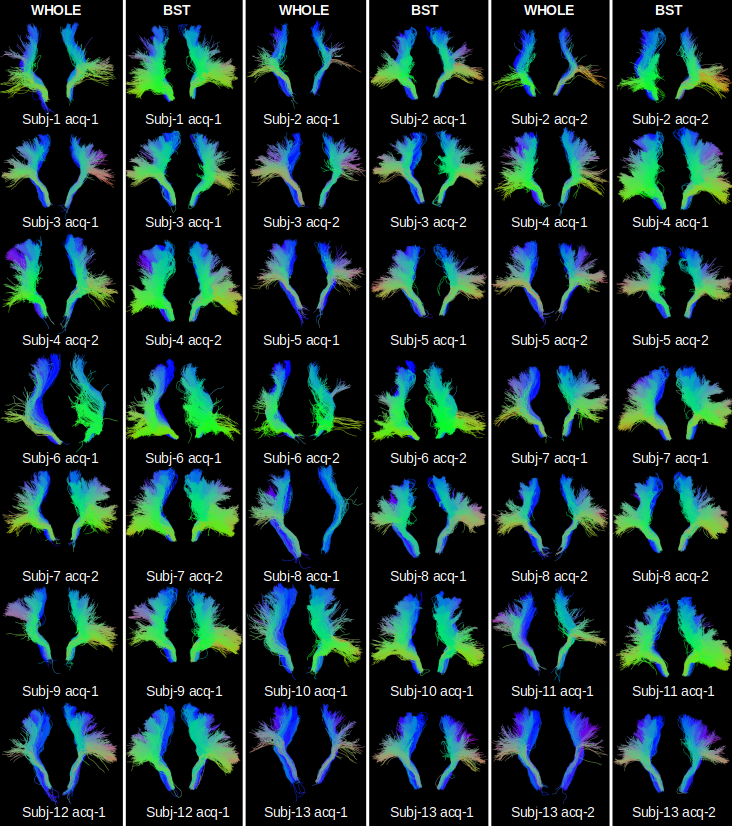
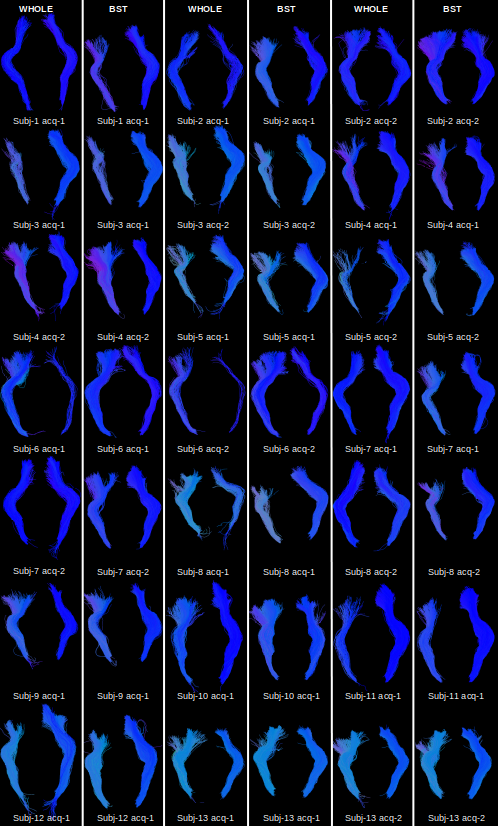
Hyperdirect connections linking associative and sensori-motor cortex achieved using the high-resolution data set are presented in Fig. 2. In Fig.3, FOD and eFOD maps are represented on an axial slice near the genu of the corpus callosum. Fig. 4 and 5 show frontal views of hyperdirect connections segmented using whole brain and a-priori-based tractography methods. Averaged wDice values were used as a measure of reliability for connections linking STN to left (Mean=0.24, std=0.11 for whole. Mean=0.34, std=0.10 for a-priori-based tractography) and right (Mean=0.29, std=0.14 for whole. Mean=0.41, std=0.09 for a-priori-based tractography) sensori-motor cortex and linking STN to left (Mean=0.37, std=0.14 for whole. Mean=0.55, std=0.13 for a-priori-based tractography) and right (Mean=0.44, std=0.12 for whole. Mean=0.58, std=0.12 for a-priori-based tractography) associative cortex. The difference in accuracy between tractography methods is statistically significant according to the Wilcoxon test.DISCUSSION
Discrepancies between basal ganglia connections results achieved using the same tractography method but on different acquisitions of the same patient from the PPMI data base have also been reported in the Cousineau et al. paper6. The importance of the associative cortex in STN-DBS has been corroborated by different papers13,14.CONCLUSION
Given a ground truth set of streamlines achieved on high-resolution data set, our results revealed that introduction of anatomical and orientational priors on clinical data set lead to a more reliable segmentation of the hyperdirect connections compared to whole brain tractography. Further studies are needed to extend this result to other connections and tractography implementations.Acknowledgements
Authors are very grateful to François Rheault for the important support provided to compute priors in DWI using the method described in Rheault et al. 2019.References
[1] Akram et al. Subthalamic deep brain stimulation sweet spots and hyperdirect cortical connectivity in Parkinson's disease. NeuroImage, 2017, 158, 332-345.
[2] Horn et al. Connectivity Predicts deep brain stimulation outcome in Parkinson disease. Annals of neurology, 2017, 82, 67-78.
[3] Nambu et al. Functional significance of the cortico--subthalamo--pallidal ‘hyperdirect’pathway Neuroscience research, Elsevier, 2002, 43, 111-117.
[4] Whitmer et al. High frequency deep brain stimulation attenuates subthalamic and cortical rhythms in Parkinson's disease Frontiers in human neuroscience, Frontiers, 2012, 6, 155.
[5] McIntyre et al. Electric field and stimulating influence generated by deep brain stimulation of the subthalamic nucleus. Clinical neurophysiology : official journal of the International Federation of Clinical Neurophysiology, 2004, 115, 589-595.
[6] Cousineau, et al., A test-retest study on Parkinson's PPMI dataset yields statistically significant white matter fascicles. NeuroImage. Clinical, 2017, 16, 222-233.
[7] Rheault et al. Bundle-specific tractography with incorporated anatomical and orientational priors. NeuroImage, 2019, 186, 382-398.
[8] Girard et al. Towards quantitative connectivity analysis: reducing tractography biases. NeuroImage, 2014, 98, 266-278.
[9] Marek et al. The parkinson progression marker initiative (PPMI) Progress in neurobiology, Elsevier, 2011, 95, 629-635.
[10] Yeh et al. Population-averaged atlas of the macroscale human structural connectome and its network topology. NeuroImage, 2018, 178, 57-68
[11] Ewert et al. Toward defining deep brain stimulation targets in MNI space: A subcortical atlas based on multimodal MRI, histology and structural connectivity. NeuroImage, 2018, 170, 271-282.
[12] Tzourio-Mazoyer et al. Automated anatomical labeling of activations in SPM using a macroscopic anatomical parcellation of the MNI MRI single-subject brain. NeuroImage, 2002, 15, 273-289.
[13] Vanegas-Arroyave et al. Tractography patterns of subthalamic nucleus deep brain stimulation. Brain : a journal of neurology, 2016, 139, 1200-1210.
[14] Son et al. Imaging analysis of Parkinson's disease patients using SPECT and tractography. Scientific reports, 2016, 6, 38070.
[15] Garyfallidis et al. Recognition of white matter bundles using local and global streamline-based registration and clustering. NeuroImage, 2018, 170, 283-295.
Figures