4484
Aligning Shapes of Along-tract Diffusion Profiles across Populations1UCLA, Los Angeles, CA, United States
Synopsis
Various tools exist to extract diffusion measures from tract profiles. However, they lack the precision in terms of statistical analysis since the tract shapes are registered to a common template. Although this analysis leads to meaningful results, we postulate that there is a significant geometric information in the along-tract diffusion profiles that is unaccounted for. Here we propose a novel method for aligning shapes of diffusion profiles across populations. This method offers improved matching and statistical analysis of along-tract diffusion profiles. Furthermore, this method could be used to perform multivariate statistical analysis of along-tract diffusion profiles in an invariant manner.
Introduction
There exist several robust tools for extracting diffusion measures along tract profiles, also referred to as along-tract diffusion profiles [1,2,3,4]. However, tools for statistical analysis of such diffusion profiles are lacking. Currently researchers assume that once the tract shapes are themselves registered, one can directly use the along-tract diffusion profiles in statistical analysis. This is a valid assumption since the brains are preregistered to an atlas to account for spatial differences between subjects before computing such measures. While this analysis leads to meaningful statistical results that quantify differences between tract profiles, we postulate that there is rich geometric information in the along-tract diffusion profiles itself, and that a shape analysis of the diffusion profiles itself may also lead to novel findings. Thus, focusing on the functional shape of the diffusion profile, we propose a new method for aligning shapes of diffusion profiles across populations. This method is inspired by ideas from shape analysis and provides tools for representation, matching, and eventually statistical analysis of along-tract diffusion profiles. For the current abstract, we propose the data representation scheme and show results from aligning tract-profiles. Our final goal is to perform multivariate statistical analysis of along-tract diffusion profiles in an invariant manner.Methods
Diffusion weighted images were acquired on a 3T Prisma at UCLA with a 32-channel head coil using a multishell spin-echo echo-planar sequence with 92 directions per shell, 14 b0 reference images, acquired twice in each of the AP/PA directions over at total of 22min, 40sec (TR/TE=3230ms/89.2ms, b=1500,3000s/mm2, voxel size=1.5mm3, MB accel. factor=4). A multiecho T1w MPRAGE was also acquired (TR/TE=2500ms/1.81,1.79,7.18ms,, TI=1000ms, voxel size=0.8mm3, FA=8o for registration. Data were processed using the HCP minimal preprocessing pipeline [6], which includes EPI distortion correction using FSL’s topup tool [7], eddy current correction using FSL’s eddy tool (8), and finally registration to the structural image as well as the MNI152 mean template. Further processing was done using mrtrix3 [9], which uses constrained spherical deconvolution to represent fiber orientations, allowing for whole-brain deterministic tractography to be performed. 10 million fiber tracts were computed for each subject to be used for automated fiber quantification (AFQ). The AFQ pipeline [3] first uses the tractography maps previously computed to segment out 20 tracts per subject, and uses automated tools and a white matter atlas for tract delineation and cleaning spurious fibers.We then use the AFQ method for generating summary measures of diffusion measurements along the length of fiber tracts. For a set of $$$K$$$ fiber bundles (AFQ diffusion profiles), we discretize the along-tract diffusion profile into $$$T-1$$$ intervals. For a single subject, we represent this set of $$$K$$$ fiber bundles with $$$T$$$ points along the profiles by a matrix configuration as $$$F = \{ (f_1, \ldots,$$$ $$$ f_i, \ldots, f_k)\}$$$, where each $$$f_i \in \mathbb{R}^T$$$ is a column vector. This matrix $$$F \in \mathbb{R}^{T \times K}$$$ is our representation of the along-tract diffusion profiles per subject. Now, given such diffusion profile configurations ($$$F_1$$$ and $$$F_2$$$) for a pair of subjects, our goal is to align them so the geometric shape information in the diffusion profiles can be matched. Before alignment, we perform a global centering by $$${F_1}_c = (I_k - \frac{1}{T}^{tr}) F_1$$$, where $$${tr}$$$ represents a matrix transpose. Scaling is performed by $$${F_1}^s_c = \frac { {F_1}_c } { ||{F_1}_c||}$$$, where $$$|| \cdot ||$$$ is the Frobenius norm. Then we align the centered and scaled diffusion profile configurations $$$F_1$$$ and $$$F_2$$$ by solving for the exact rotation $$$\hat{\Gamma}$$$ by minimizing the sum squared error as $$$\hat{\Gamma} =$$$ argmin $$${_\Gamma} || X_1 - X_2 \Gamma ||^2$$$, where $$$\Gamma \in SO(n)$$$ is an element of the special orthogonal group. The solution to this problem can be estimated, even in noisy data using the SVD [5].
Results
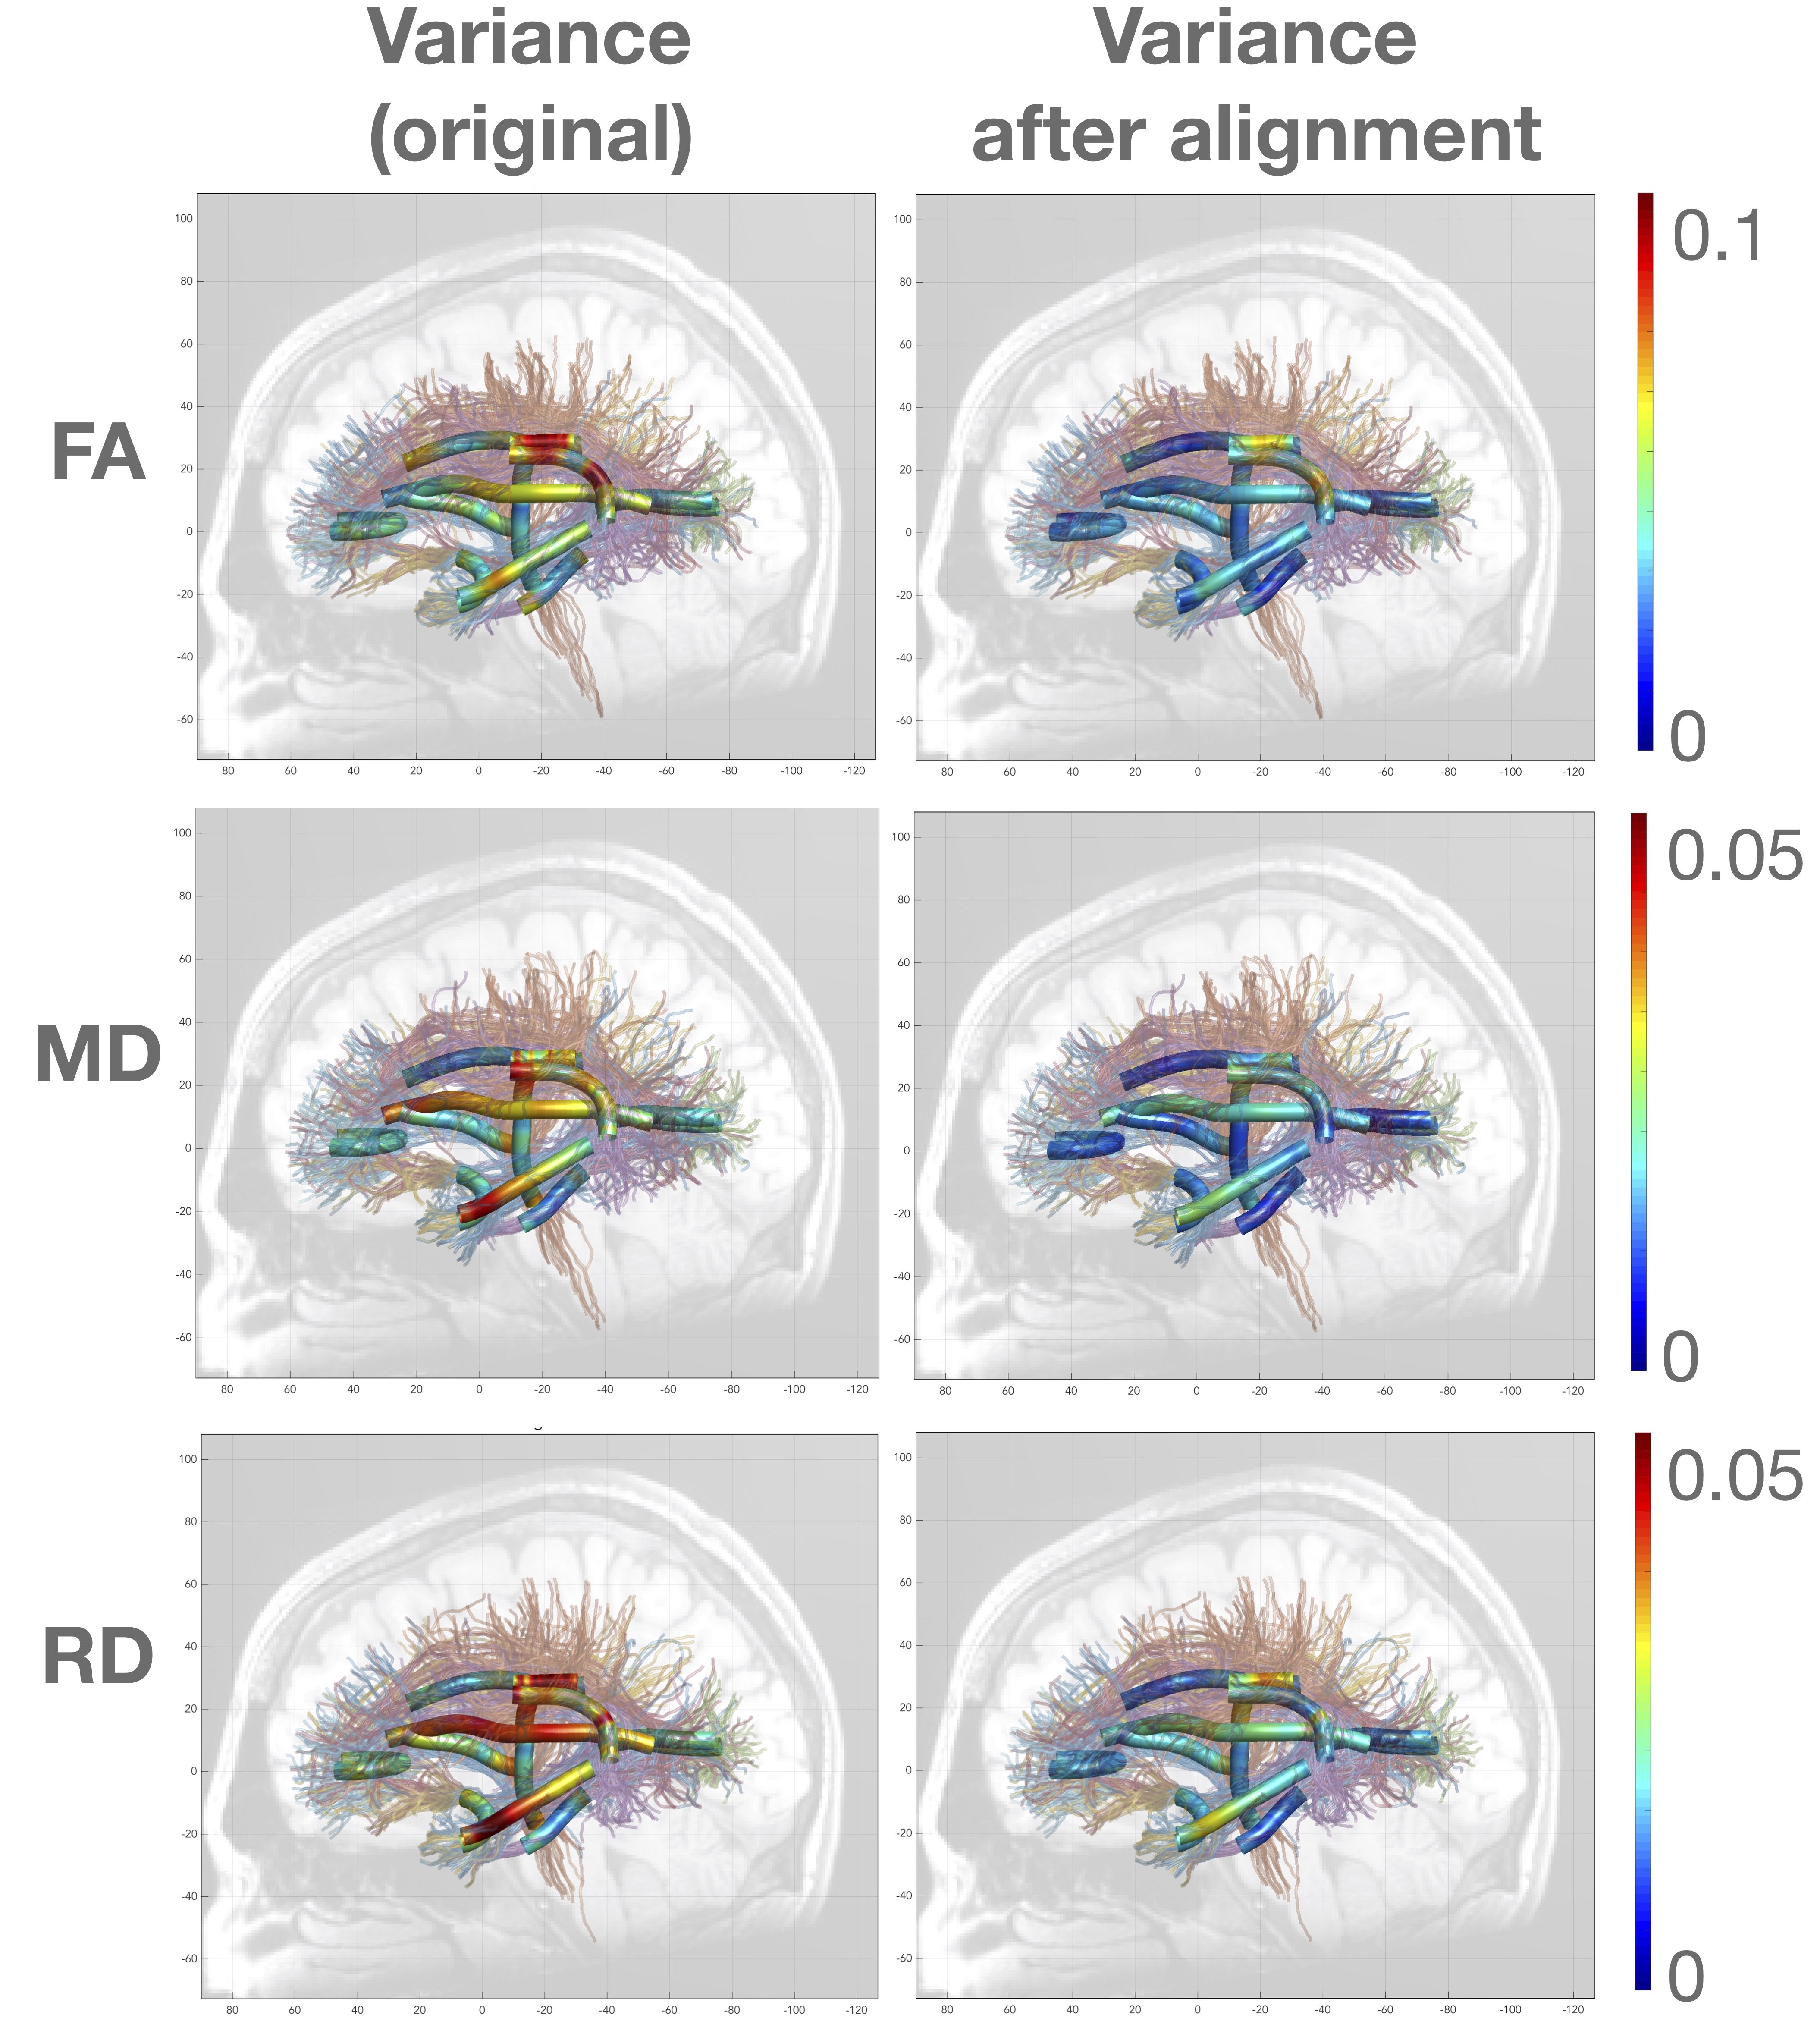
Figure 1 shows diffusion profiles for fractional anisotropy and radial diffusivity for the left cingulum hippocampus. From Figure 2, it is observed that there is a reduction in variance for the along-tract diffusion profiles after alignment. It is observed that the population profiles visually appear to be registered. It is also observed that after alignment, one can see distinct structural variations along the diffusion profiles. This shows that the alignment is responsible for emphasizing important features in the diffusion profiles.Discussion
While we used rotational alignment in this abstract, in the future, one could implement complex metrics that highlight and capture distinct shape profiles of the diffusional measures. This will be the subject of future work.Conclusion
Shape analysis of tract profiles significantly reduces the variance of diffusion measures and thus improves the matching of diffusion profiles across populationsAcknowledgements
This research was supported by the NIH/NIAAA award K25AA024192. Data acquisition and preprocessing was supported by NIH/NIMH (Grant Nos. MH110008 [to KLN and RE], and MH102743 [to KLN]).
References
[1] Yendiki, A. et al. Automated probabilistic reconstruction of white-matter pathways in health and disease using an atlas of the underlying anatomy. Front. Neuroinform. 5, 23 (2011).
[2] T.E.J. Behrens, H. Johansen-Berg, S. Jbabdi, M.F.S. Rushworth, and M.W. Woolrich. Probabilistic diffusion tractography with multiple fibre orientations. What can we gain? NeuroImage, 23:144-155, 2007.
[3] Jason D Yeatman, Robert F Dougherty, Nathaniel J Myall, Brian A Wandell, Heidi M Feldman, “Tract profiles of white matter properties: automating fiber-tract quantification”, PloS One, 7: e49790.
[4] Yeatman, J.D., Richie-Halford, A., Smith, J.K. et al. A browser-based tool for visualization and analysis of diffusion MRI data. Nat Commun 9, 940 (2018) doi:10.1038/s41467-018-03297-7.
[5] Goryn D. and S. Hein. On the estimation of rigid body rotation from noisy data. IEEE Transactions on Pattern Analysis and Machine Intelligence, 17(12):1219– 1220, 1995.
[6] Glasser, M. F., Sotiropoulos, S. N., Wilson, J. A., Coalson, T. S., Fischl, B., Andersson, J. L., … WU-Minn HCP Consortium (2013). The minimal preprocessing pipelines for the Human Connectome Project. NeuroImage, 80, 105–124. doi:10.1016/j.neuroimage.2013.04.127
[7] J.L.R. Andersson, S. Skare, J. Ashburner. How to correct susceptibility distortions in spin-echo echo-planar images: application to diffusion tensor imaging. NeuroImage, 20(2):870-888, 2003.
[8] Jesper L. R. Andersson and Stamatios N. Sotiropoulos. An integrated approach to correction for off-resonance effects and subject movement in diffusion MR imaging. NeuroImage, 125:1063-1078, 2016.
[9] J.-D. Tournier, R. E. Smith, D. Raffelt, R. Tabbara, T. Dhollander, M. Pietsch, D. Christiaens, B. Jeurissen, C.-H. Yeh, and A. Connelly. MRtrix3: A fast, flexible and open software framework for medical image processing and visualisation. NeuroImage, 202 (2019), pp. 116–37.
Figures