4483
Quantitative assessment of multi-scale tractography: bridging the resolution gap with 3D-Polarized Light Imaging1Athena Project-Team, Inria Sophia Antipolis Méditerranée, Université Côte d'Azur, Sophia Antipolis, France
Synopsis
Three-dimensional Polarized Light Imaging (3D-PLI) is an optical technique presented as a good candidate for validation of diffusion Magnetic Resonance Imaging (dMRI) results such as orientation estimates and tractography. We previously demonstrated a multi-scale tractography approach using 3D-PLI. Here, we show how tractograms obtained at different spatial scales from 3D-PLI human brain datasets can be inspected using homology theory in order to perform a quantitative comparison between them. This paves the way for the validation of tractography obtained from dMRI using multi-scale fiber tracking based on 3D-PLI.
Introduction
Three-dimensional Polarized Light Imaging (3D-PLI) has been investigated as an adequate tool1-4 for the validation of dMRI-based fiber orientation estimation and tractography. 3D-PLI is an optical imaging technique which gives high-resolution fiber orientation measurements at micrometer scale. Previously, we showed an approach to close the resolution gap between dMRI and 3D-PLI via tractography5. The study of the brain fiber network from the topological point of view has seen an increasing interest in the last years6,7. In this work, we show how tractograms obtained at different spatial scales using 3D-PLI human brain datasets can be inspected using homology theory to perform a quantitative comparison between them. In particular, we investigate the persistence of the number of connected components in brain networks estimated at different resolutions.Methods
Analytical Fiber ODF in 3D-PLI : From 3D-PLI dataset, FODs can be reconstructed2-4,8 at different spatial scales by changing the size of the so-called super-voxel (SV) which allows downsampling the micrometer resolutions up to the millimetres (of dMRI). As previously demonstrated2-5, our analytical approach is computationally efficient and allows fast computations of FODs from 3D-PLI data to perform tractography.Multi-scale tractography : By varying the SV size, tractography is performed at different resolutions5. Seeding from the gray matter - white matter interface (GM-WMi), we obtained 10 million streamlines at each resolution using the iFOD2 algorithm implemented in Mrtrix39. A weight was associated to each streamline using SIFT210 to re-establish the balance between its density and the fiber density computed from the fODFs. The chosen atlas is defined at the GM-WMi when $$$SV = 100 × 100 × 25$$$ and every voxel is a different region. In this way, proximity in the atlas is coupled with proximity of assigned labels. Finally, a weighted connectivity matrix was computed at each resolution using the defined streamline weights and atlas.
Homology analysis: The analysis of the homology of the obtained networks was performed by measuring the persistence of the 0-th Betti β0 on the natural filtration of the graph. This was achieved by counting the number of connected components of the graph when thresholded at levels defined by the unique values of the edge weights in the network. The shape of the resulting threshold−β0 curves give an insight on the robustness of β0 with respect to the chosen threshold for a specific network.
Human Brain Dataset: The studied dataset consists of 50 unstained histological coronal slices of the right hemisphere and fully describes in11. Each slice is 70 microns thick with an in-plane resolution of 64×64 μm2. The $$$SV = 25 × 25 × 25$$$ closes the gap with dMRI resolution.
Results and discussion
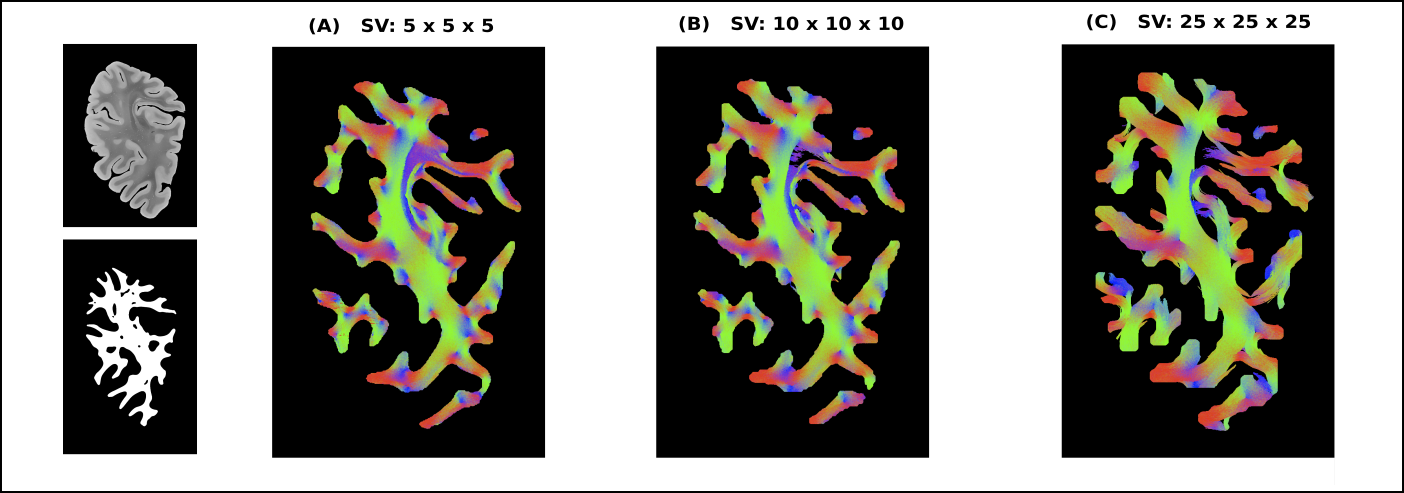
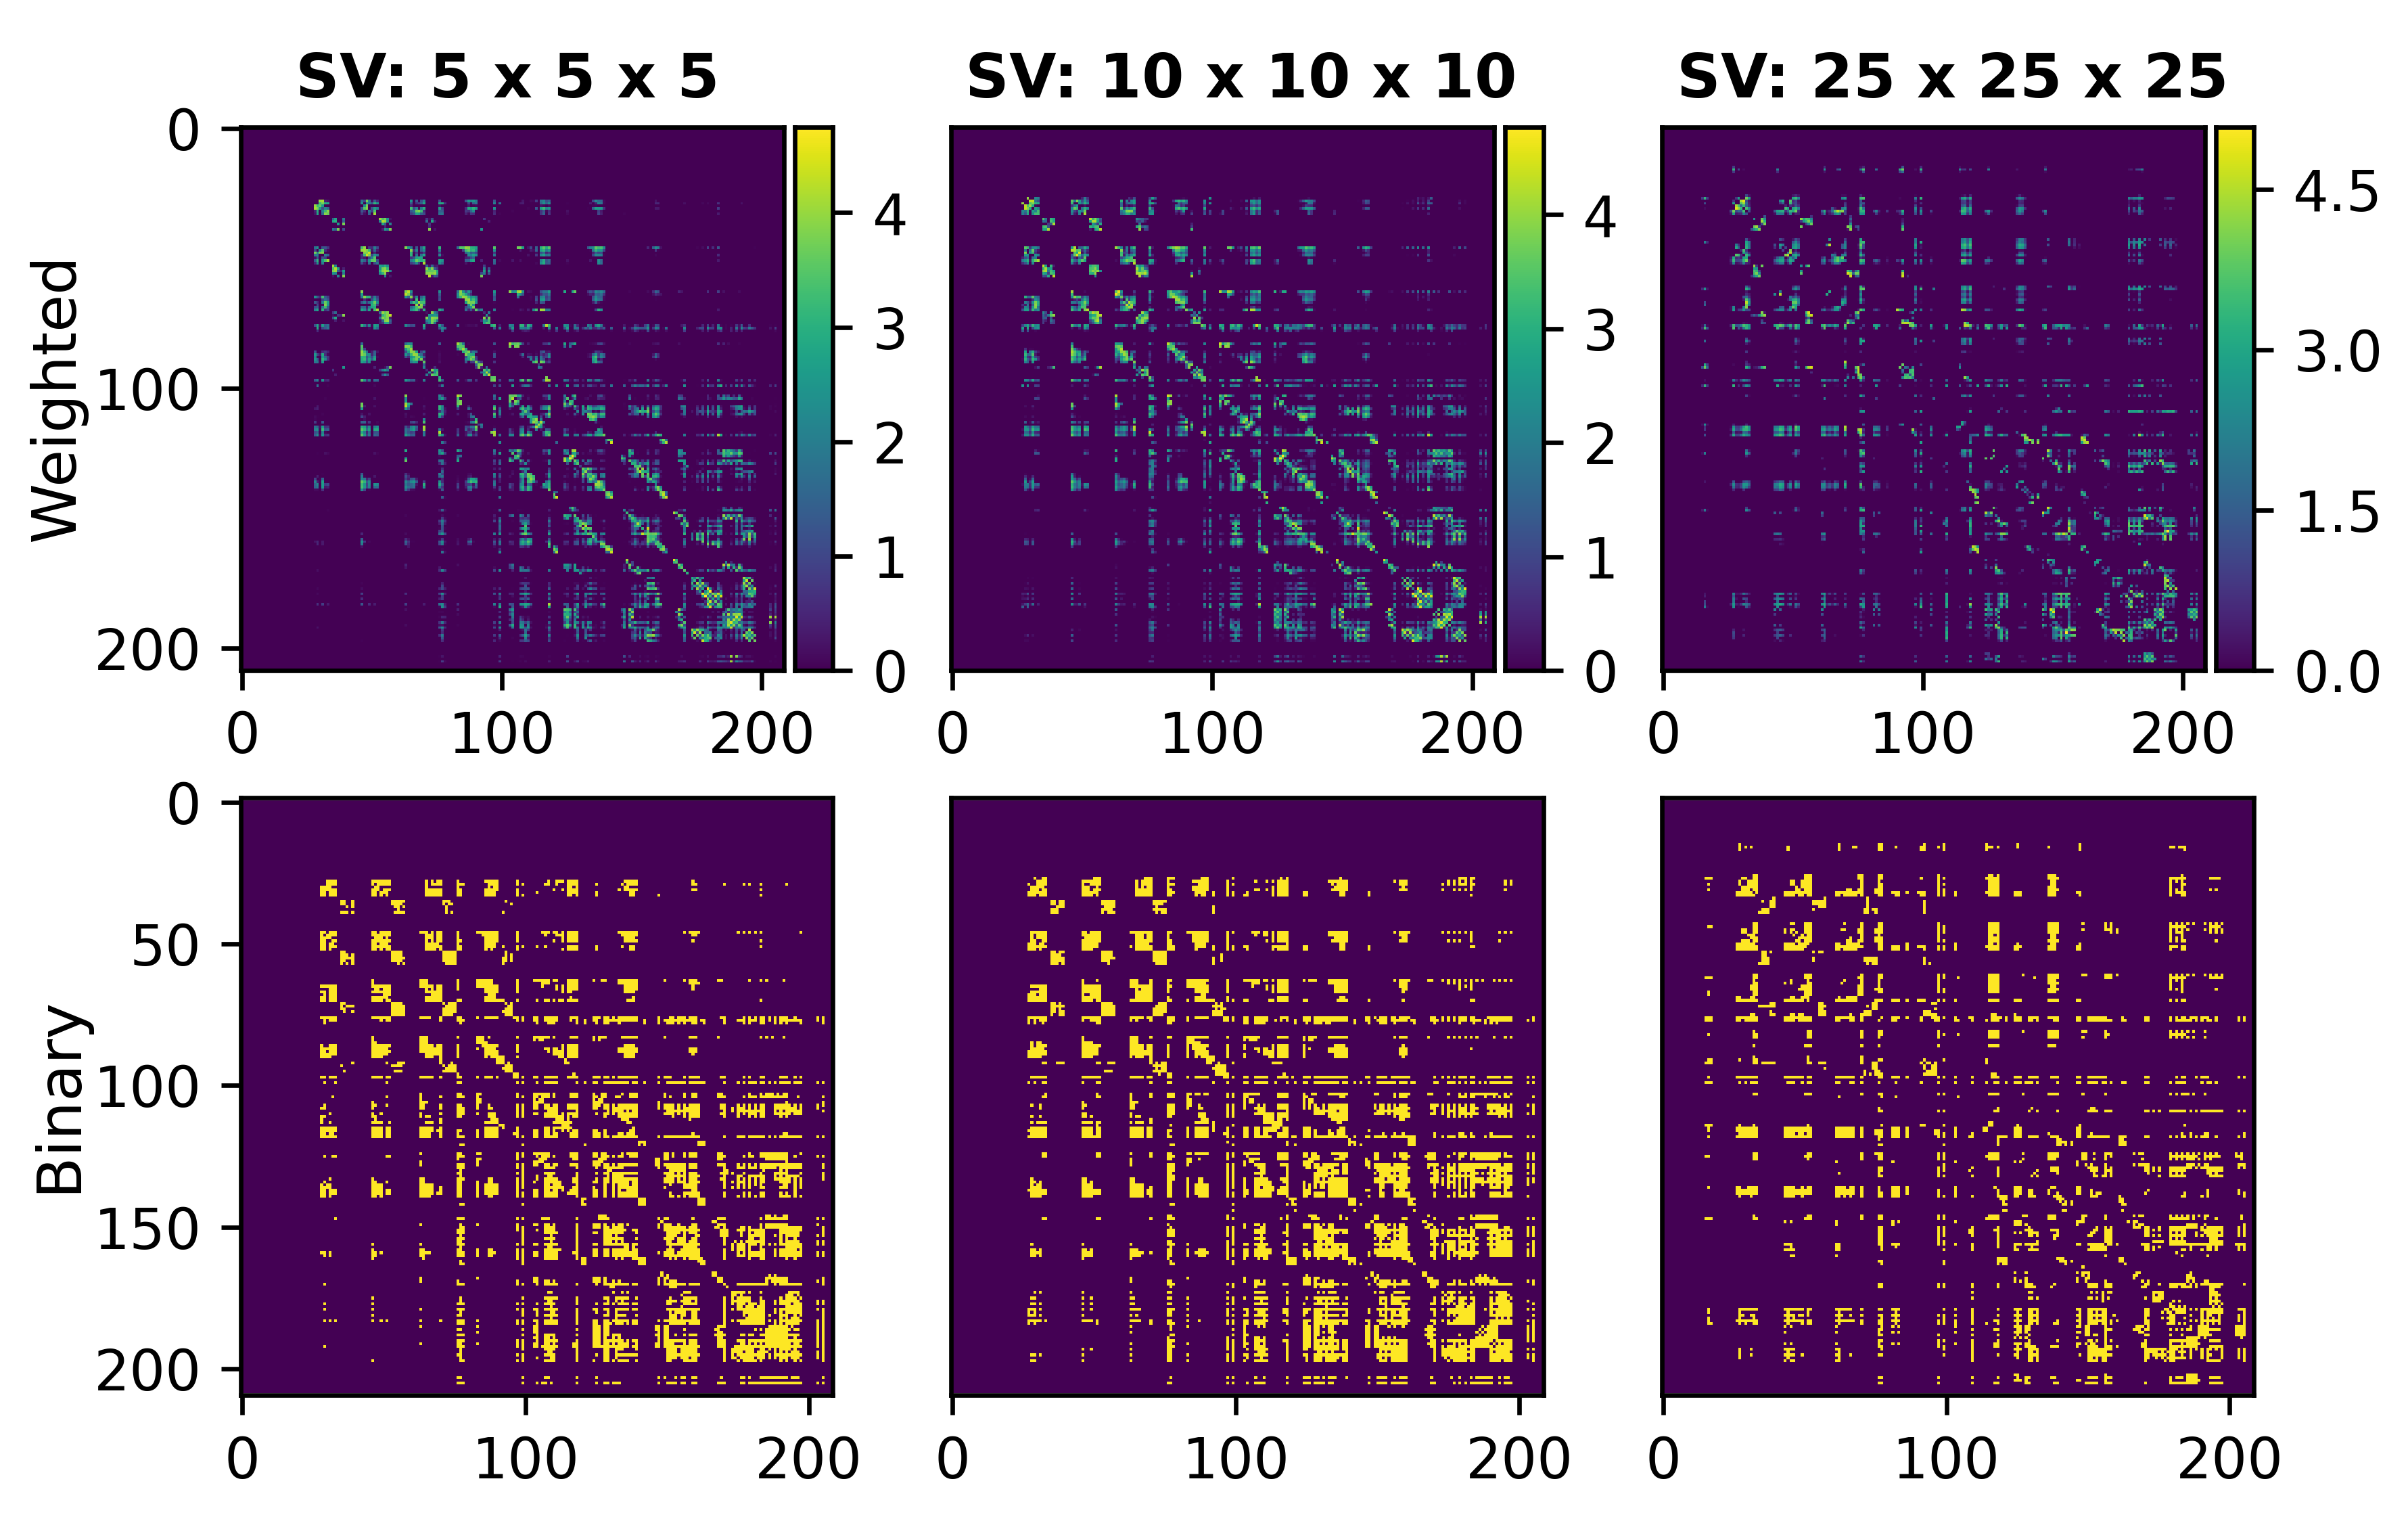
Figure 1 displays the generated streamlines from the 3D-PLI high-resolution up to the relatively low dMRI resolution. From (A) to (C), the spatial scale decreases whereas the integrity of the brain fiber pathways are preserved.The first row of figure 2 shows the connectivity matrices computed at different SV sizes. Notice the pervasive presence of small communities of regions at every resolution. This is due to the existence of many U-fibers in the occipital lobe as demonstrated from histology and dissection studies12,13 . Moreover, the second row illustrates the sparsity pattern of the weighted connectivity matrices, highlighting the presence of weaker connections between further regions. These weaker connections are more present in the connectome computed at the lowest resolution, $$$SV = 25 × 25 × 25$$$.
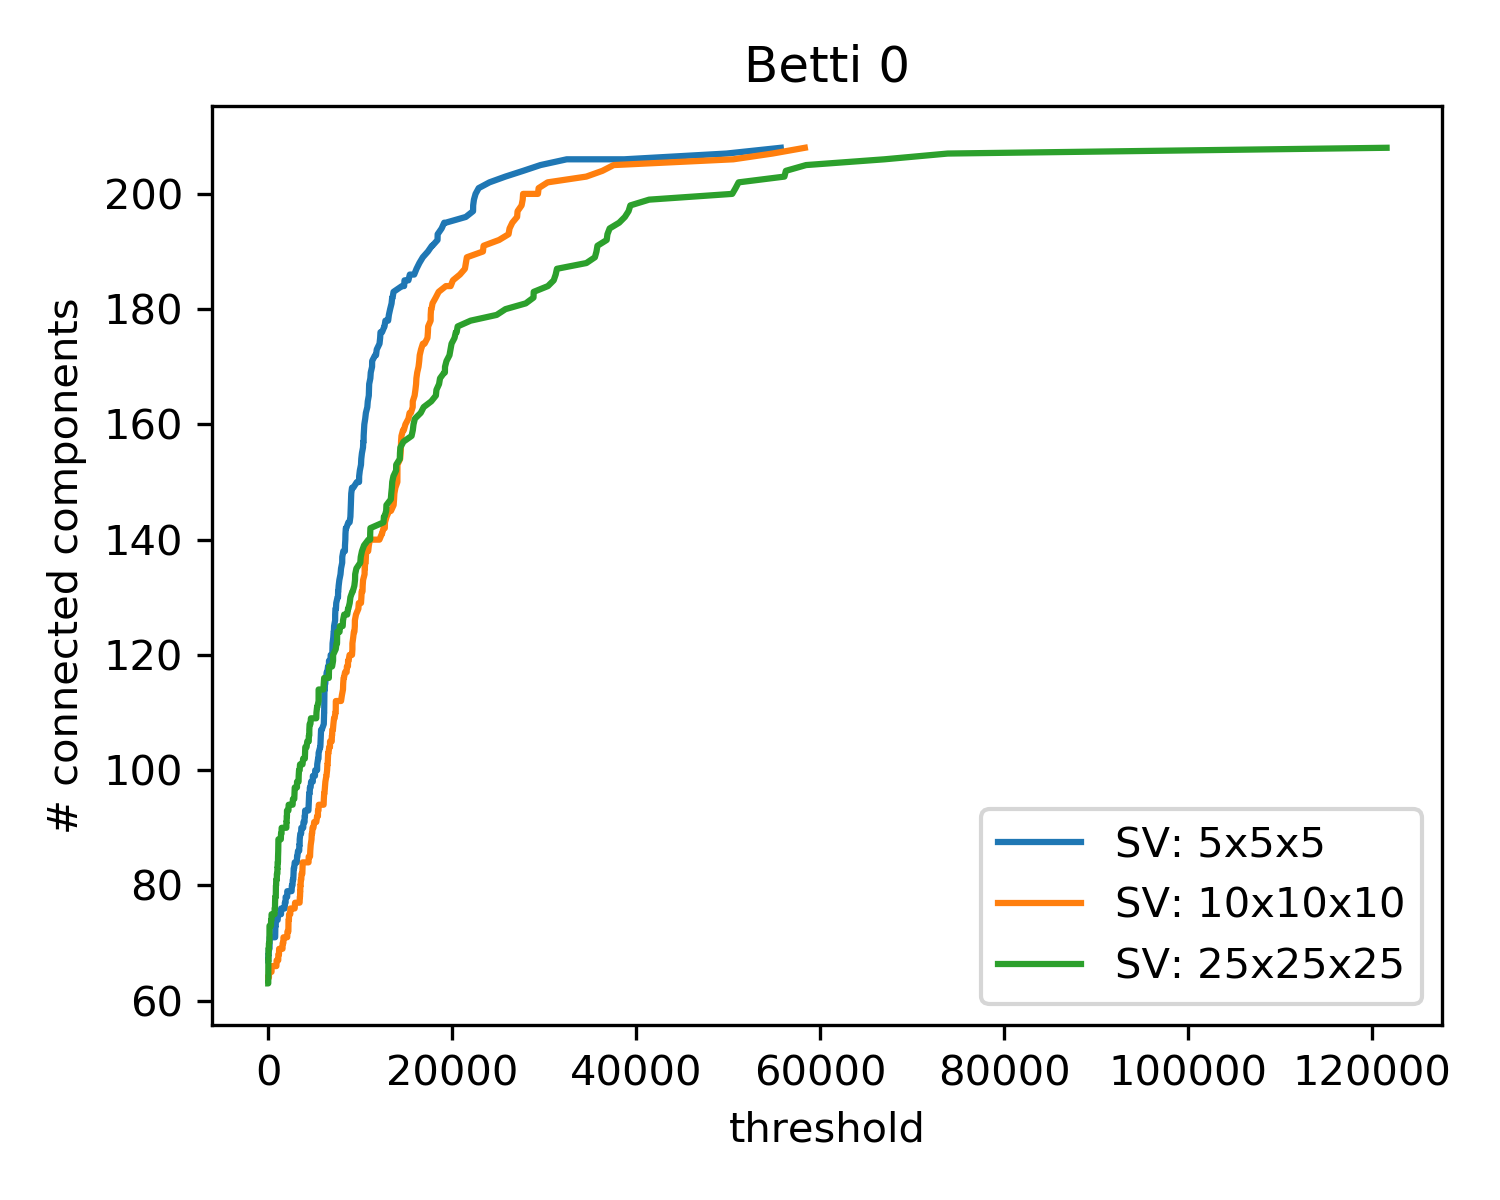
Figure 3 pictures the evolution of the Betti 0 number β0 with respect to the thresholding level applied to the matrices. The value of β0 for the original connectomes (threshold equal to 0) is 67, 64 and 63 for the highest, intermediate and lowest resolution, respectively. Since each region is composed of one single voxel, these differences correspond to minimal changes in the tractograms and should not be interpreted as structural differences caused by the diverse SV sizes. Up to a threshold level of around 15000 units the three curves have a similar behaviour, showing how thresholding at low levels does not affect the comparability of the β0 features of the connectomes. On the contrary, as soon as the 15000 units level is reached, the number of connected components in the highest resolution tractogram increases much faster than its homologous in the other two connectomes. The comparability is restored for high threshold values, where the connectome is reduced to a graph made almost uniquely of isolated nodes. This case is not interesting for our comparison and is included only to show the correct termination of the analysis.
Conclusion
Our results indicate that the connectomes obtained at different resolutions are endowed with a topological structure which is very similar with respect to the number of connected components. This paves the way for validation of dMRI-based tractography via 3D-PLI. Nevertheless, the study of the persistence of the number of connected components suggests that analogies in β0 between connectomes at different resolutions may be observed only if the corresponding networks are thresholded up to a relatively small value, hence taking into account both the stronger and the weaker connections regardless of the chosen spatial resolution.Acknowledgements
This work was partly supported by ANR ″MOSIFAH″ under ANR-13-MONU- 0009-01, the ERC under the European Union’s Horizon 2020 research and in- novation program (ERC Advanced Grant agreement No 694665:CoBCoM). We would like to thank professor Marcus Axer and his group for providing the 3D-PLI human brain datasets.
References
1. Axer et al. A novel approach to the human connectome: ultra-high resolution mapping of fiber tracts in the brain, Neuroimage, vol. 54, no. 2, pp. 1091–1101, 2011.
2. Alimi et al. An analytical fiber odf reconstruction in 3D Polarized Light Imaging, in Biomedical Imaging (ISBI 2018), 2018 IEEE 15th International Symposium on. IEEE, 2018, pp. 1276-1279.
3. Alimi et al. Analytical Fiber ODF Reconstruction in 3D Polarized Light Imaging: Performance Assessment, 2019 IEEE 16th International Symposium on Biomedical Imaging (ISBI 2019), Venice, Italy, 2019, pp. 1652-1655
4. Alimi et al. Analytical and Fast Fiber Orientation Distribution Reconstruction in 3D-Polarized Light Imaging. Submitted to Medical Image Analysis.
5. Alimi et al. Towards validation of diffusion MRI tractography: bridging the resolution gap with 3D Polarized Light Imaging. Proceedings of the International Society for Magnetic Resonance in Medicine, 2019,
6. Sizemore, et al. Cliques and cavities in the human connectome. Journal of computational neuroscience 44.1 (2018): 115-145.
7. Chung, Moo K., et al. Topological distances between brain networks. International Workshop on Connectomics in Neuroimaging. Springer, Cham, 2017.
8. Axer et al, Estimating fiber orientation distribution functions in 3D-polarized light imaging, Frontiers in neuroanatomy, vol. 10, 2016.
9. Tournier et al. MRtrix3: A fast, flexible and open software framework for medical image processing and visualisation. NeuroImage (2019): 116137.
10. Smith et al. SIFT2: Enabling dense quantitative assessment of brain white matter connectivity using streamlines tractography. Neuroimage 119 (2015): 338-351.
11. Schmitz et al. Derivation of fiber orientations from oblique views through human brain sections in 3D-Polarized Light Imaging. Frontiers in neuroanatomy 12 (2018): 75.
12. Sachs, Heinrich. Das Hemisphearenmark des menschlichen Grosshirns: Der Hinterhauptlappen. Mit einem Vorwort von C. Wernicke. G. Thieme, 1892.
13.Vergani et al. Intralobar fibres of the occipital lobe: a post mortem dissection study. Cortex 56 (2014): 145-156.
Figures