4482
Detecting neuronal connectivity using diffusion tensor imaging in a Parkinson`s disease mouse basal ganglia using 9.4T MRI1Gachon university, Incheon, Korea, Republic of
Synopsis
Parkinson's disease (PD) is a neurodegenerative disorder that affects motor and cognition, resulting from dopaminergic cell death in substantia nigra (SN). Basal ganglia, a neural circuit involved in executive functions such as motor control and have been studied extensively in PD mouse models. Mouse brain tractography using MRI have seen increasing use to study neural networks but more comprehensive analysis is needed to establish a stronger consensus. The purpose of this study is to provide a comprehensive analysis of basal ganglia neuronal connectivity in control and PD mouse models.
Introduction
Parkinson's disease (PD) is one of the most common neurological disorders and is a degenerative neuropathy that affects both motor function and cognition1. The pathology of PD is the gradual loss of dopaminergic (DAergic) neurons in the substantia nigra (SN), significantly reducing extracellular DA levels in basal ganglia structures like the striatum2. As a result of lowered DA levels, increased frequency of neuronal discharges in GPi, SNr, STN and decreased frequency in GPe can occur, inhibiting the motor nucleus of the thalamus3. Basal ganglia are neuronal circuits involved in motor control and executive functions such as motor learning, behavioral control and emotion4. Studies of Basal ganglia neuronal connectivity in Parkinson's disease (PD) using MRI have shown promising results but remains incomplete5. In addition, pathological data of PD mouse models are frequently used to document the pathology of Parkinson's but there is a lack of information regarding the neuronal interconnectivity of basal ganglia of PD mouse models. This study provides a comprehensive analysis of PD-related changes in mouse basal ganglia neuronal connectivity between control group and disease group by comparing tractography generated from each basal ganglia structure.Method
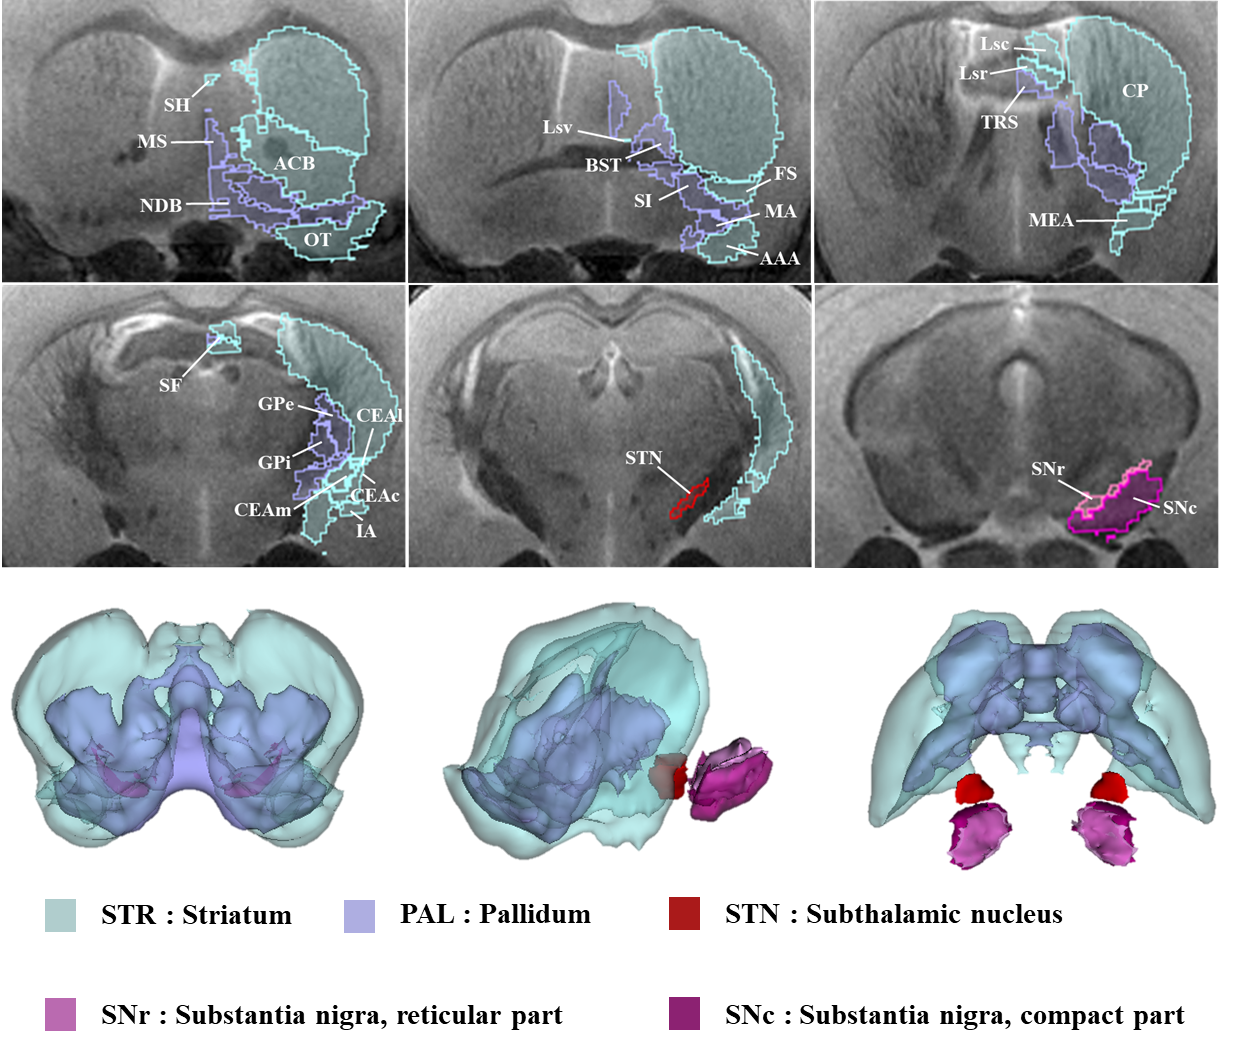
Experiments were performed in four month old female mice (control group of TetP-AIMP2 (n= 2) and disease group 3X-Tg (n= 2)). Mouse transcardially were perfused and fixed with 4% paraformaldehyde and 0.1% Magnevist® in phosphate buffer (PB). Brains were extracted and incubated in 0.1% Magnevist/phosphate buffer for 4 days, placed in Fomblin and imaged. Image acquisition was conducted on a 9.4 T Bruker BioSpec horizontal bore, dedicated animal scanner (Bruker Biospin, Ettlingen, Germany), equipped with a gradient system of (440mT/m). For signal reception, a quadrature mouse brain surface coil (Bruker Biospin) was applied. MRI data was acquired using Paravision 5.1 software. The pulse sequence used for this acquisition was 3D TurboRARE T2 (Spin echo sequence with a repetition time = 1800 ms, echo time = 33.6 ms, flip angle = 90°, Bandwidth = 100kHz, field of view = 1.2 × 1.2 × 15.6 cm, matrix = 240 × 240 × 156, resolution = 50 × 50 × 100 µm, 1 averages and resulting in a total acquisition time of 1h 43m) and 2D EPI-Diffusion tensor (Spin echo sequence with a repetition time = 7000 ms, echo time = 30 ms, flip angle = 90°, bandwidth = 170kHz, b-value = 3003 s/mm², diffusion gradient pulse duration (δ) = 4.5 ms, diffusion gradient separation (Δ) = 10.6 ms, field of view = 1.8 × 1.8 cm, slice thickness = 0.12 mm, matrix = 150 × 150, slice = 70, resolution = 120 x 120 x 120 µm, 8 averages and resulting in a total acquisition time of 8h 10m). Diffusion tensor image data were preprocessed by denoising and biasfield correction using MRtrix3. We acquired brain extracted images from whole-head input 3D T2 image data and created masks based on Allen Mouse Brain Atlas anatomical regions using ANTx6,7,8. Subsequently, we registered the basal ganglia masks obtained using ANTx to our native mouse brain using FSL's FLIRT tool9. We preformed eddy correction using FSL and then acquired fiber reconstruction data using FSL's BEDPOSTX10 and probabilistic tractography data using FSL's PROBTRACKX11.Result
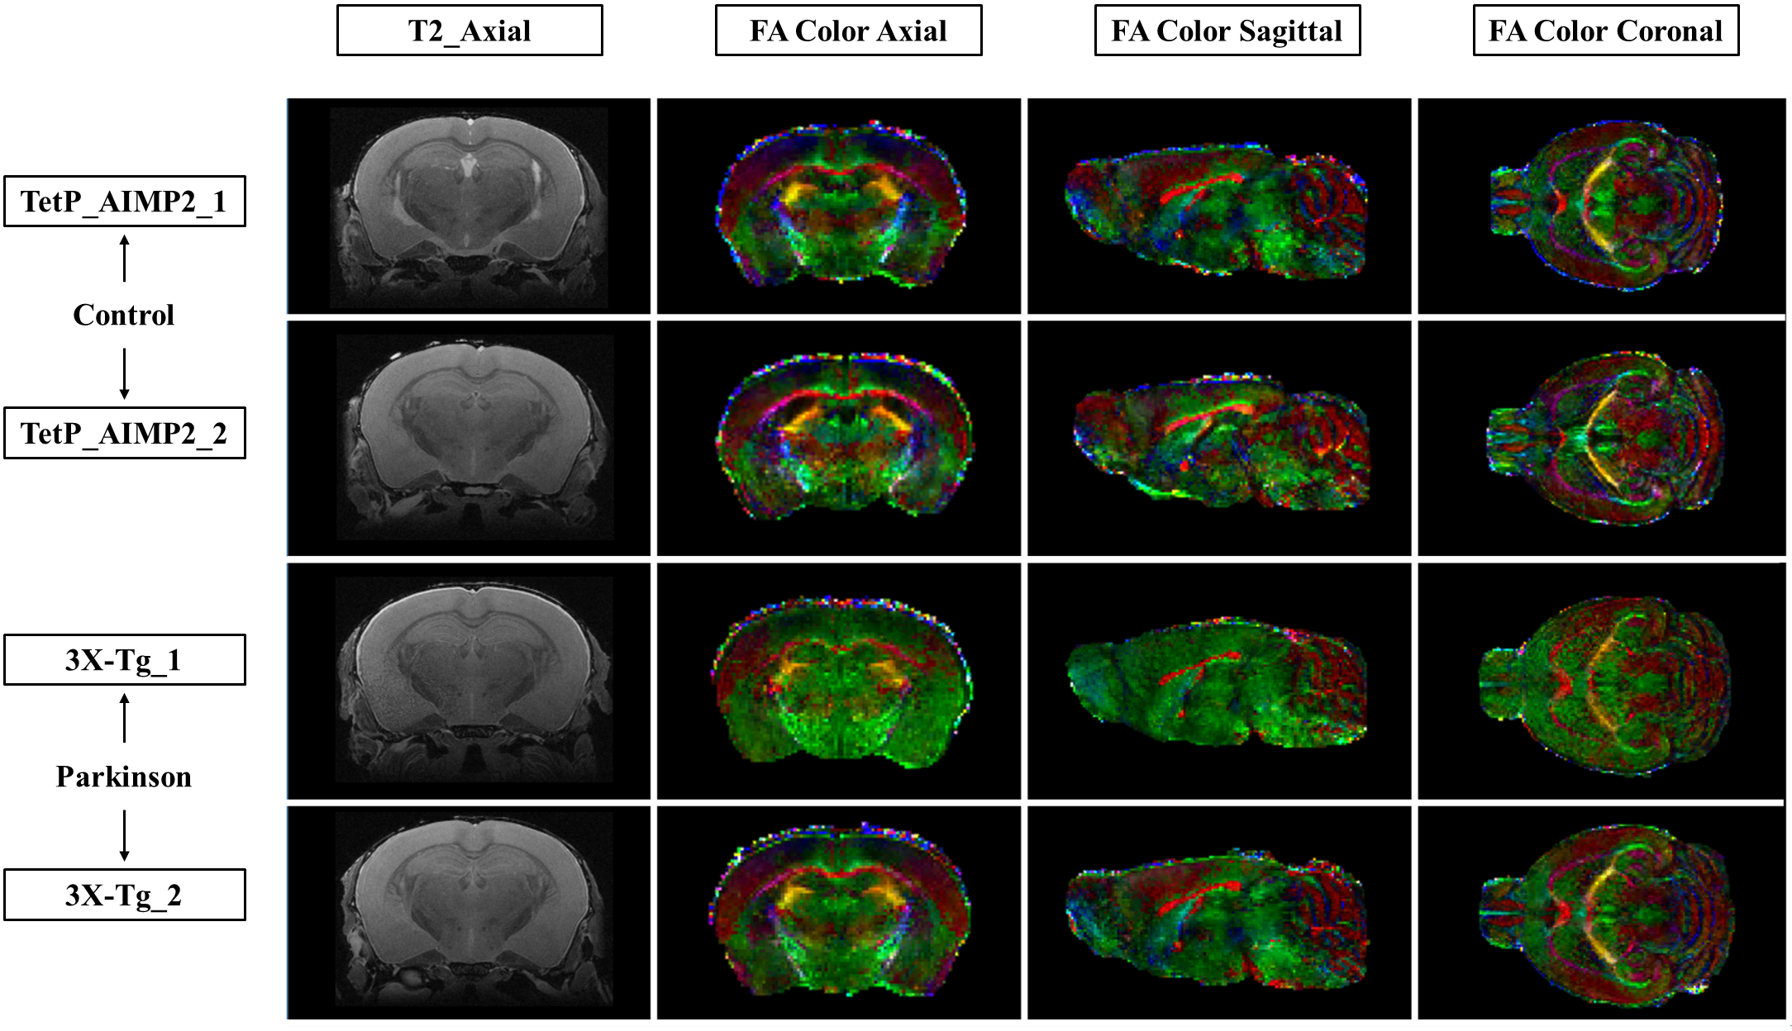
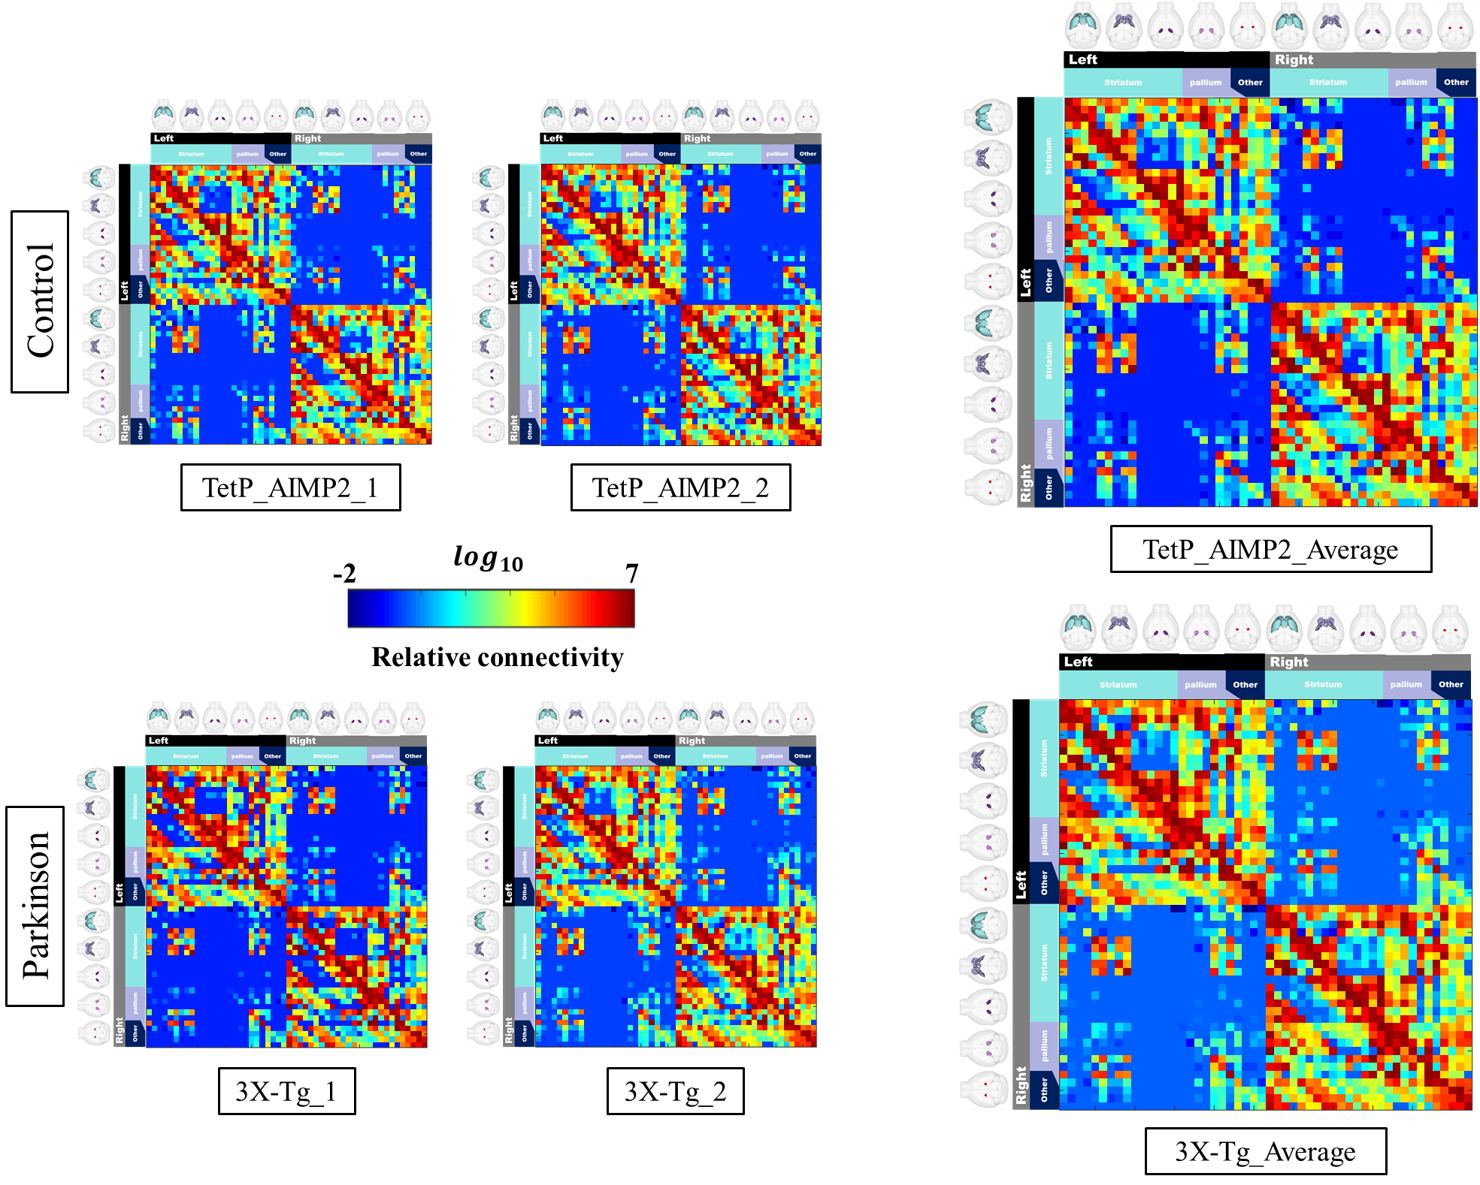
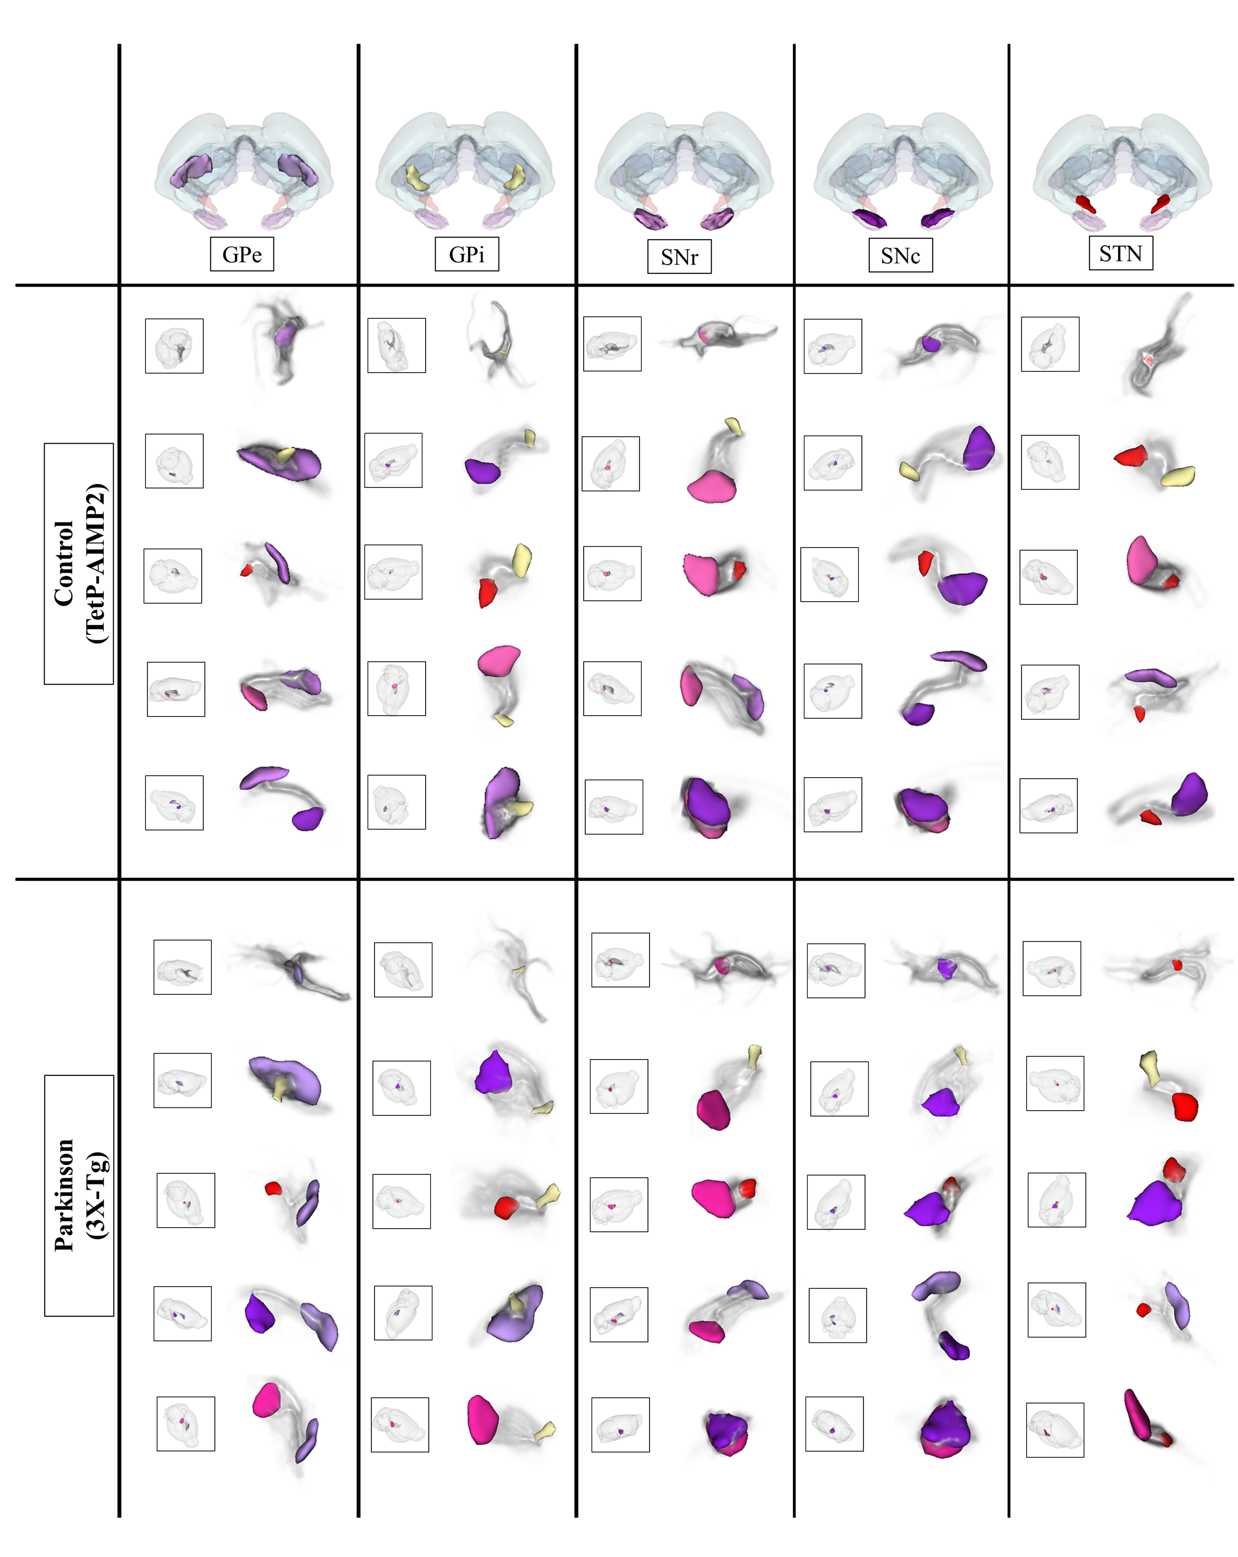
The acquired T2 and DTI of a mouse as well as the FSL generated FA map are shown in Figure 1. The basal ganglia segmentation and 3D rendering of mouse brain are presented in Figure 2. 3D rendering was done by partitioning the STR, PAL, SNr, SNc and STN structures in relation to anatomical landmarks. Table 1 displays the volume, apparent diffusion coefficient (ADC) and fractional anisotropy (FA) value of our segmented structures. Probabilistic tractography between basal ganglia are represented as connectivity matrices to compare connectivity between each basal ganglia structure as shown in Figure 3. Basal ganglia connectivity map was estimated between 52 anatomic regions with a log10 scale color map using waypoints connectivity. Figure 4 shows fiber track tracts between PD related structures (e.g., GPi, GPe, SNr, SNc, STN) of control and disease group.Discussion and conclusion
In this study, we were able to use the Allen Mouse Brain Atlas for the accurate segmentation of the basal ganglia, then use the segmentations for generating neuronal connectivity of basal ganglia structures in PD mice using high resolution 9.4T MRI. We were also able to generate a connectivity map of the entire brain for identifying connectivity differences in control and PD mouse models. In Table 1, quantitative analysis of the basal ganglia shows decrease in FA and increase in MD, which were found to be in part consistent with previous studies on Parkinson's disease1. In addition, the connectivity matrix results in Figure 3 shows that the Parkinson group had a smaller overall signal intensity range than the control group, and that the mouse basal ganglia's interconnectivity is almost consistent with previous studies on human basal ganglia interconnectivity12. In Figure 4, we were able to visualize the neural connectivity of Parkinson's disease-related biomarkers in the control and disease groups, and observe the reconstruction of connectivity between the structures. The results of this study can serve as a reference database for further studies using Parkinson's disease model.Acknowledgements
This research was supported by Brain Research Program through the National Research Foundation of Korea (NRF) funded by the Ministry of Science andICT (NRF-2017M3C7A1044367).References
[1] Hope TR, Selnes P, Rektorová I, et al. Diffusion tensor and restriction spectrum imaging reflect different aspects of neurodegeneration in Parkinson’s disease. PloS one, 2019, 14.5: e0217922.
[2] Arab A, Ruda-Kucerova J, Minsterova A, et al. Diffusion Kurtosis Imaging Detects Microstructural Changes in a Methamphetamine-Induced Mouse Model of Parkinson’s Disease. Neurotoxicity research, 2019, 1-12.
[3] Cunha CD, Boschen SL, Gómez-A A, et al. Toward sophisticated basal ganglia neuromodulation: review on basal ganglia deep brain stimulation. Neuroscience & Biobehavioral Reviews, 2015, 58: 186-210.
[4] Jeremy FPU, Watson C, Janke AL, et al. An MRI atlas of the mouse basal ganglia. Brain Structure and Function, 2014, 219.4: 1343-1353.
[5] Lan-xiang L, Dan D, Tao Z, et al. Detecting dopaminergic neuronal degeneration using diffusion tensor imaging in a rotenone-induced rat model of Parkinson's disease: fractional anisotropy and mean diffusivity values. Neural regeneration research, 2017, 12.9: 1485.
[6] Koch S, Mueller S, Foddis M, et al. Atlas registration for edema-corrected MRI lesion volume in mouse stroke models. Journal of Cerebral Blood Flow & Metabolism, 2019, 39.2: 313-323.
[7] Hübner NS, Mechling AE, Hsu-Lei L, et al. The connectomics of brain demyelination: functional and structural patterns in the cuprizone mouse model. Neuroimage, 2017, 146: 1-18.
[8] Lein ES, Hawrylycz MJ, Ao N, et al. Genome-wide atlas of gene expression in the adult mouse brain. Nature, 2007, 445.7124: 168.
[9] Jenkinson M, Smith S. A global optimisation method for robust affine registration of brain images. Medical image analysis, 2001, 5.2: 143-156.
[10] Jbabdi S, Sotiropoulos SN, Savio AM, et al. Model‐based analysis of multishell diffusion MR data for tractography: How to get over fitting problems. Magnetic resonance in medicine, 2012, 68.6: 1846-1855.
[11] Behrens TEJ, Woolrich MW, Jenkinson M, et al. Characterization and propagation of uncertainty in diffusion‐weighted MR imaging. Magnetic Resonance in Medicine: An Official Journal of the International Society for Magnetic Resonance in Medicine, 2003, 50.5: 1077-1088.
[12] Calabrese E, Badea
A, Cofer G, et al. A diffusion MRI tractography connectome of the mouse brain
and comparison with neuronal tracer data. Cerebral cortex, 2015, 25.11:
4628-4637.
Figures