4481
Comparison of Basal Ganglia-based Structural Connectome between 6-OHDA-induced Parkinson Mouse Model and Normal Mouse Model
Ayoon Kim1 and Hyeon-Man Baek1
1Department of Health Science and Technology, GAIHST, Gachon University, gachon university, Incheon, Republic of Korea, Republic of Korea
1Department of Health Science and Technology, GAIHST, Gachon University, gachon university, Incheon, Republic of Korea, Republic of Korea
Synopsis
The study on probabilistic connectivity of basal ganglia have not reported in mouse model. However, we have quantified fiber connectivity and visualized specific tractography pathway. The basal ganglia is a complex system of a subcortical nuclei network which plays a fundamental role in a wide range of processes related to motor and limbic functions. Altered neural connectivity of basal ganglia may contribute to a number of neurologic and psychiatric disease such as Parkinson’s disease. This study shows that probabilistic diffusion tractography allows for detailed 3D reconstruction of the projections of basal ganglia in ex vivo control and PD mouse brain.
Introduction:
The basal ganglia is a complex system of a subcortical nuclei network which plays a fundamental role in a wide range of processes related to motor and limbic functions 1. Altered neural connectivity of basal ganglia may contribute to a number of neurologic and psychiatric disease such as Parkinson’s disease (PD)2. An important challenge in parkinson’s disease (PD) based neuroscience and neuroimaging is the accurately understand brain circurity by mapping neuronal connectivity in the basal ganglia-thalamus. However, a majority of previous diffusion tractography studies have difficulties in revealing connections between distant anatomic brain regions or visualizing basal ganglia connectome. In current study, we investigated the basal ganglia connectivity to evaluate differences between 6-OHDA induced ex-vivo PD mouse model and normal ex-vivo mouse model by using diffusion tensor imaging tractography at high resolution 9.4 T MR scanner.
Methods:
Five C57BL/6N mouse (8 weeks old) and five 6-OHDA induced PD mouse were chosen for imaging. The animals were perfusion-fixed and doped with 4% paraformaldehyde and 0.1% Magnevist®. Diffusion data were acquired using 2D diffusion-weighted spin-echo sequence with the parameters, TR/TE = 3000/30 ms, resolution = 200×200 µm, slice thickness = 0.2 mm, diffusion directions = 30, b-value = 3003 with an acquisition time of 2h 6min. All image volumes were registered to the first bo image using Atlas Normalization Toolbox using elastix (ANTx). Fiber data for probabilistic tractography were reconstructed using FSL’s BEDPOSTX with a maximum of 3 fiber orientations per voxels5. To investigate the connectivity pattern of the basal ganglia including STN, SNr, SNc, GPe and GPi, probabilistic tractography was performed using FSL’s PROBTRACKX. For waypoint connectivity studies, one or more label masks were used as target regions, and only fibers passing through these targets were included in output maps.
Results:
The basal ganglia (CaudPu, STN, SNr, SNc, GPe, GPi) segmented for both left and right hemisphere in 3D rendering for both control and PD-induced mouse is shown in Figure 1. Probabilistic tractography connectivity matrix for the normal and PD-induced mouse brain between anatomic 6 regions, depicted in Figure 2. The percentage of direct fiber connections between the 6 brain structures in normal (Figure 3A) and PD-induced mouse (Figure3B) are represented in Figure 3A,B. Being two adjacent structures, left STN – left GPi (Figure 4A) and right GPi - right STN (Figure 4B) connectivity were significant between normal and 6-OHDA mouse group. In 6-OHDA-induce mouse group, more fiber tracks were found to connect the these brain structures, represented in Figure 4. Waypoint connectivity map between control group and PD-induced group is generated in Figure 5. This allows visualization of the specific significant pathway connecting 2 regions without extraneous connectivity to other regions. Three-dimensional renderings of the pathway are displayed within a surface rendering of the brain from lateral, dorsal and oblique perspectives.
Discussion:
The study on probabilistic connectivity of basal ganglia have not reported in mouse model. However, in this work, we have quantified fiber connectivity and visualized specific tractography pathway. We have also identified connections contribute to understanding of the basal ganglia in ex vivo control and 6-OHDA-induced PD mouse model. In general, ipsilateral connectivity was higher than contralateral connectivity, which is consistent with previous studies of the mouse brain3. In line with previous human brain connectivity study, direct connections within the basal ganglia were approximately the same3. It is likely that short distance connections are overrepresented because they are easier to track than long distance connections. The STN-GPi connections (control:16.3%; PD: 17.98%) which have been established as effective targets of DBS, for example, are fewer than the STN-SNr connections (control:41.51%; PD: 40.29%). This could reflect a relatively important role for the STN-SNr connection in humans, or it could be an overestimation due to its shorter distance3. In probabilistic tractography, subthalamopallidal connectivity differences were significant between the two groups. The main targets for deep brain system in PD are STN and GPi4. After dopamine depletion in PD, indirect pathway (GP and STN) excessively inhibit the motor loop circuit, leads to rigidity5. These STN-GPi connections may drive increased excitation within the GPi in PD, secondary to diminished inhibition of the STN from the GPe6.
Conclusion:
This study shows that probabilistic diffusion tractography allows for detailed 3D reconstruction of the projections of basal ganglia in ex vivo control and PD mouse brain. Multi-fiber tractography methods combined with diffusion MRI data have the potential to help identify brain DBS targets in function neurosurgery intervention. In addition, this study is critical to further understand the complementary and differential roles of basal ganglia, as well as better understand their connectivity relationships to other brain region. Therefore, this work serves as a reference database for future tractography studies in the Parkinson disease model.
Acknowledgements
This study was supported by Research Program through the National Research Foundation of Korea (NRF)funded by the Ministry of Science and ICT (NRF-2017M3C7A1044367). The funders had no role in studydesign, data collection and analysis, decision to publish, or preparation of the manuscript.References
1. Plantinga B, Roebroeck A, Kemper V, et al. Ultra-high field MRI post mortem structural connectivity of the human subthalamic neucleus, substantia nigra, and globus pallidus. Front Neuroanat. 2016;10: 2. Wu T, Wang J, Wang C, et al. Basal ganglia circuits changes in Parkinson’s disease patients. Neurosci Lett. 2012;524(1):55-59 3. Plantinga B, Roebroeck A, Kemper V, et al. Ultra-high field MRI post mortem structural connectivity of the human subthalamic nucleus, subtantia nigra, and globus pallidus. Front. Neuroanat. 2016;10:1-10 4. Mirza S, Yazdani U, Dewey R, et al. Comparison of globus pallidus interna and subthalamic nucleus in deep brain stimulation for Parkinson disease: an institutional experience and review. Parkinson’s disease. 2017:15 5. Loucif KC, Wilson CL, Baig R, Lacey MG and Stanford IM. Functional interconnectivity between the globus pallidus and the subthalamic nucleus in the mouse brain slice. J Physiol. 2005; 565(Pt3):977-987 6. Middlebrooks EH, Tuna IS, Grewal SS et al. Segmentation of the globus pallidus internus using probabilistic diffusion tractography for deep brain stimulation targeting in Parkinson disease. AJNR Am J Neuroradiol. 2018: 39(6):1127-1134.Figures
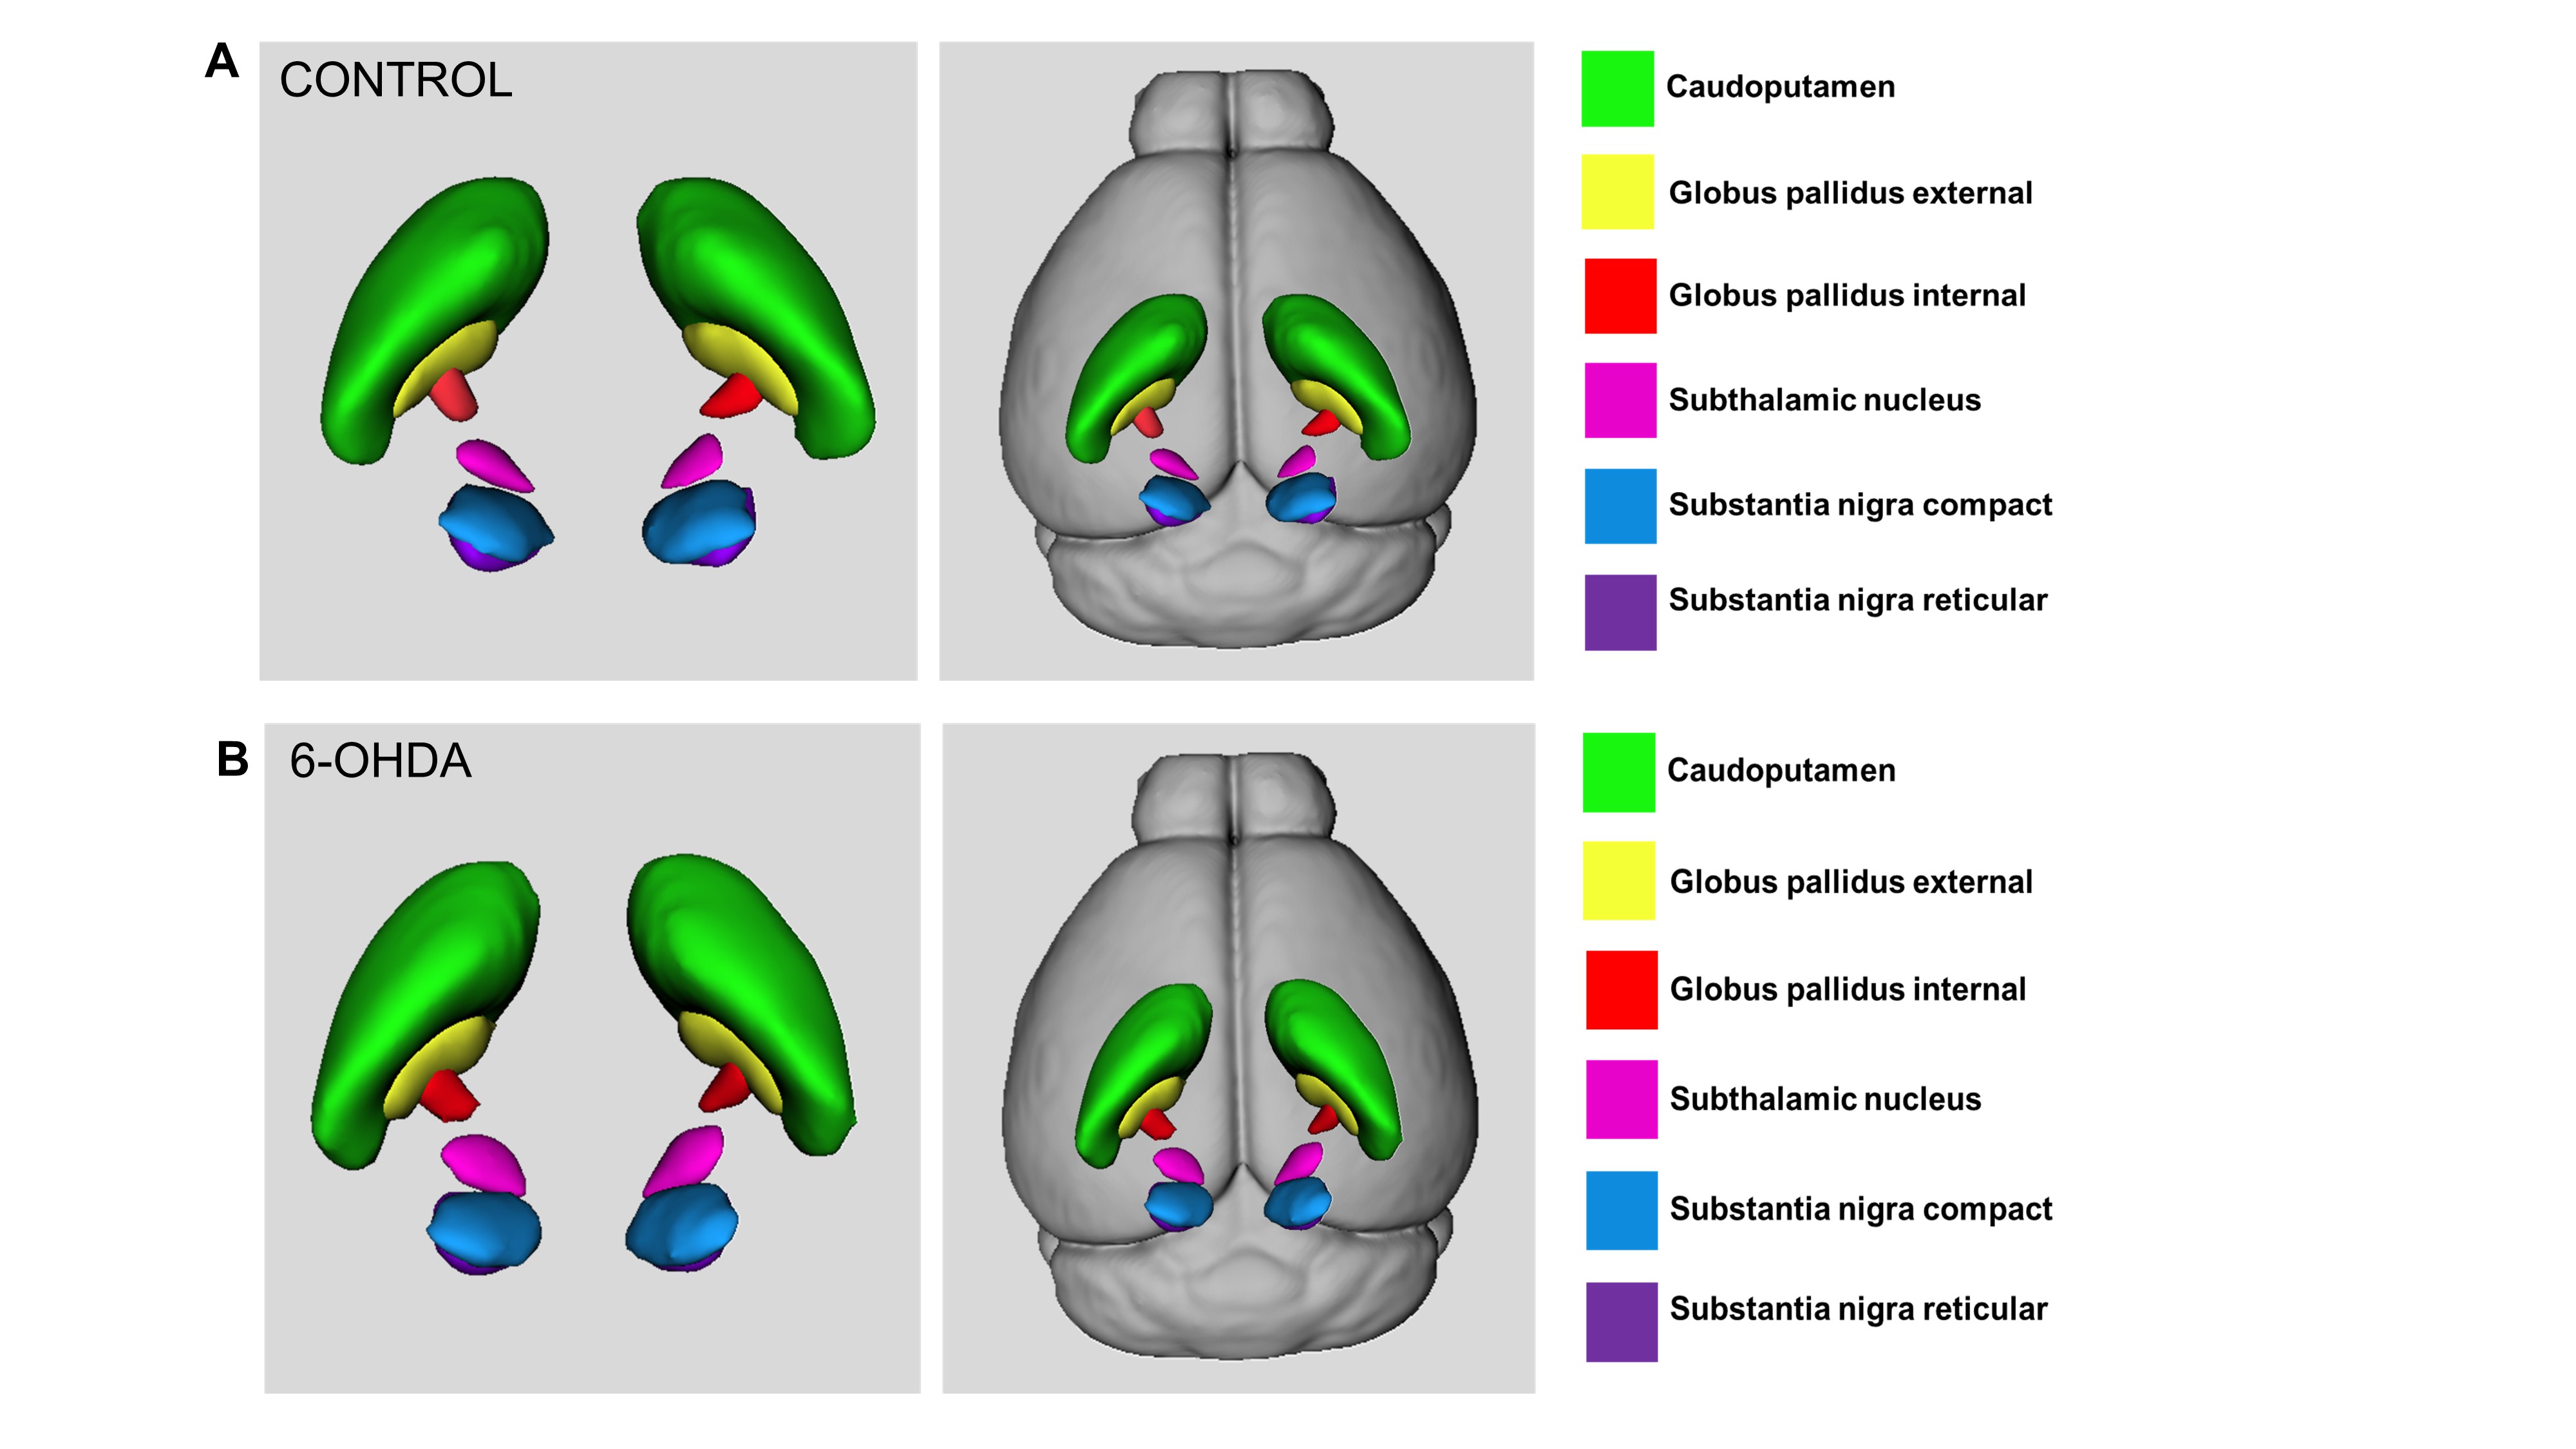
Figure
1. 3D
representations of Segmented bilateral basal ganglia structure. (A) Segmented
bilateral structures in normal mouse brain. (B) Segmented bilateral mouse brain
in 6-OHDA-induced PD mouse model. Color code: green: caudoputamen,
yellow: globus
pallidus
exteral,
red: globus
pallidus
internal, pink=subthalamic
nucleus, blue: substantia nigra
compact, purple: substantia nigra
reticular.
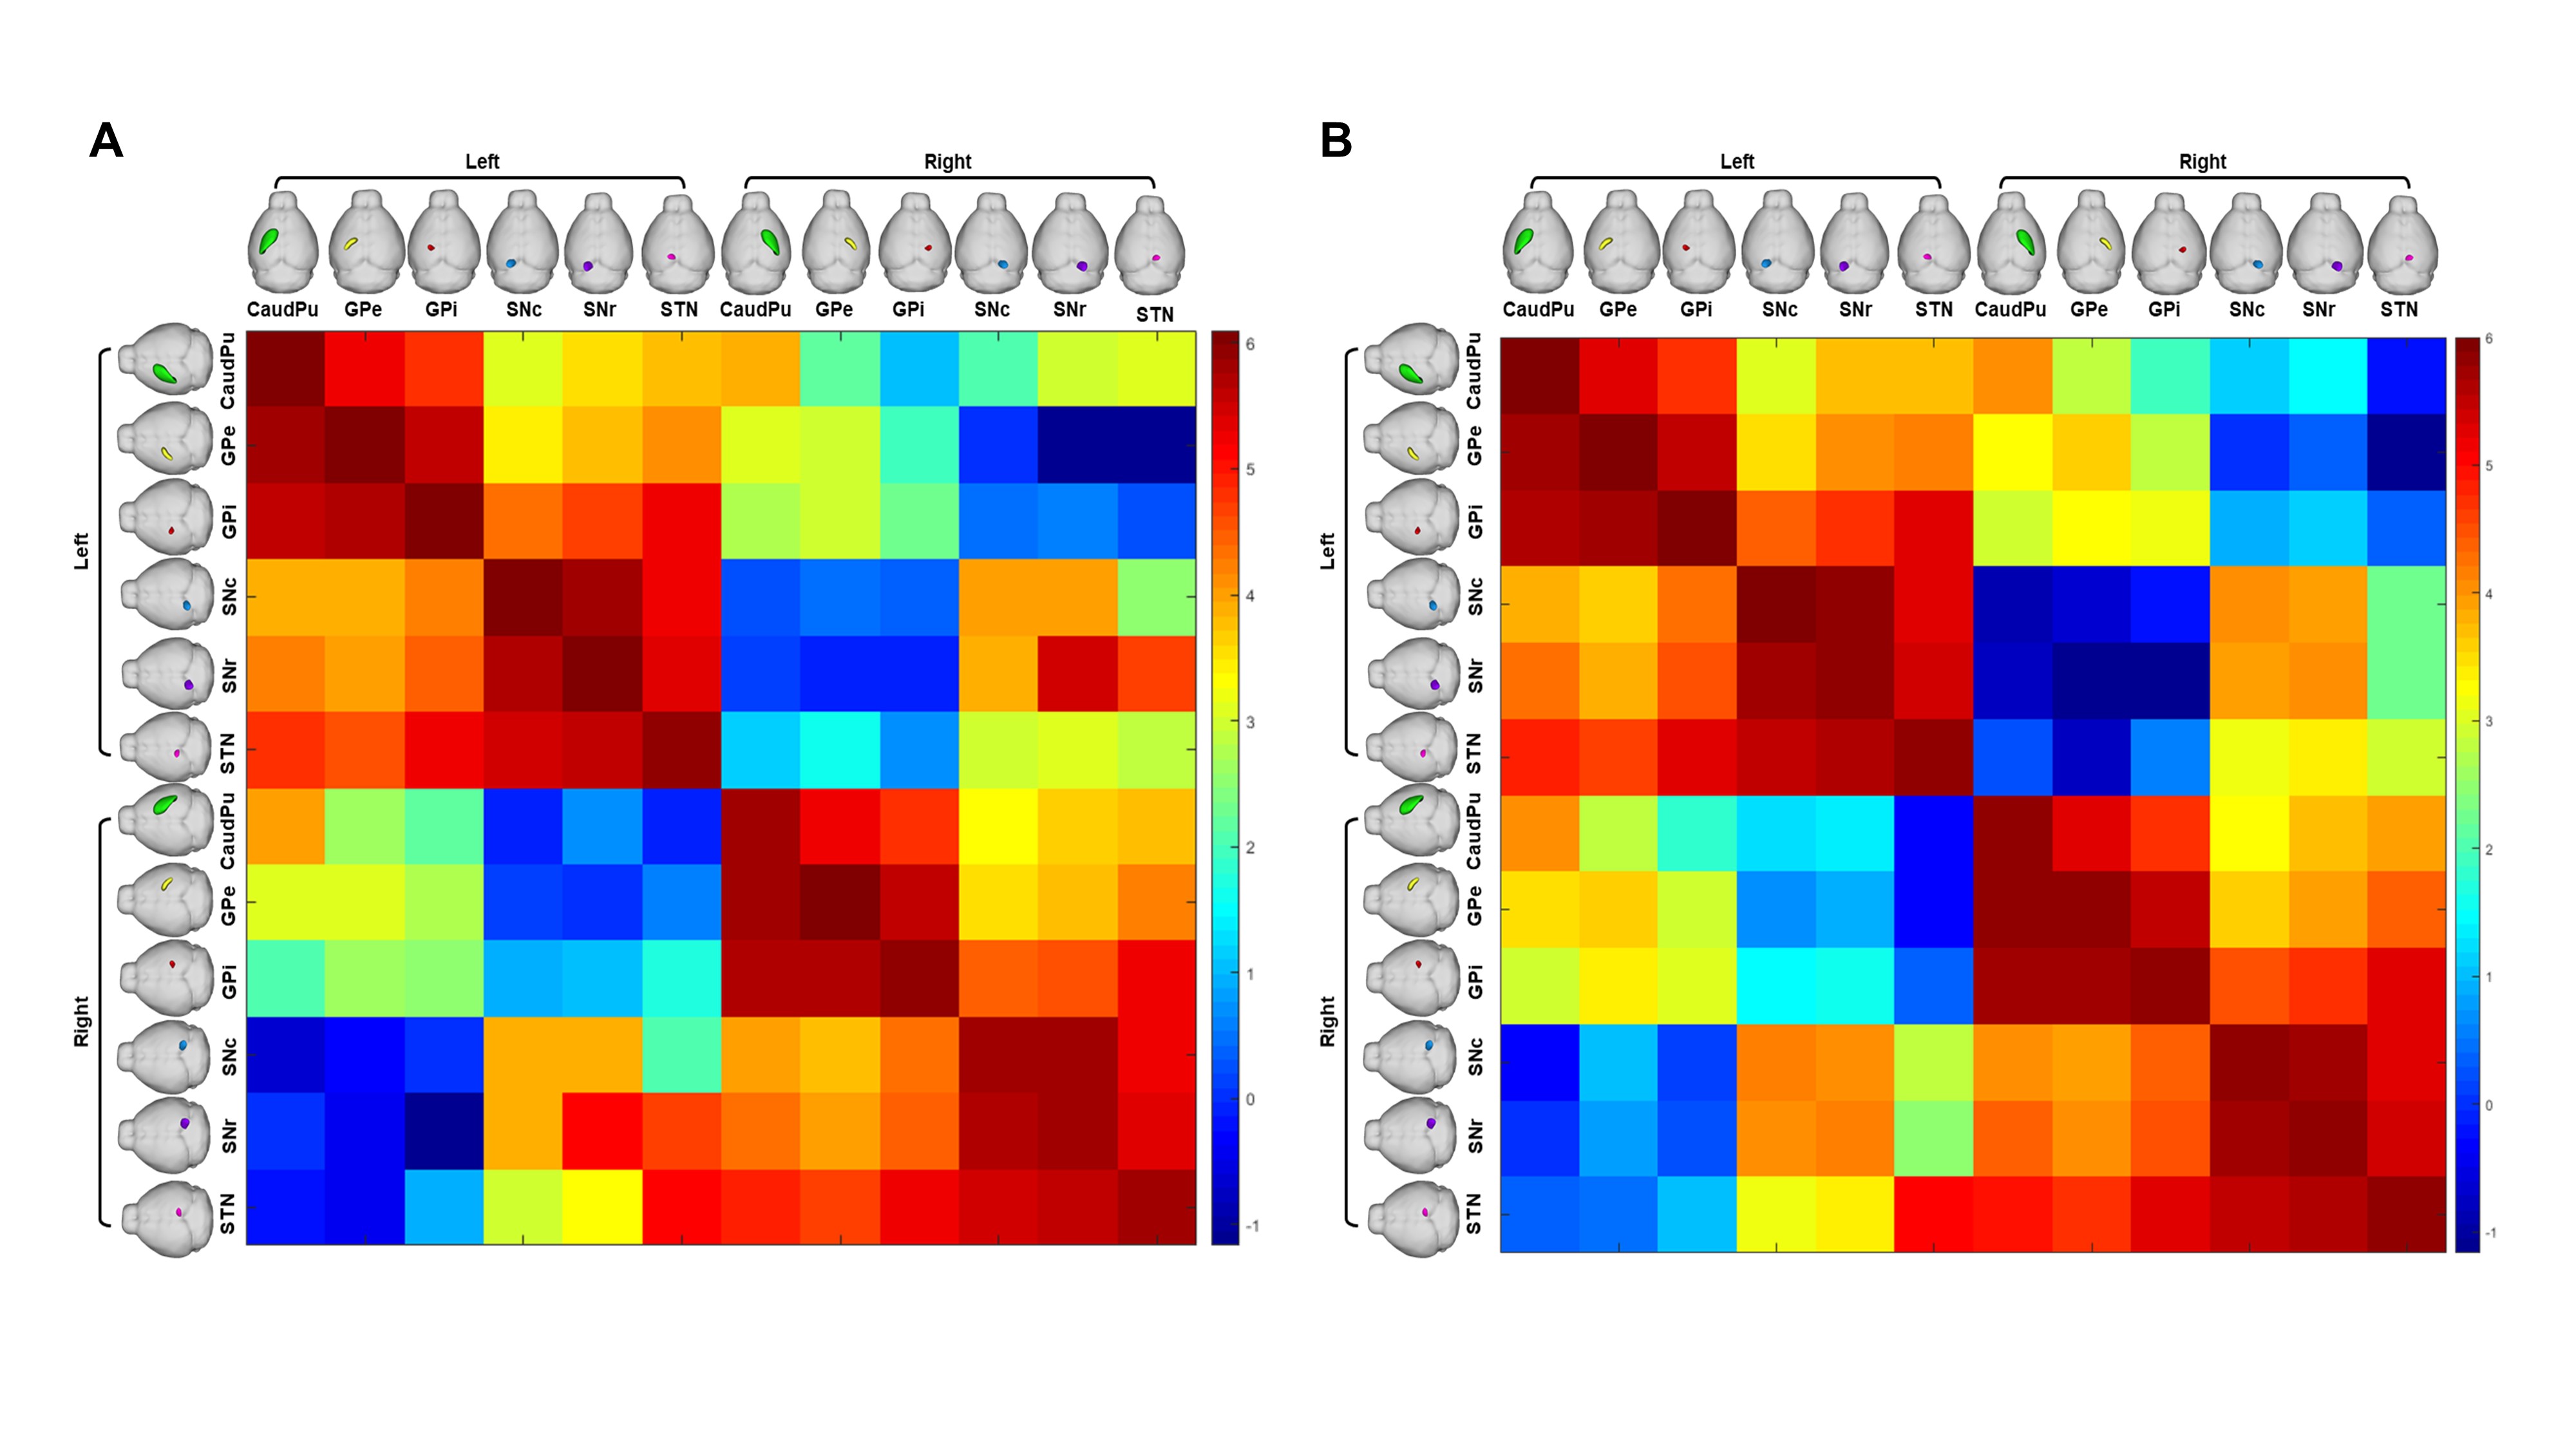
Figure
2. A
probabilistic tractography
connectivity matrix between seven anatomic regions (STN, SNr,
SNc,
GPe,
GPi
and caudoputamen)
displayed with a log10 scale color map for normal (A) and PD-induced mouse (B)
model. The seed regions and the target regions were anatomically located within
the 3D rendered mouse, with the seed region on the left and the target region
on the top. [caudoputamen:
green, GPe:
yellow, GPi:
red, STN: pink, SNc: blue, SNr:
purple]
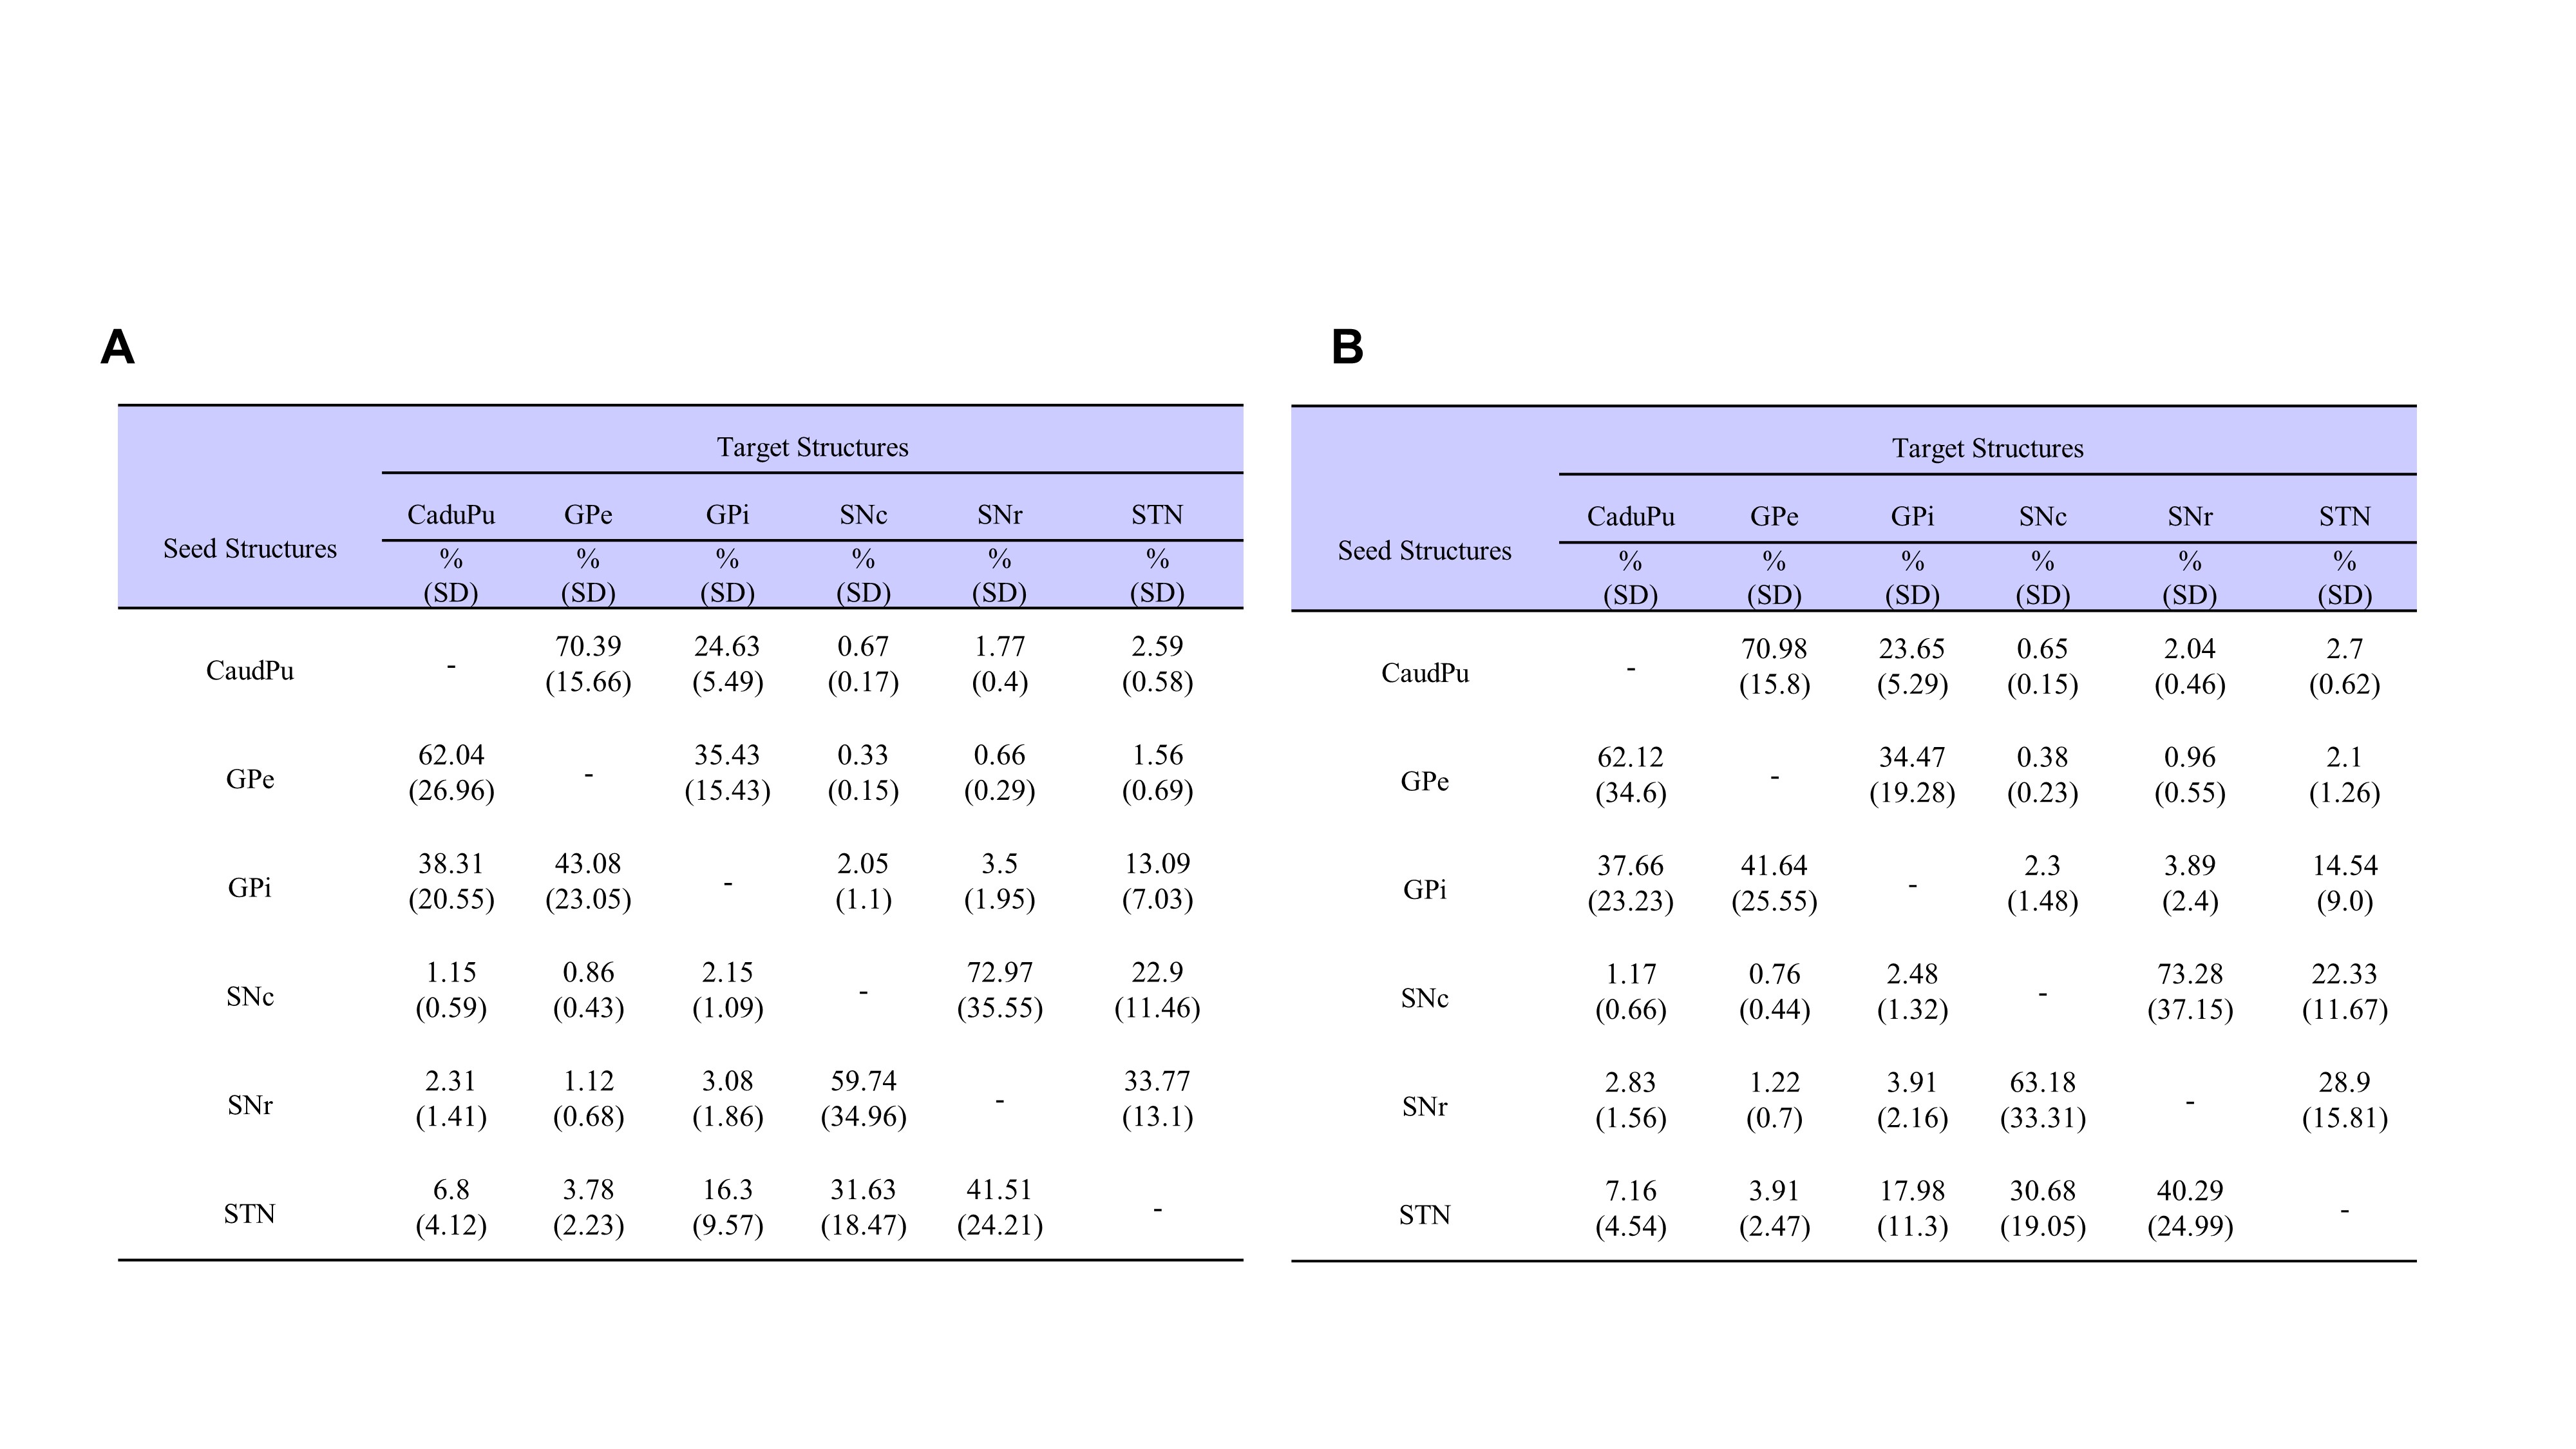
Figure3. Percentage of fibers
directly connecting each structure. (A)
control, (B) 6-OHDA induced PD model.
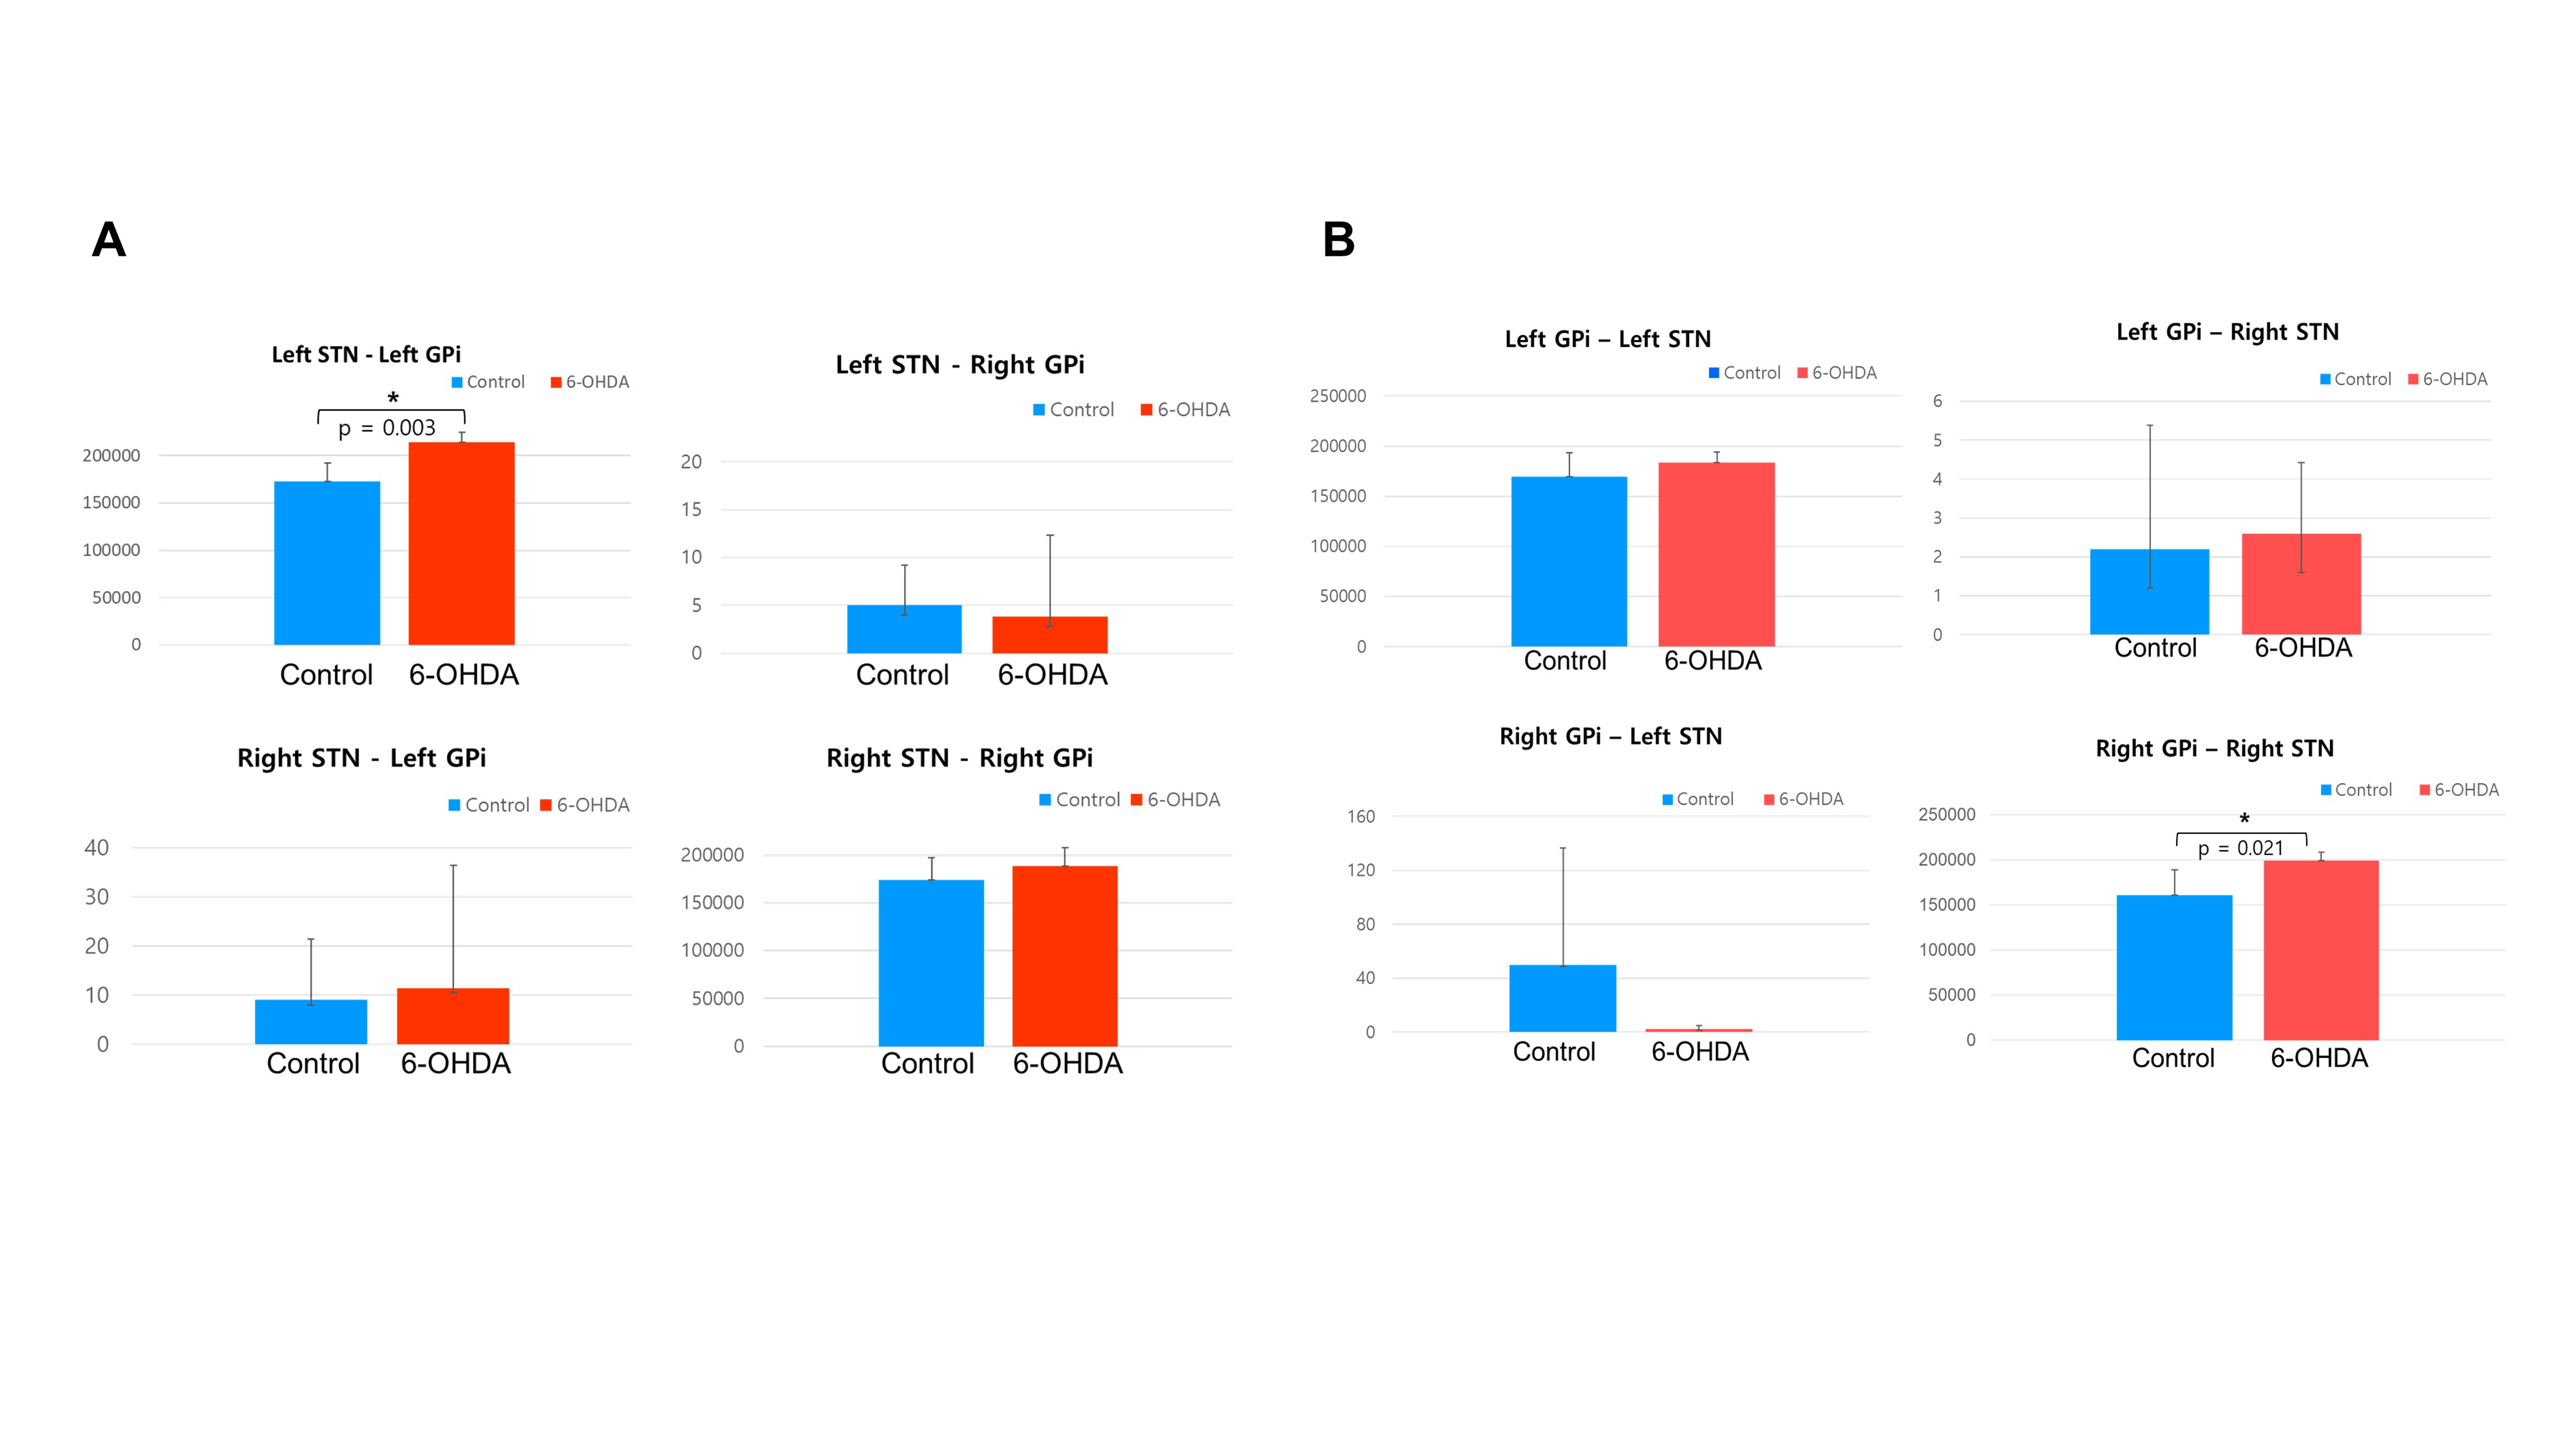
Figure4. Significant fiber connectivity
of the STN-GPi and Gpi-STN between control and 6-OHDA groups.
White matter pathways identified using diffusion MRI probabilistic tractography. (A) Seed region: STN; target region: Gpi, (B)
Seed region: GPi,
target region: STN.
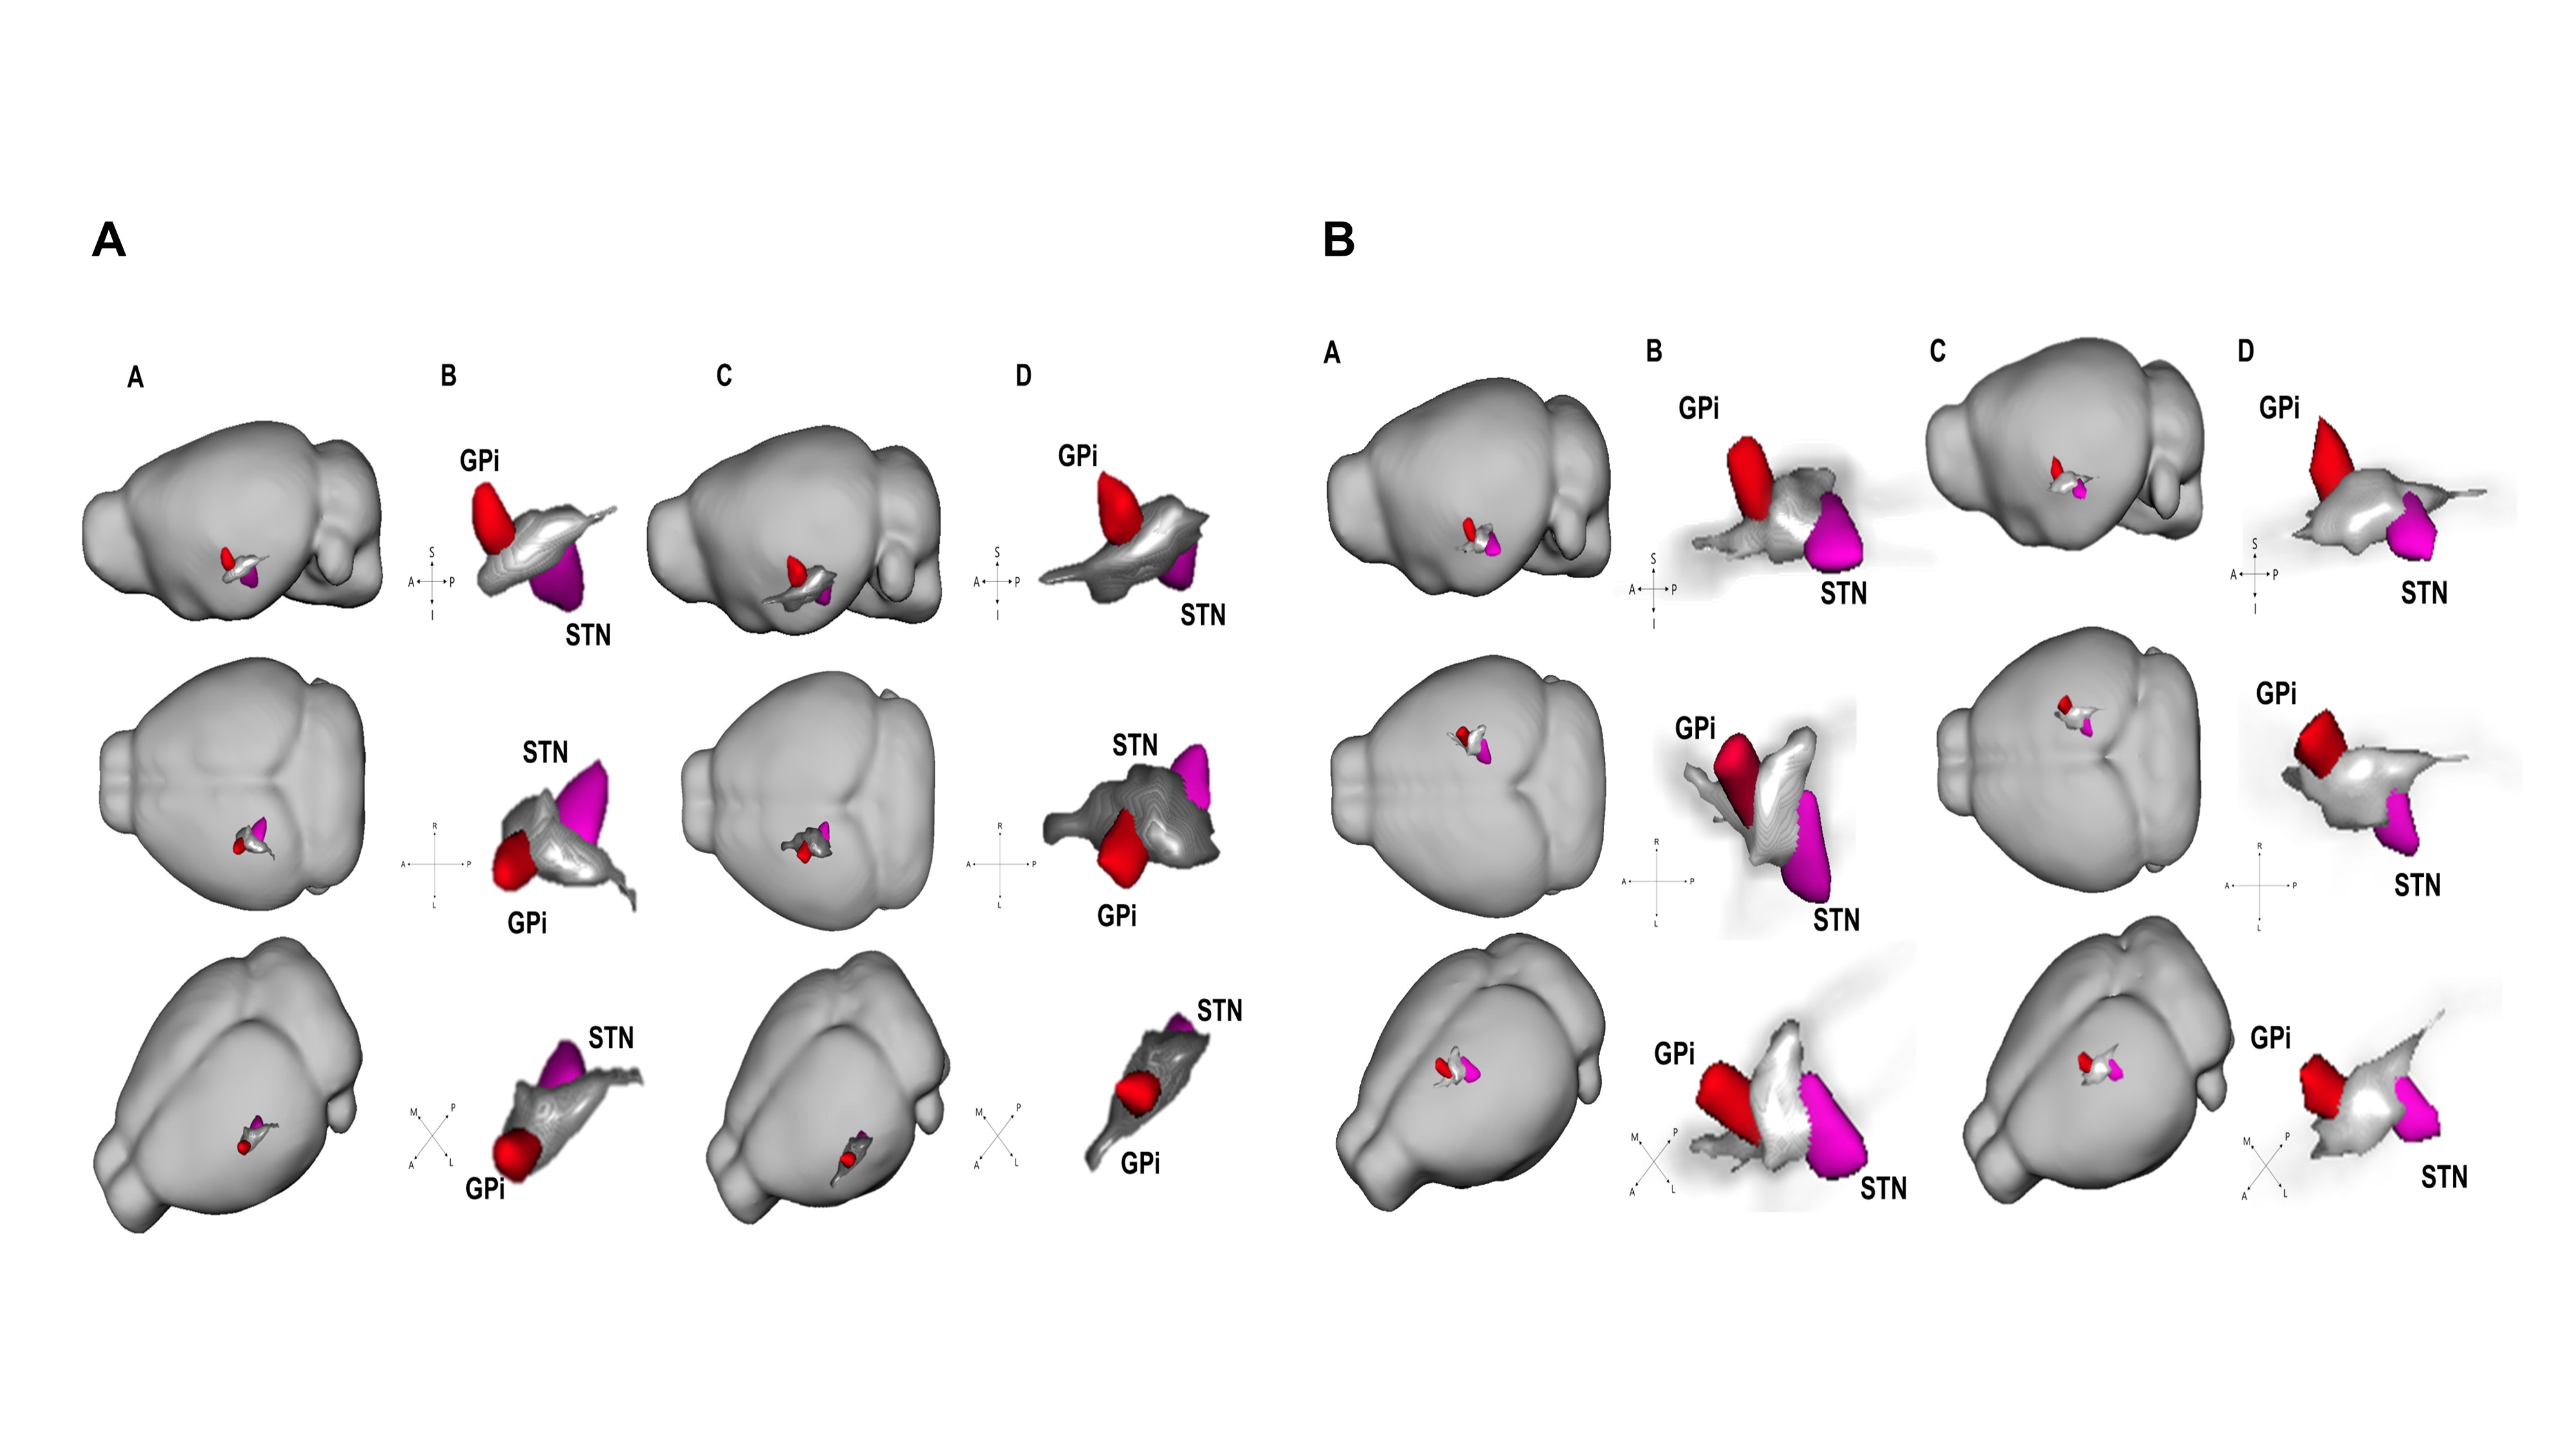
Figure 5.
Reconstruction of fiber pathway of the STN-GPi (A) and GPi-STN (B). A-A,B: control, A-C,D: 6-OHDA;
B-A,B: control, B-C,D: 6-OHDA.