4479
Comparison of interconnected basal ganglia probabilistic tractography between 3T and 7T MRI Images1Gachon University, Incheon, Republic of Korea
Synopsis
Basal ganglia structures, globus pallidus internal, globus pallidus external, subthalamic nucleus, substantia nigra, red nucleus and striatum were automatically segmented on 3T and 7T HCP preprocessed diffusion weighted images. Connectivity between each basal ganglia structure was observed using probabilistic tractography generated with FSL's diffusion tools such as BEDPOSTX and PROBTRACKX. Tractography between basal ganglia was compared between 3T and 7T to observe differences that arise from tradeoffs of each acquisition.
Introduction
Certain basal ganglia nuclei, such as the subthalamic nucleus (STN) and the globus pallidus internal (GPi) have been common and effective targets in deep brain stimulation (DBS) surgery for Parkinson's disease treatment1. As such, accurate segmentation of basal ganglia structures is crucial in documenting the correct locations of intended DBS target in relationship to basal ganglia nuclei as well as to interconnected white matter pathways. Additionally, detailing the structural connectivity between basal ganglia nuclei can be beneficial in studying the effects of both Parkinson's disease and Parkinson's disease treatments. For this study, Lead-DBS, a MATLAB based toolbox, is used to segment globus pallidus external (GPe), GPi, STN, substantia nigra (SN), red nucleus (RN) and the striatum2. Subsequently, probabilistic tractography between the segmented structures were generated through PROBTRACKX from the FMRIB software library (FSL) using 3T and 7T diffusion weighted images3. The results of tractography on 3T and 7T diffusion images were compared to describe the differences that arise due to tradeoffs of each acquisition.Methods
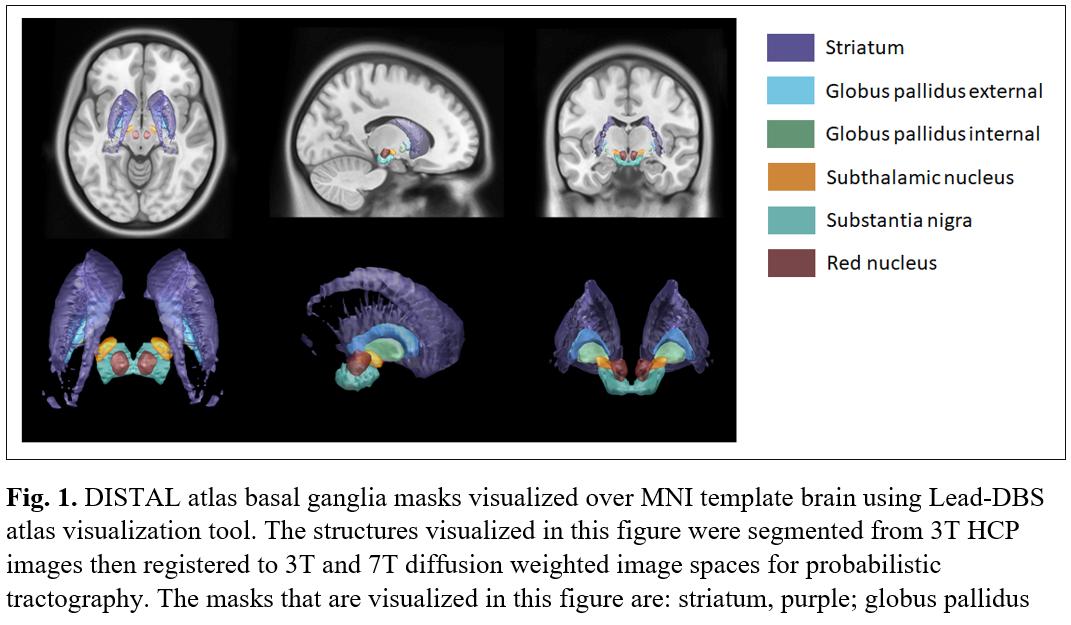
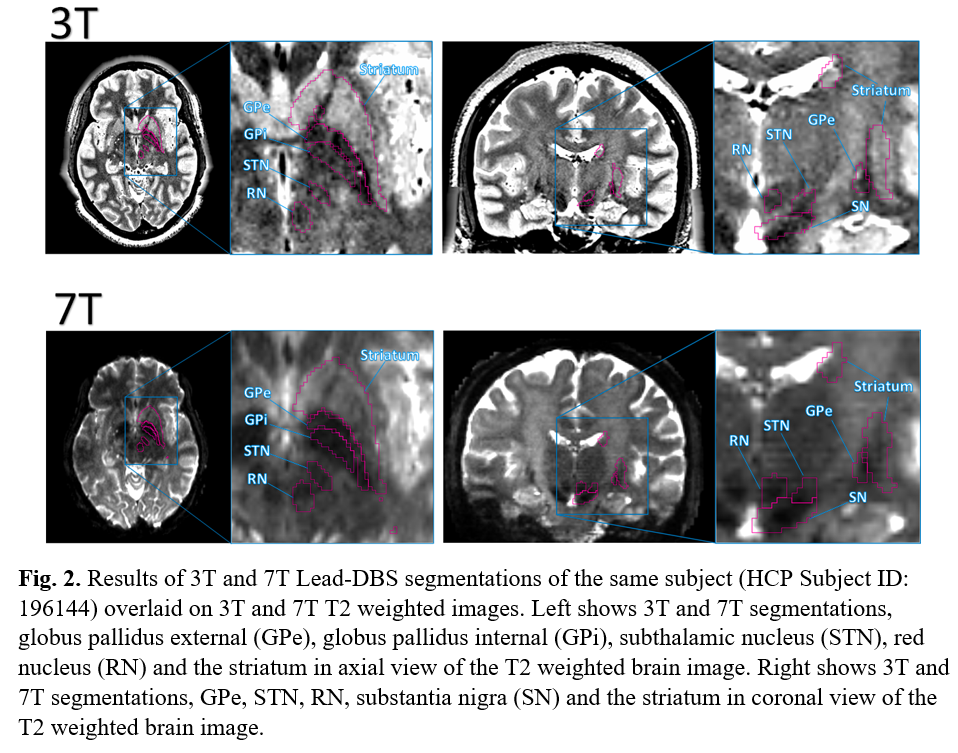
3T MRI T1-weighted, T2-weighted images, and 3T, 7T diffusion images from Human Connectome Project (HCP), all of which were preprocessed using the HCP preprocessing pipeline were used in this study4,5. Lead-DBS segmentation of left hemisphere basal ganglia structures, GPe, GPi, STN, SN, RN and the striatum was done through ANTs normalization of the DISTAL atlas on T1w and T2w images6. The results of segmentations were overlaid on top of T2 images, where intensities of segmentation targets are slightly visible, to check for accuracy as shown in Figure 1. Each segmented structure was registered through SPM12 to its respective subject's 3T and 7T diffusion MRI data, which had already gone preprocessing through eddy correction and BEDPOSTX7,8. Following the registration, probabilistic tractography of each registered structure and between registered structures were generated through PROBTRACKX9. The number of fiber tracks generated from 3T and 7T diffusion images of each subject were averaged then compared.Results
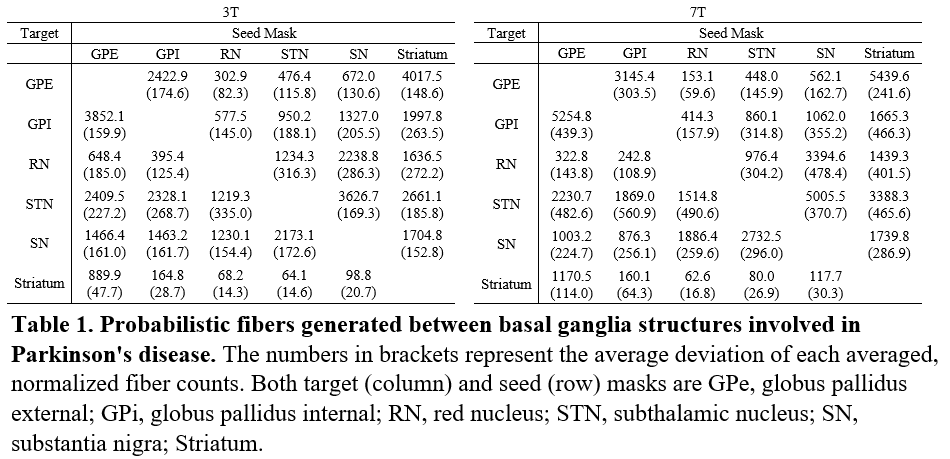
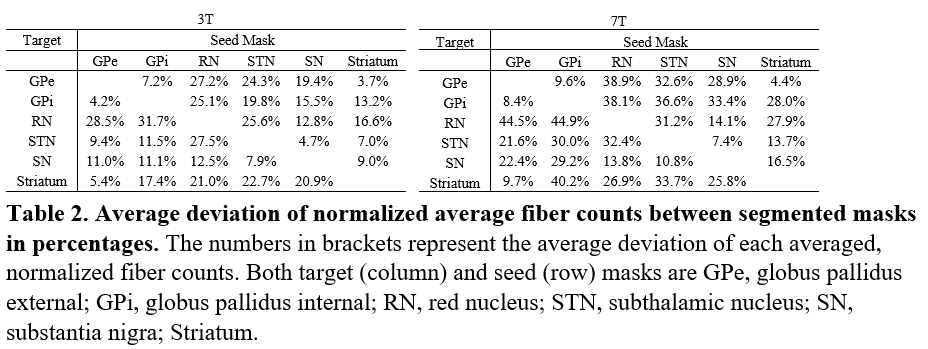
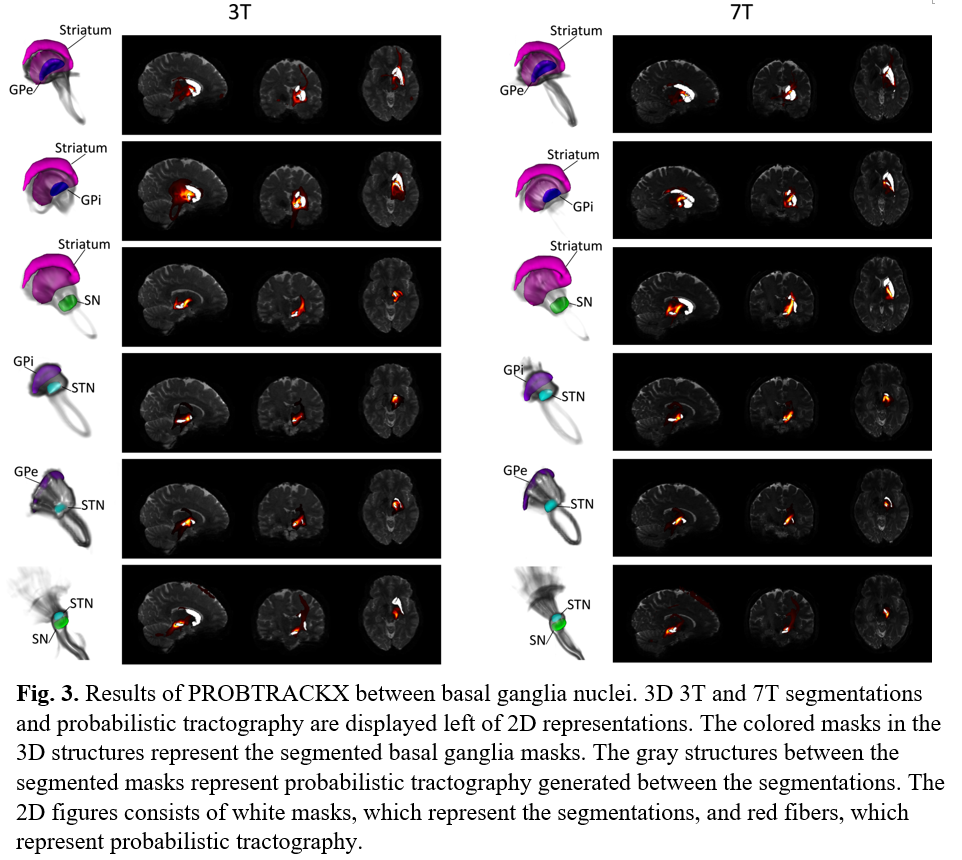
Figure 1 shows the 6 regions segmented by Lead-DBS. Figure 2 shows each segmented structure that were overlaid on top of 3T and 7T T2w images for validation matched the intensities of segmentation targets, confirming that segmentation was mostly successful. Table 1 shows the normalized averages of fiber counts and Table 2 shows the average deviations of normalized fiber counts between segmentations generated from 3T and 7T diffusion weighted images. Highest number of normalized averages of fiber counts (striatum, GPe; 5489.6) were generated from 7T images and average deviation of fiber counts from 3T images were generally lower than average deviation of fiber counts from 7T images. 3D and 2D representations of fibers generated by PROBTRACKX are shown in Figure 3.Discussion
Parkinson's disease pathology involves the death of dopamine producing neurons in the substantia nigra, which disrupts the downstream pathways of the basal ganglia structures regulated by dopamine. In addition, previous studies have shown that deep brain stimulation of subthalamic nucleus have shown increased connectivity strength of surrounding white matter tracts10. It is possible that analyzing the interconnectivity of white matter tracts between basal ganglia nuclei can help detect biomarkers that designate the progression of Parkinson's disease as well as results of treatments for Parkinson's disease. Tractography between basal ganglia nuclei were compared between 3T and 7T HCP acquisitions. The 7T acquisition had higher spatial resolution (1.05mm isotropic for 7T, 1.25 isotropic for 3T) at the cost of lower gradient strength (70 mT/m for 7T, 100 mT/m for 3T). The tradeoffs in acquisition parameters showed that interconnectivity between basal ganglia nuclei in 3T images had lower average deviation of normalized fiber counts than in 7T images. However, most nuclei pairs had more fibers generated with 7T images than with 3T images. It is possible that higher spatial resolution of 7T enhanced fiber generation between basal ganglia nuclei but suffered from consistency due to lower angular contrast than 3T images. Additionally, the fibers that were generated from 7T images showed more detail and creases of fiber tracts than fibers generated from 3T images. As more studies utilize higher field acquisitions, it would be beneficial to account for such differences that arise due to differences in acquisitions when comparing results of basal ganglia connectivity.Conclusion
This study shows that segmenting basal ganglia nuclei and generating probabilistic tractography between the segmentations are possible for quantifying structural interconnectivity. Additionally, the comparison between 3T acquisitions with higher angular contrast and 7T acquisitions with higher spatial resolution showed that fibers generated from 7T acquisitions results in higher average deviation of fiber counts but with increased fiber generation between basal ganglia nuclei than from 3T acquisitions. Future studies can be done using a similar pipeline to observe basal ganglia interconnectivity of Parkinson's disease patients as well as deep brain stimulation treated subjects.Acknowledgements
Data were provided [in part] by the Human Connectome Project, WU-Minn Consortium (Principal Investigators: David Van Essen and Kamil Ugurbil; 1U54MH091657) funded by the 16 NIH Institutes and Centers that support the NIH Blueprint for Neuroscience Research; and by the McDonnell Center for Systems Neuroscience at Washington University.
This research was supported by the Brain Research Program through the National Research Foundation of Korea (NRF) funded by the Ministry of Science and ICT (NRF-2017M3C7A1044367).
References
1. Krause M, Foge, W, Heck A, et al. Deep brain stimulation for the treatment of Parkinson's disease: subthalamic nucleus versus globus pallidus internus. Journal of Neurology, Neurosurgery & Psychiatry 2001;70(4): 464-470.
2. Horn A and Kühn AA. Lead-DBS: a toolbox for deep brain stimulation electrode localizations and visualizations. Neuroimage 2015;107:27-135.
3. Behrens TE, Berg HJ, Jbabdi S, et al. Probabilistic diffusion tractography with multiple fibre orientations: What can we gain?. Neuroimage 2007;34(1):144-155.
4. Van Essen DC, Smith SM, Barch DM, et al. The WU-Minn human connectome project: an overview. Neuroimage 2013;80:62-79.
5. Glasser MF, Sotiropoulos SN, Wilson JA, et al. The minimal preprocessing pipelines for the Human Connectome Project. Neuroimage 2013;80:105-124.
6. Avants BB, Epstein CL, Grossman M, Gee JC. Symmetric diffeomorphic image registration with cross-correlation: evaluating automated labeling of elderly and neurodegenerative brain. Medical image analysis. 2008; 12:26-41.
7. Andersson JL, Sotiropoulos SN. An integrated approach to correction for off-resonance effects and subject movement in diffusion MR imaging. Neuroimage 2016;125:1063-1078.
8. Jbabdi S, Sotiropoulos SN, Savio AM, et al. Model‐based analysis of multishell diffusion MR data for tractography: How to get over fitting problems. Magnetic Resonance in Medicine. 2012;68(6):1846-1855.
9. Behrens TE, Woolrich MW, Jenkinson M, et al. Characterization and propagation of uncertainty in diffusion‐weighted MR imaging. Magnetic Resonance in Medicine: An Official Journal of the International Society for Magnetic Resonance in Medicine. 2003;50(5):1077-1088.
10. Van Hartevelt TJ, Cabral J, Deco G, Møller A, Green AL, Aziz TZ, Kringelbach ML. Neural plasticity in human brain connectivity: the effects of long term deep brain stimulation of the subthalamic nucleus in Parkinson’s disease. PloS one. 2014; 9:e86496.
Figures