4476
Longitudinal white matter changes in the callosal subsections in Parkinson’s Disease using connectivity-based parcellation.1Department of Radiology, The Second Affiliated Hospital, Zhejiang University School of Medicine, Hangzhou, China, 2Department of Neurology, The Second Affiliated Hospital, Zhejiang University School of Medicine, Hangzhou, China
Synopsis
Corpus callosum (CC) is the most important association fiber intrinsically connecting with different cortical regions. Studies reported the CC and its subsections could be used to differentiate different phenotypes in PD, PD and PDS. In this study, 39 PD patients with a mean time interval of 21m and 82 NC were recruited. We segmented the whole CC into five subsections according to their functional connectivity with predefined cortices. As a result, we observed that the microstructure and structure were fairly preserved in PD at baseline, but widespread changes occur in the corpus callosum during PD evolvement.
Purpose
Corpus callosum (CC) is the largest bundle between hemispheres. Different subsections are connecting with different cortical subregions mediating motor [1], and cognition [3] functions in Parkinson’s disease (PD). The timing of development and impairment in CC was different but all sequential [4], which means the function of subsections is differential. Studies reported the different changes in CC could be used to differentiate PD with different phenotypes [1], PD and PDS [2]. Connectivity-based parcellation separates the whole CC into functionally relevant subdivisions for precise mapping of its tract within subjects, which better reflects the anatomy than traditional geometric definition. Therefore, this study aimed to investigate the white matter changes in connectivity-based callosal subsections and their longitudinal alterations in PD and further clarify the contributions of the different subsections to clinical variables.Methods
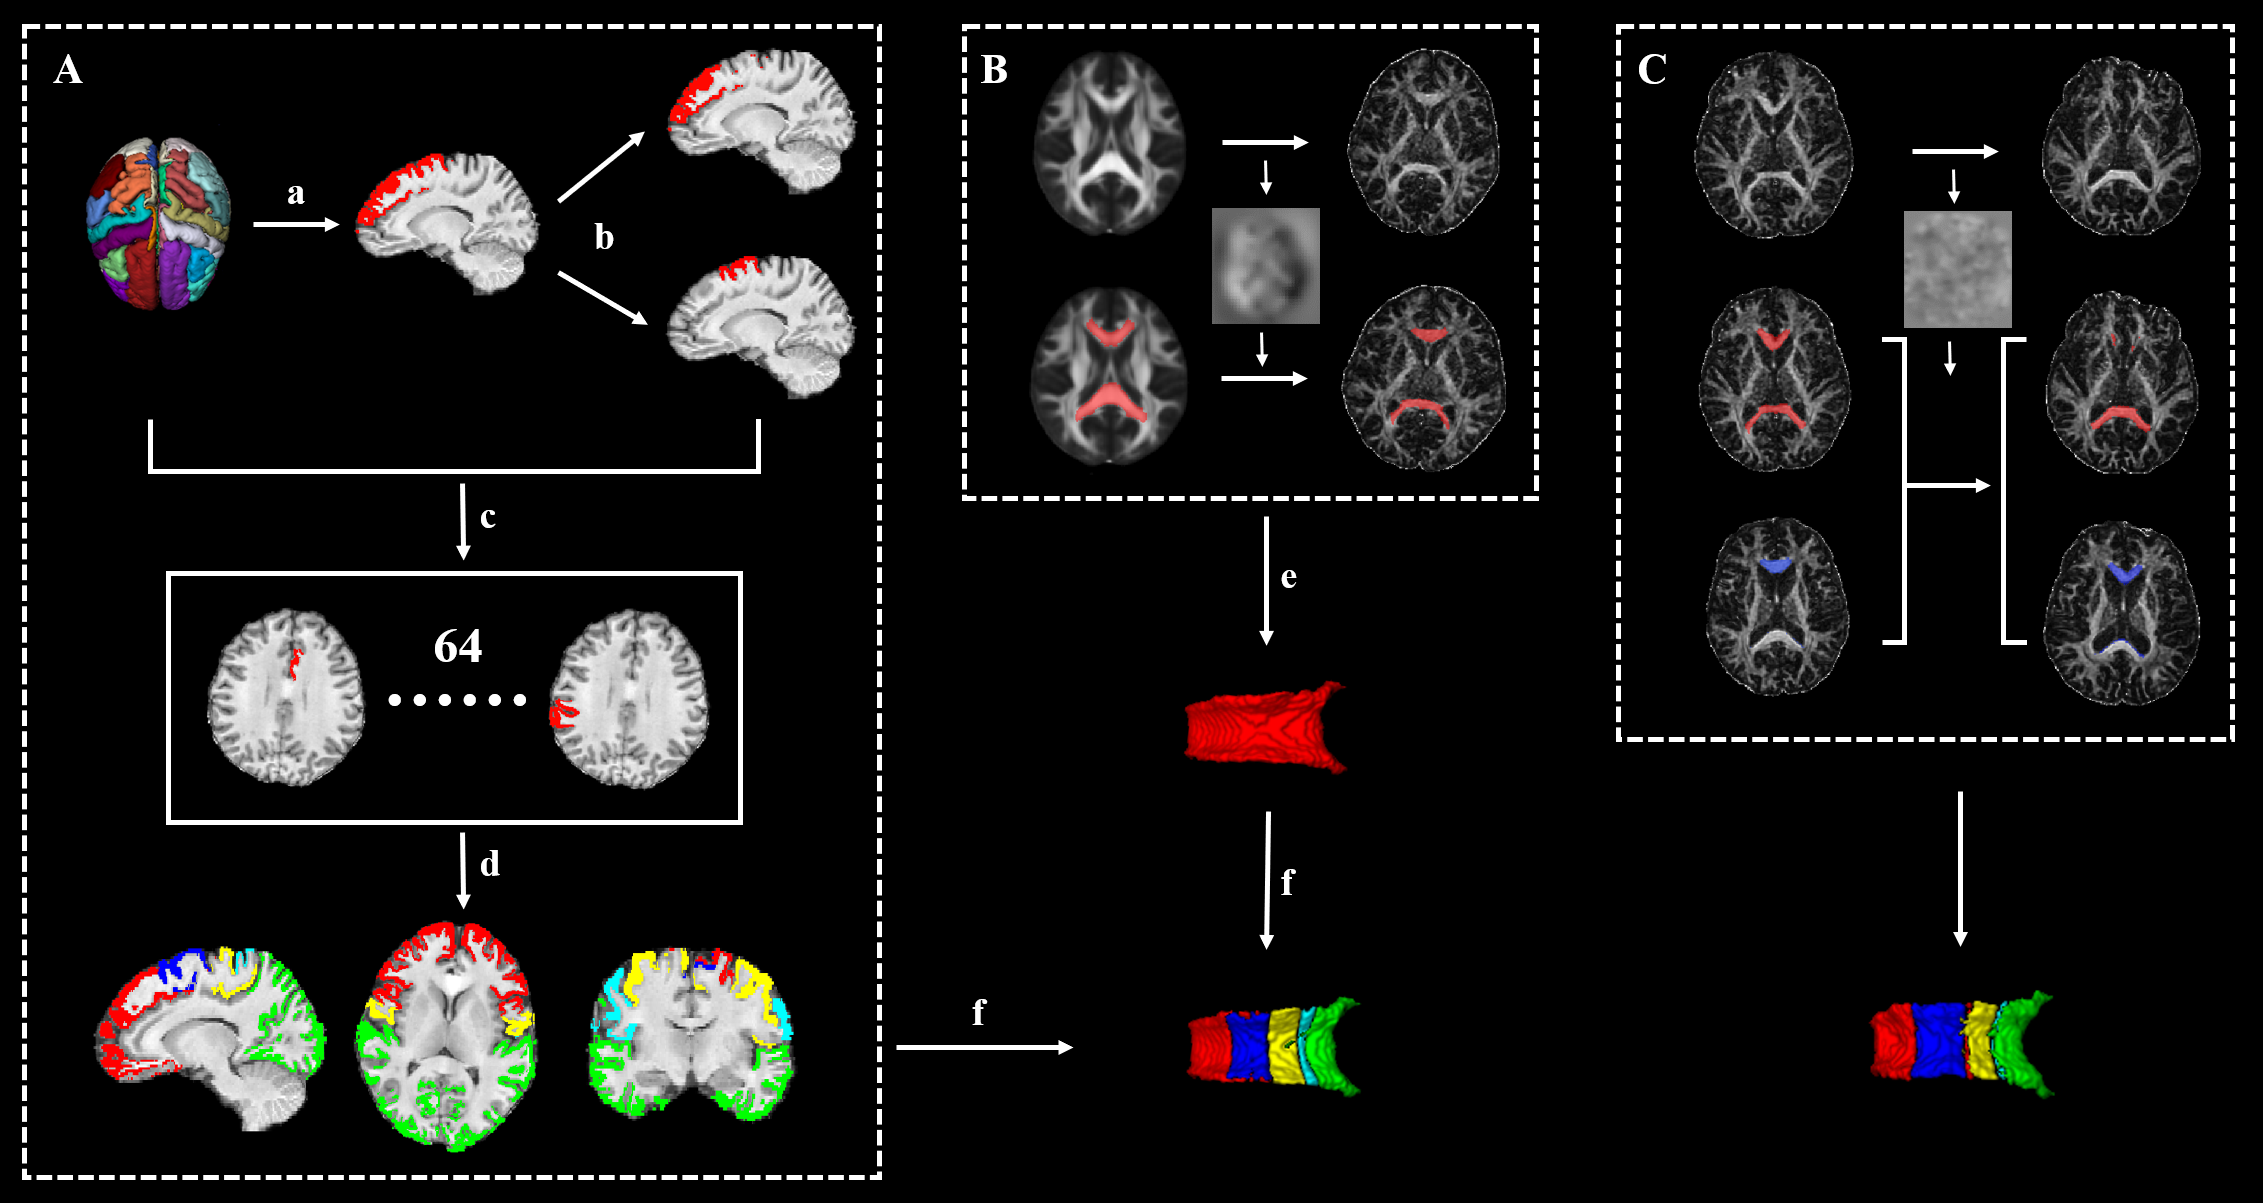
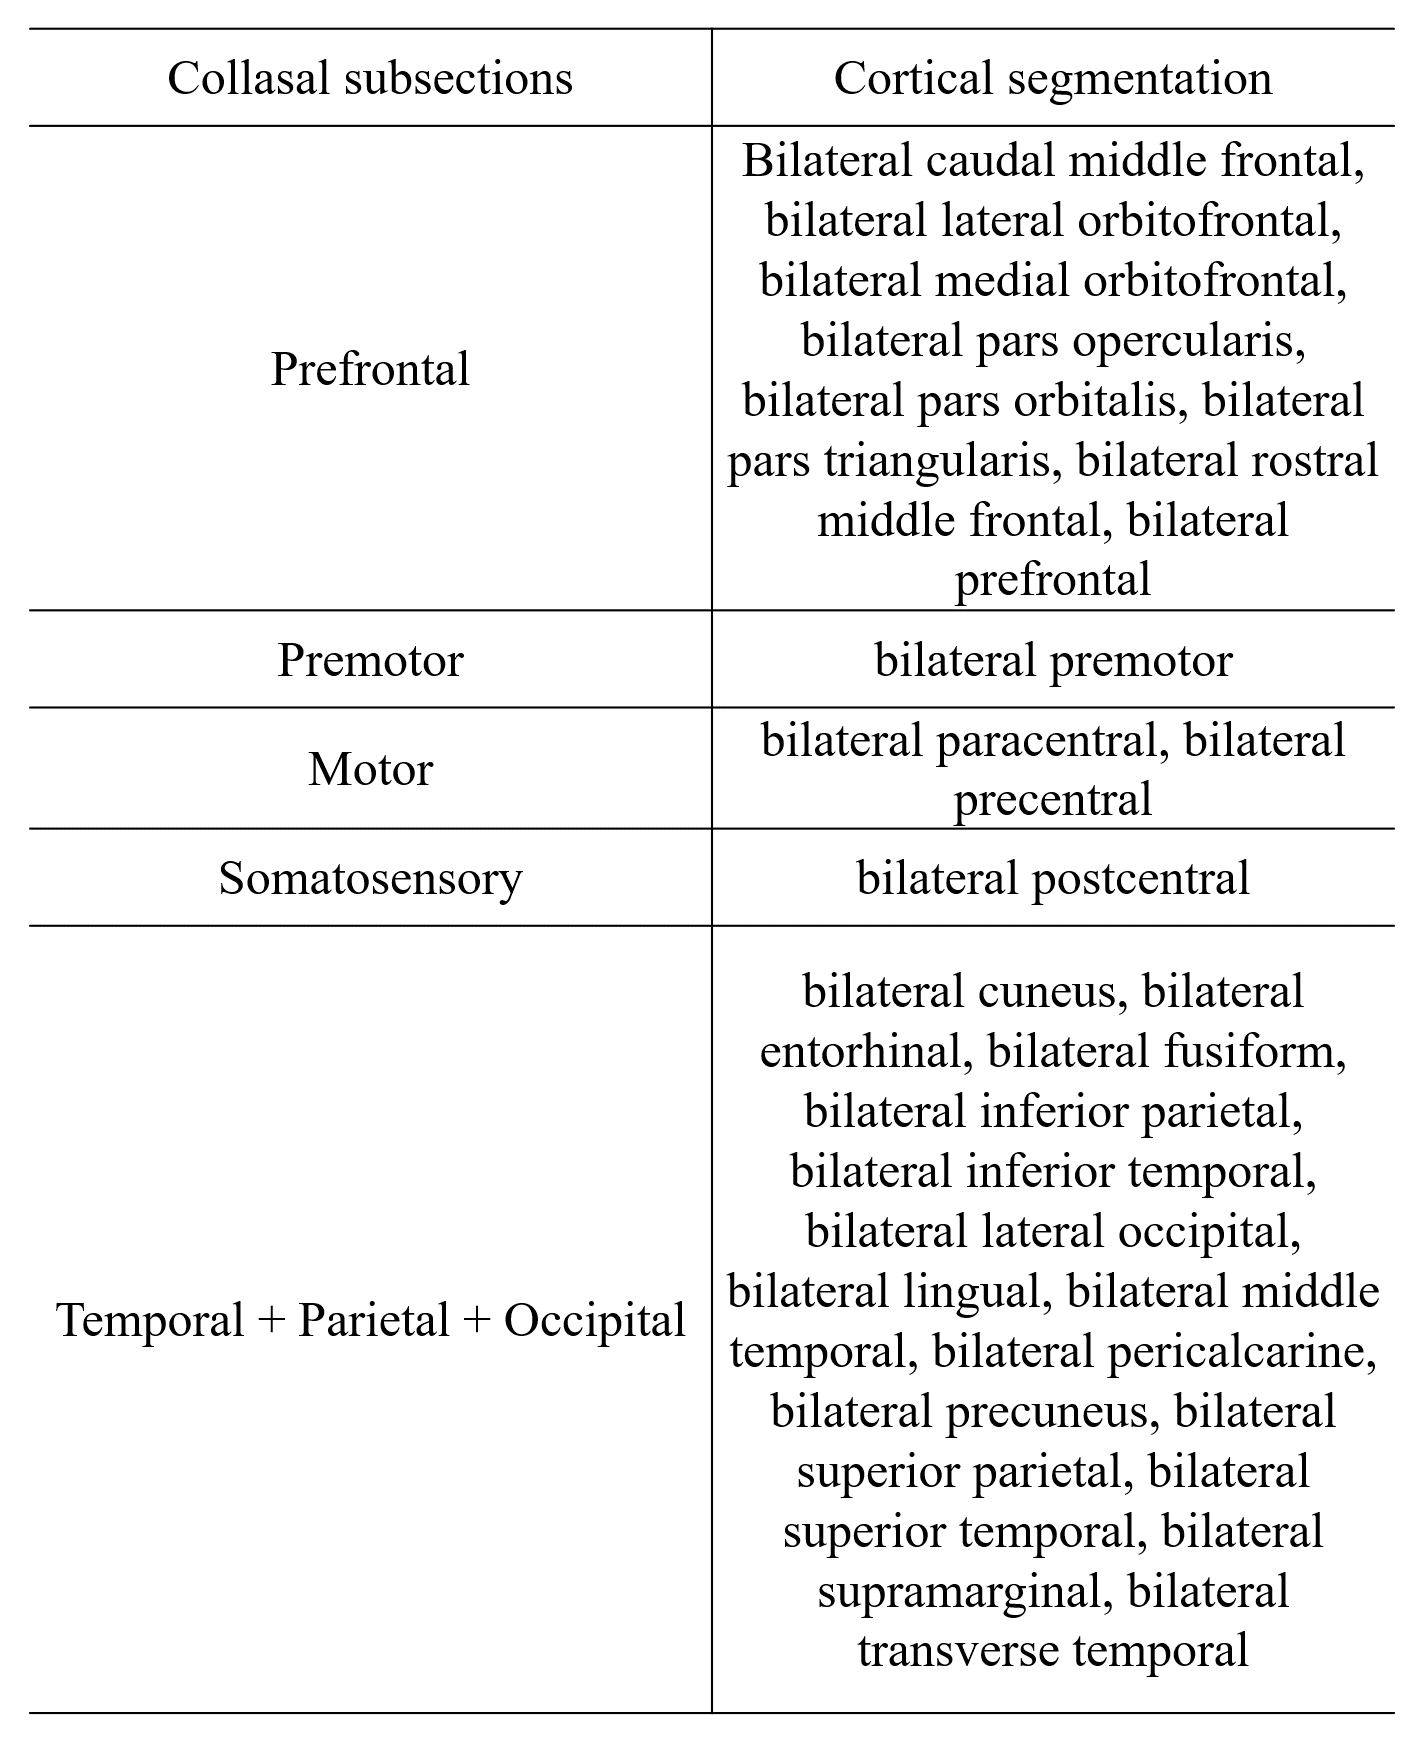
Thirty-nine PD patients and 82 normal control participants (NC) underwent Diffusion-tensor Imaging (DTI) scans (gradient recalled echo-echo planar imaging sequence with 32 gradient directions; b value = 1000 s/m2; resolution = 2 × 2 × 2 mm3; slice gap = 0 mm; 67 interleaved axial slices) , T1 scans (Fast Spoiled Gradient Recalled sequence; field of view = 260 × 260 mm 2; matrix = 256 × 256; slice thickness = 1.2mm; 196 continuous sagittal slices) and clinical evaluations, then clinical domain (motor, mood, sleep, disability, cognition) z scores were calculated. All these patients were longitudinally reexamined with a mean time interval of 21m. DTI images were preprocessed by the Pipeline for Analyzing braiN Diffusion images (PANDA) toolbox (PANDA_1.3.1_64, http://www.nitrc.org/projects/panda/) [5], including brain extraction, eddy-current-induced distortion correction, head-motion artifacts correction and diffusion parameter maps generation. Then, BedpostX was performed to estimate the probabilistic distribution of fiber orientations from each voxel. T1 images were preprocessed by Advanced Normalization Tools (ANTs) [6], including intensity inhomogeneity correction (N4 bias correction), brain tissue extraction, SyN diffeomorphic image co-registration, and tissue segmentation, which has been proven to have superior performance over the Freesurfer pipeline [7]. Afterwards, a total of 62 cortical segmentations were obtained by employing Desikan-Killiany-Tourville (DKT) cortical labeling protocol [7] for each subject. Of note, premotor gyrus and prefrontal gyrus were separated from the superior frontal gyrus defined by DKT atlas with the use of standard premotor gyrus in anatomical automatic labeling (AAL) atlas. As such, 64 cortical segmentations were acquired and then merged to 5 distinct segments (Figure 1A). Then, all cortical segmentations were transformed to diffusion space. For acquiring functionally relevant subdivisions for precise mapping of CC tract within subjects. Five subsections of the corpus callosum were established according to the tractography of callosal–cortical connectivity: subsection 1 (prefrontal), subsection 2 (premotor), subsection 3 (motor), subsection 4 (somatosensory), and subsection 5 (temporal + parietal + occipital) (Figure 2). The 3D CC was defined by the semi-automatic procedure (Figure 1B). First, the warp maps were obtained from FA in standard space transformed to individual native space, then applied to standard CC acquiring individual CC, which was then manually adjusted. Then, different CC voxels in each participant were classified into five classes according to the cortical region they mostly connected to (winner-take-all) [8]. The CC in follow-up was separated by the warp maps came from FA map in baseline individual native space transformed to follow-up native space and applied to callosal sections in baseline (Figure 1C). The fractional anisotropy (FA), mean diffusivity (MD), and volume of whole CC and its subsections were computed and compared between participants, with age, sex, education, and total intracranial volume (only for the comparisons of volume) as covariates. Linear regression analyses were further performed to evaluate the contributions of different subsections to clinical variables. Separate linear regression models were completed for each clinical domain with each imaging metrics (FA, MD, volume). The dependent variable was the clinical domain z score with age, sex and education as force-entered covariates in the first block and imaging metrics (each run independently) of the 5 callosal sections as stepwise-entered independent variables in the second block [9].Results
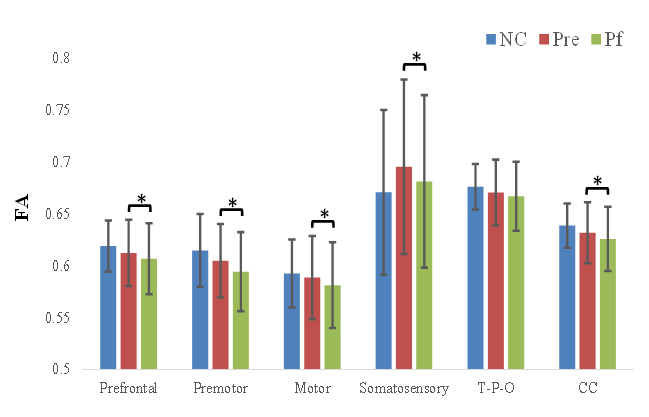
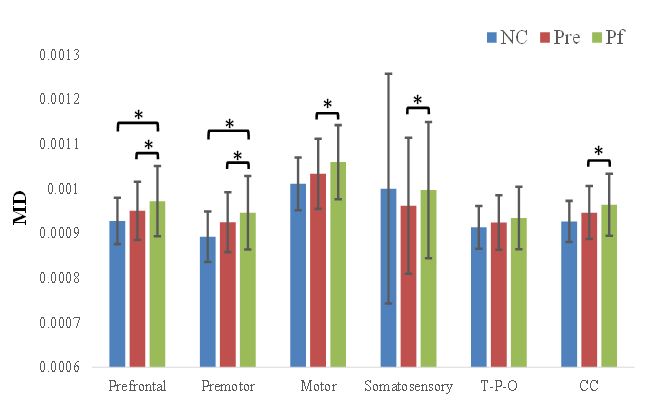
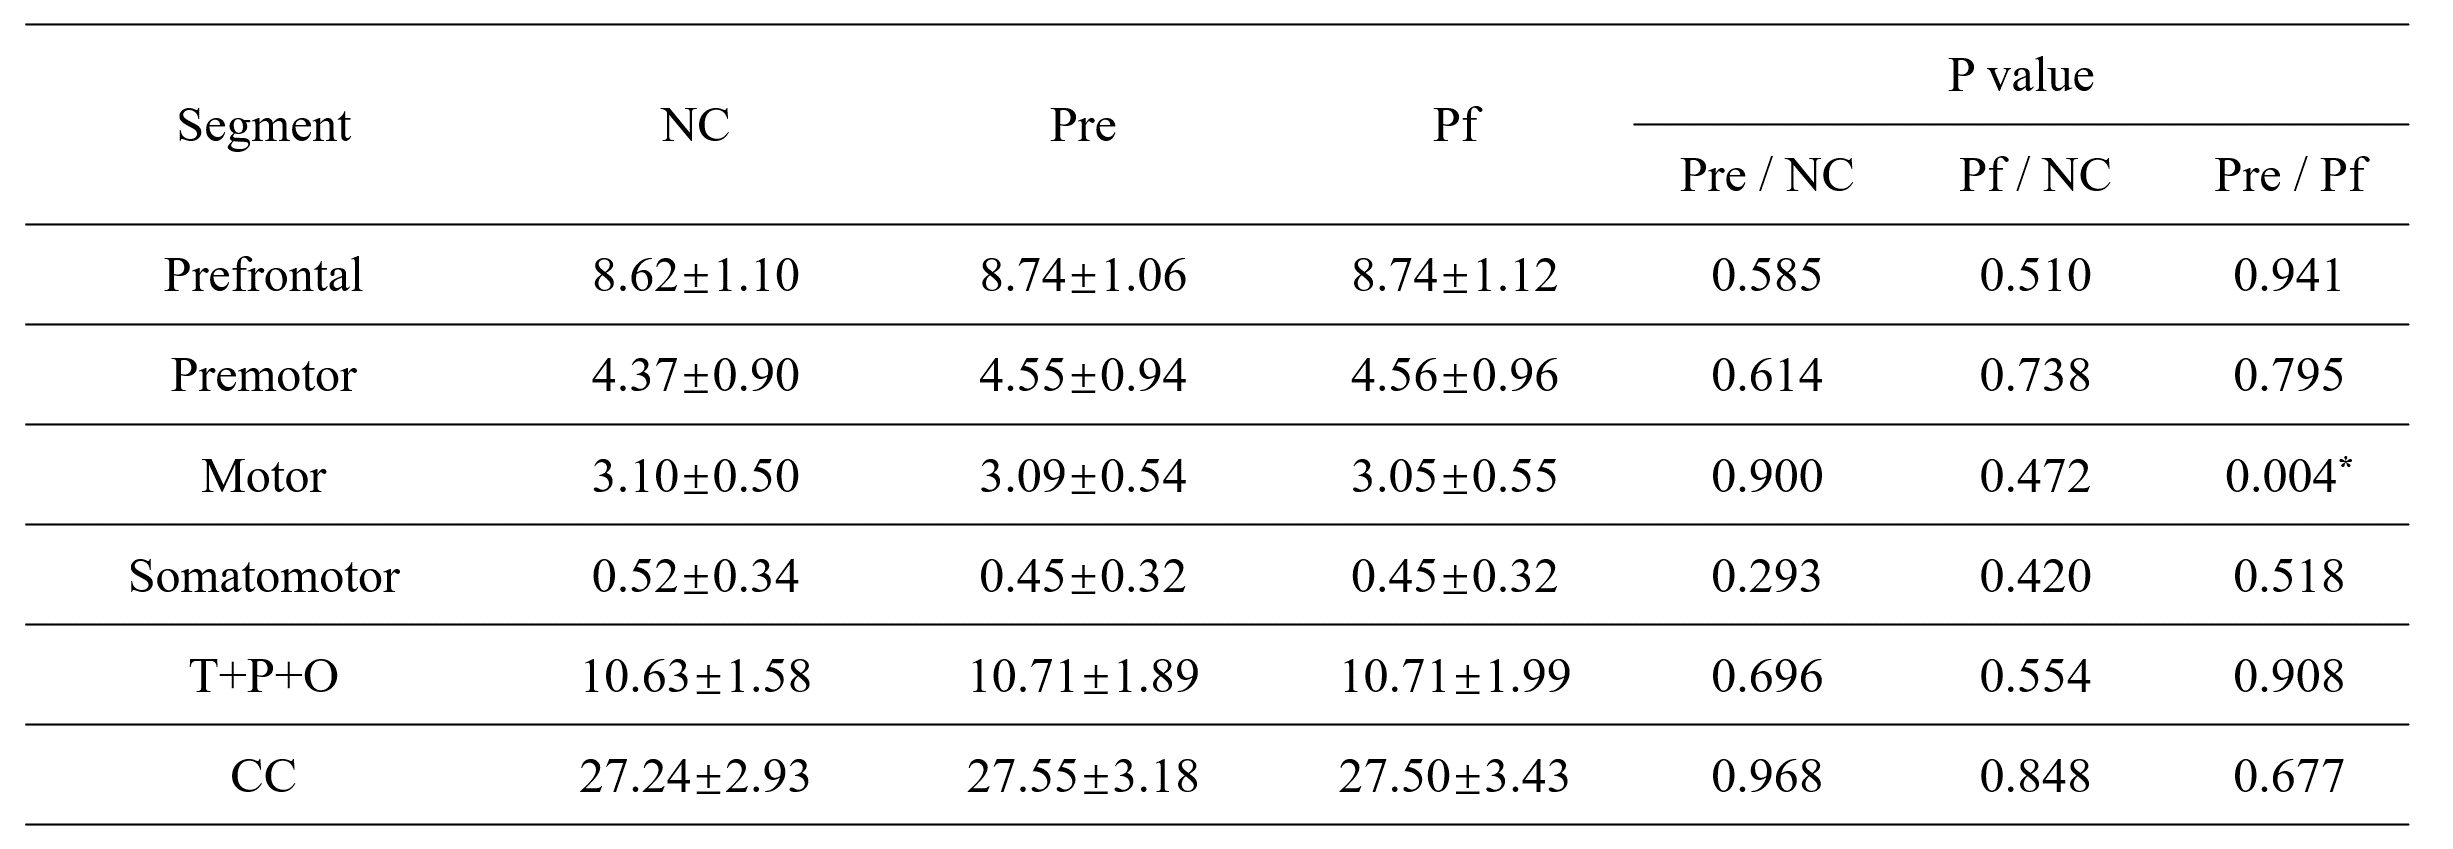
At baseline, no significant difference was observed between PD and NC, but MD was increased in prefrontal, and premotor section after follow-up compared with NC. More interestingly, with disease evolving, the reduction in FA, increment in MD of whole CC and its subsections including prefrontal, premotor, motor, and somatosensory were demonstrated, except the temporal + parietal + occipital subsection, and the volume was just decreased in the motor section (Figure 3, 4, 5). Reginal callosal characteristic attributed to clinical domain performance such that FA of temporal + parietal + occipital section, and volume of motor section were related with the mood domain, MD of prefrontal section was associated with the sleep domain.Conclusions
The microstructure and structure were fairly preserved in PD at baseline, which may on account of the patients we recruited was at relatively early pathological stage. After follow-up, the widespread microstructural and structural changes occur in the corpus callosum indicating pathological evolvement. The role corpus callosum plays is more important in the disease evolvement in PD, rather than the development. What’s more, different callosal sections possess specific contributions of reginal white matter characteristics to different clinical domains.Acknowledgements
This work was supported by the 13th Five-year Plan for National Key Research and Development Program of China (Grant No. 2016YFC1306600), the National Natural Science Foundation of China (Grant Nos. 81571654, 81701647 and 81771820), the Zhejiang Provincial Natural Science Foundation (NO. LSZ19H180001), the Fundamental Research Funds for the Central Universities of China (No. 2017XZZX001-01), the Projects of Medical and Health Technology Development Program in Zhejiang Province (2015KYB174), the 12th Five-year Plan for National Science and Technology Supporting Program of China (No. 2012BAI10B04). We thank all patients with Parkinson’s disease and normal controls who participated in this study.References
[1] Chan LL, Ng KM, Rumpel H, Fook-Chong S, Li HH, Tan EK. Transcallosal diffusion tensor abnormalities in predominant gait disorder parkinsonism. Parkinsonism Relat Disord 2014, 20: 53-59.
[2] Lenka A, Pasha SA, Mangalore S, George L, Jhunjhunwala KR, Bagepally BS, et al. Role of Corpus Callosum Volumetry in Differentiating the Subtypes of Progressive Supranuclear Palsy and Early Parkinson's Disease. Mov Disord Clin Pract 2017, 4: 552-558.
[3] Goldman JG, Bledsoe IO, Merkitch D, Dinh V, Bernard B, Stebbins GT. Corpus callosal atrophy and associations with cognitive impairment in Parkinson disease. Neurology 2017, 88: 1265-1272.
[4] Phillips O, Sanchez-Castaneda C, Elifani F, Maglione V, Di Pardo A, Caltagirone C, et al. Tractography of the corpus callosum in Huntington's disease. PLoS One 2013, 8: e73280.
[5] Cui Z, Zhong S, Xu P, He Y, Gong G. PANDA: a pipeline toolbox for analyzing brain diffusion images. Front Hum Neurosci 2013, 7: 42.
[6] Tustison NJ, Cook PA, Klein A, Song G, Das SR, Duda JT, et al. Large-scale evaluation of ANTs and FreeSurfer cortical thickness measurements. Neuroimage 2014, 99: 166-179.
[7] Klein A, Tourville J. 101 labeled brain images and a consistent human cortical labeling protocol. Front Neurosci 2012, 6: 171.
[8] Behrens TE, Johansen-Berg H, Woolrich MW, Smith SM, Wheeler-Kingshott CA, Boulby PA, et al. Non-invasive mapping of connections between human thalamus and cortex using diffusion imaging. Nat Neurosci 2003, 6: 750-757.
[9] Bledsoe IO, Stebbins GT, Merkitch D, Goldman JG. White matter abnormalities in the corpus callosum with cognitive impairment in Parkinson disease. Neurology 2018, 91: e2244-e2255.
Figures