4474
Mapping white matter specificity captured by diffusion tractography through deep learning on structural MRI1Computer Science, Vanderbilt University, Nashville, TN, United States, 2Sherbrooke Connectivity Imaging Laboratory (SCIL), Universite de Sherbrooke, Sherbrooke, QC, Canada, 3Intelligent Systems Engineering, Indiana University Bloomington, Bloomington, IN, United States, 4Laboratory of Behavioral Neuroscience, National Institute on Aging, Baltimore, MD, United States, 5Vanderbilt University Institute of Imaging Science, Nashville, TN, United States, 6Biomedical Engineering, Vanderbilt University, Nashville, TN, United States, 7Radiology and Radiological Sciences, Vanderbilt University Medical Center, Nashville, TN, United States, 8Electrical Engineering, Vanderbilt University, Nashville, TN, United States
Synopsis
We investigate the value added by diffusion fiber tractography dissection of white matter pathways over standard T1w images in which WM is largely homogenous. We analyze structural differences in pathway segmentations between a deep learning network trained to label WM directly on T1w images and the same pathways dissected using tractography, and find that although the core of the stem of many fiber bundles is accurately delineated, the value of tractography is in delineating terminal connections and determining fine-scale stem geometrical properties. Thus, while localizing regions-of-interest is possible in structural images, tractography is needed for increased pathway and connection information.
Introduction
Anatomical experts have interpreted pathway connectivity information via mass effects on homogeneously visualized white matter (WM) regions since the early periods of gross dissection by the likes of Reil, Meynert, Dejerine, and others1. Historically, specialized dissection protocols were used to visualize WM fibers and this information was generalized to the population. In current practice, T1w MRI is ubiquitously applied for structural brain mapping, and diffusion tractography is used when specialized mapping of WM connectivity is needed. Yet, the marginal value of diffusion information is not clear relative to what an expert could have intuited from a high quality T1w MRI. Here, we explore the areas for which diffusion tractography adds the most information on a lifetime aging population via comparison of diffusion tractography with deep learning of the WM parcellations using only T1w structural MRI.Methods
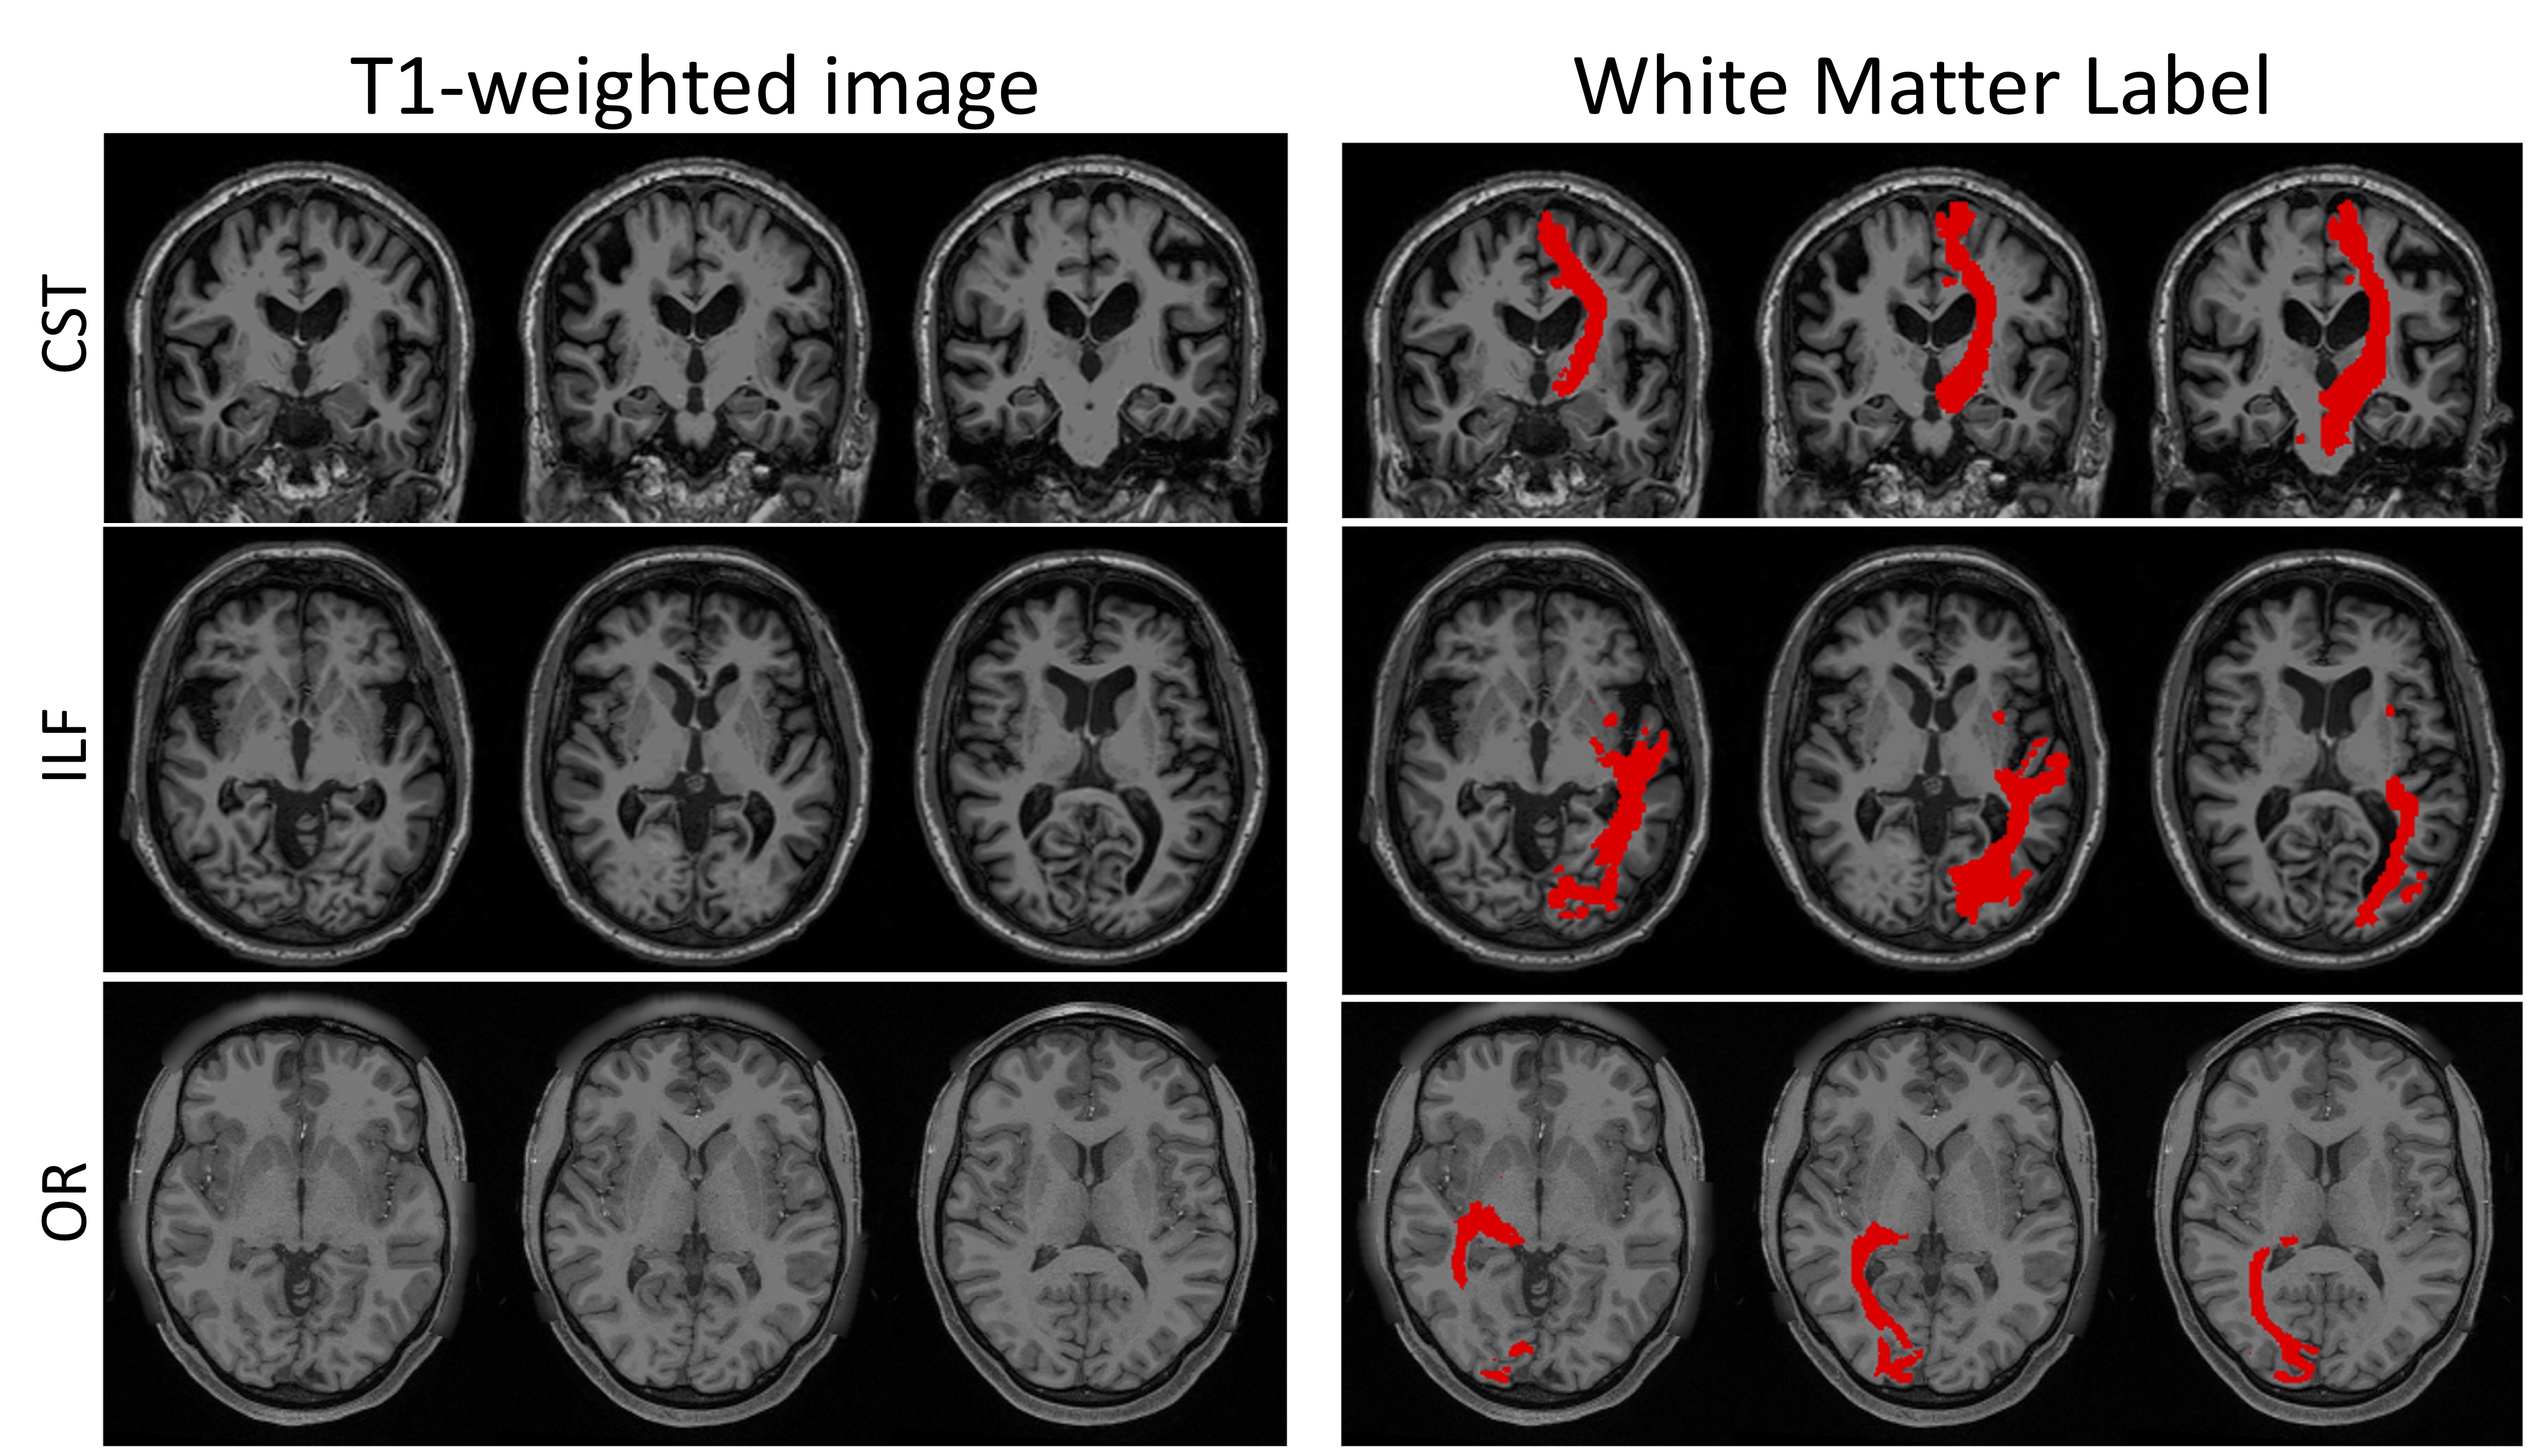
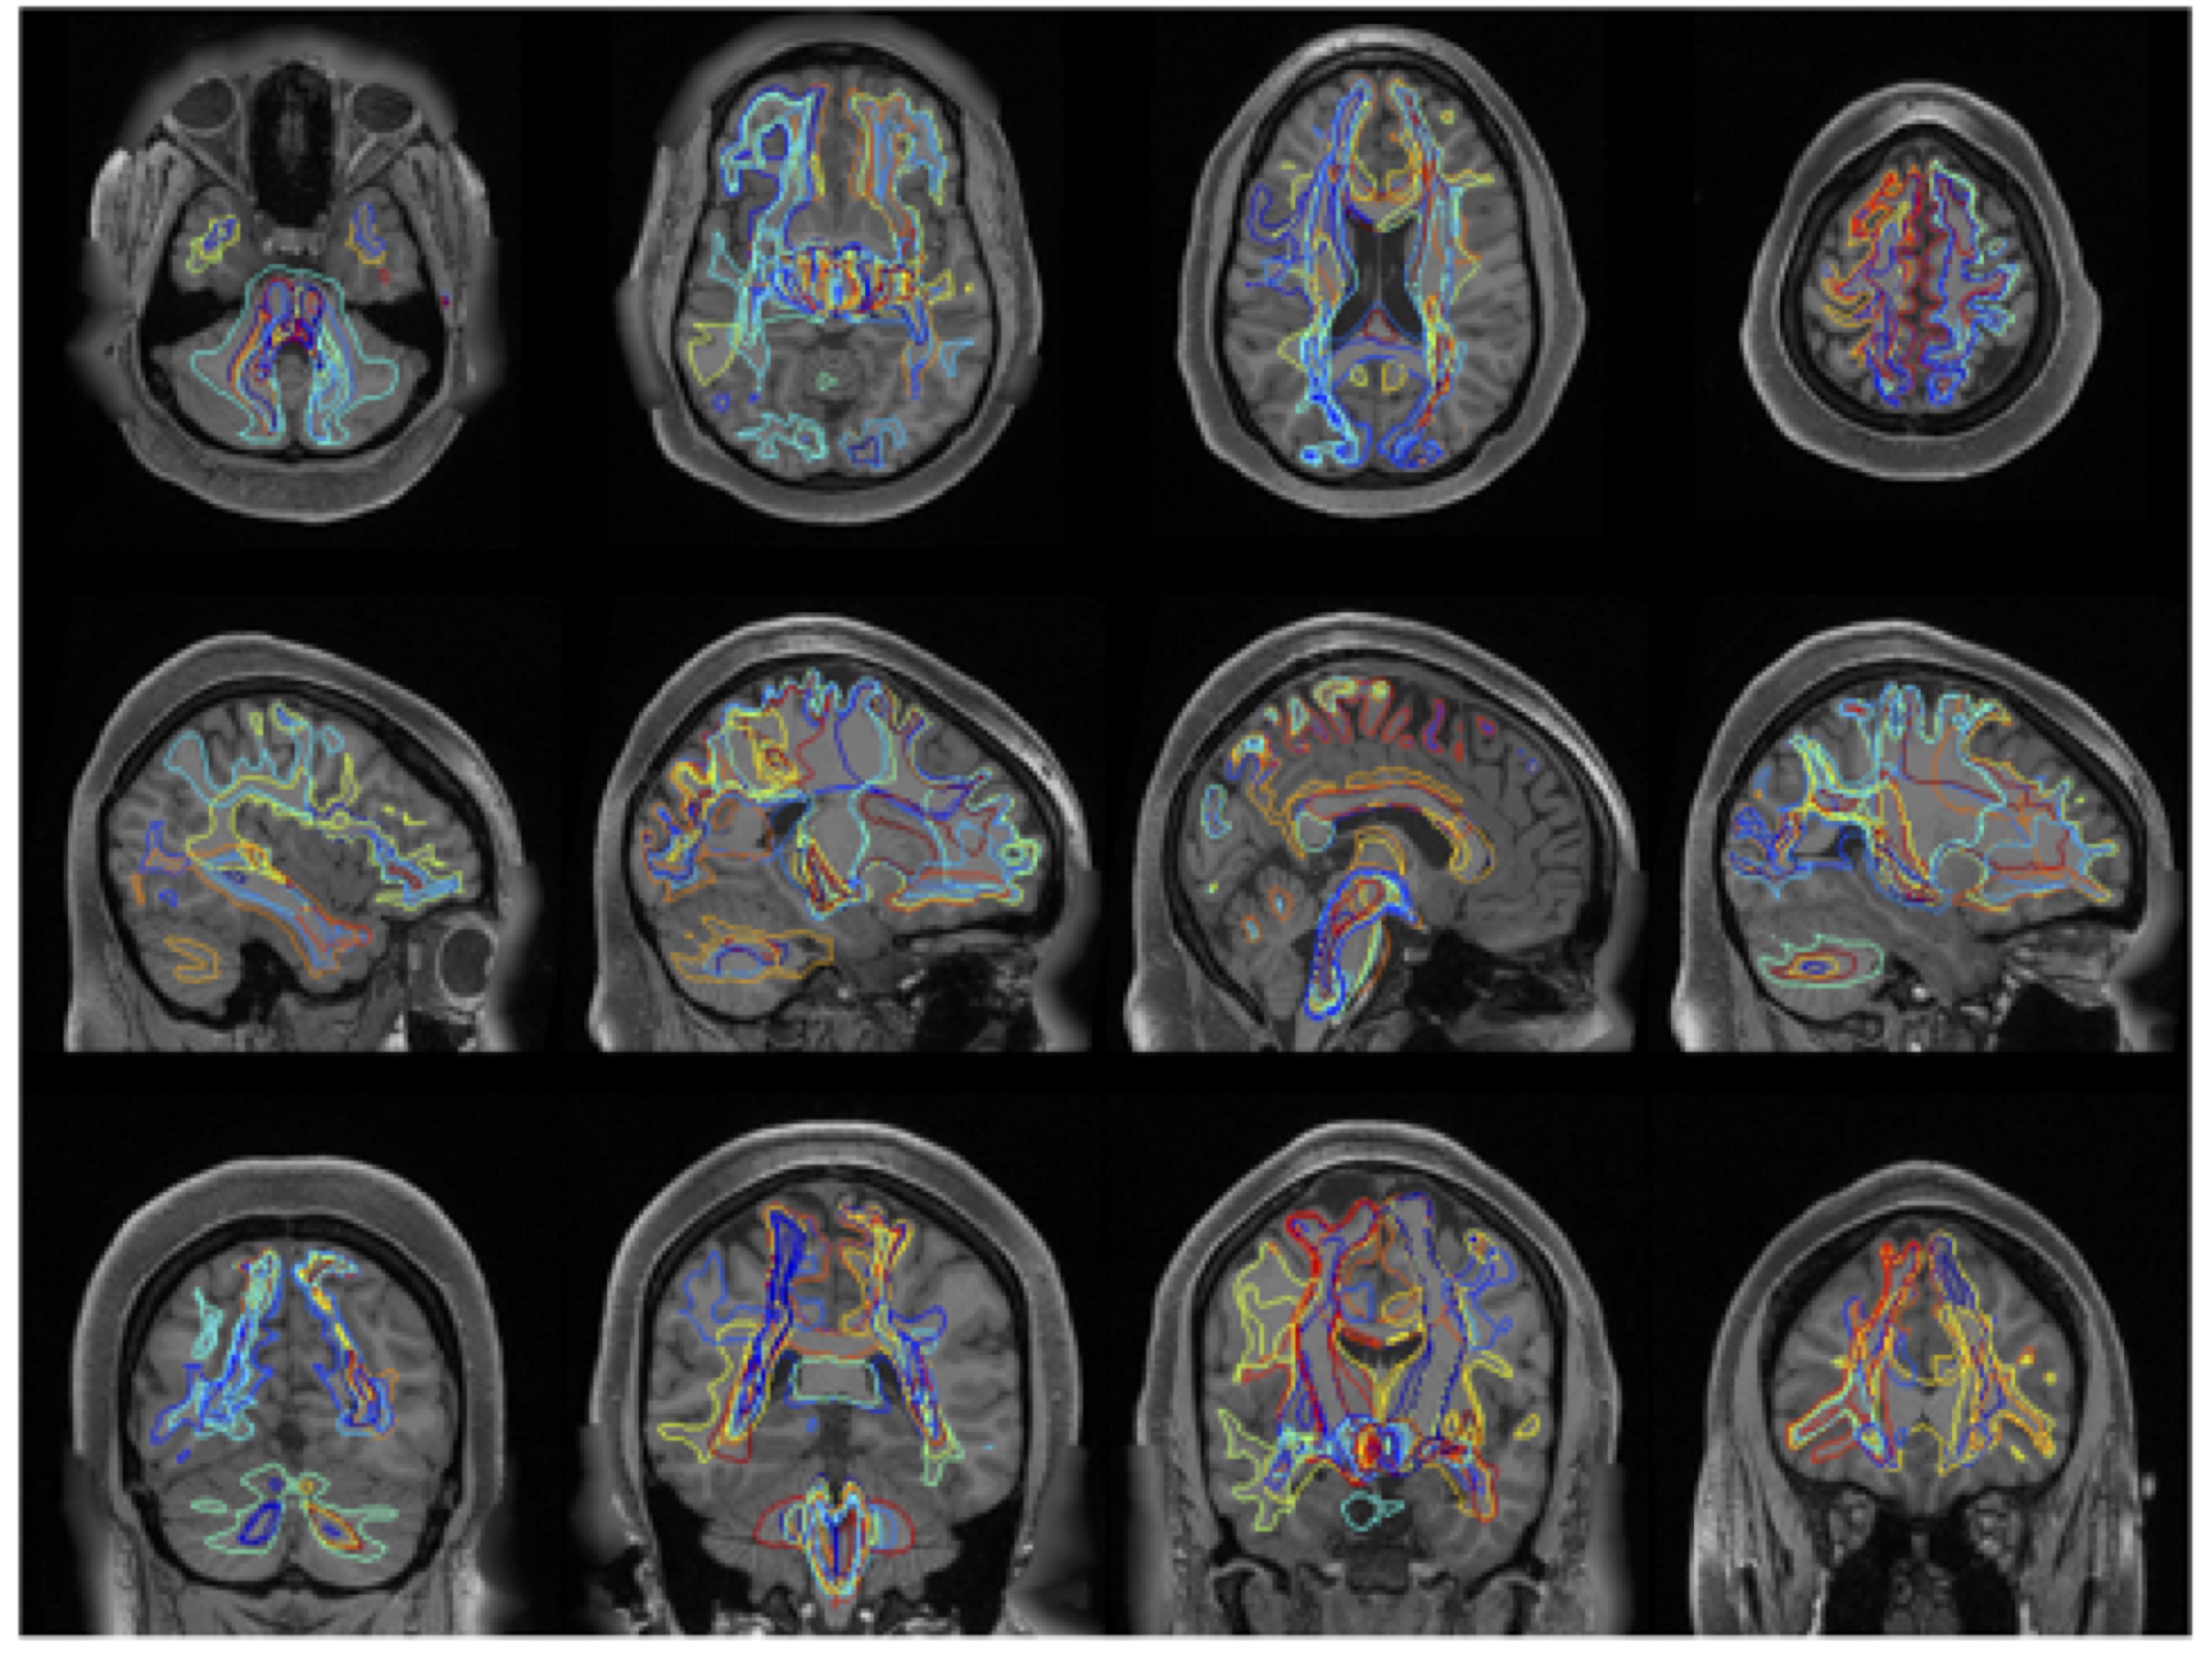
Major WM pathways can be intuitively envisioned on T1w images directly, in which very little contrast within WM is visible (Figure 1). We aim to determine whether a deep learning network can learn both gross and fine-scale delineations of WM pathways from the structural image, and investigate where, and for which pathways, the segmentations are (in)accurate. We train high-resolution 3D U-nets using gold-standard labels from tractography.Data
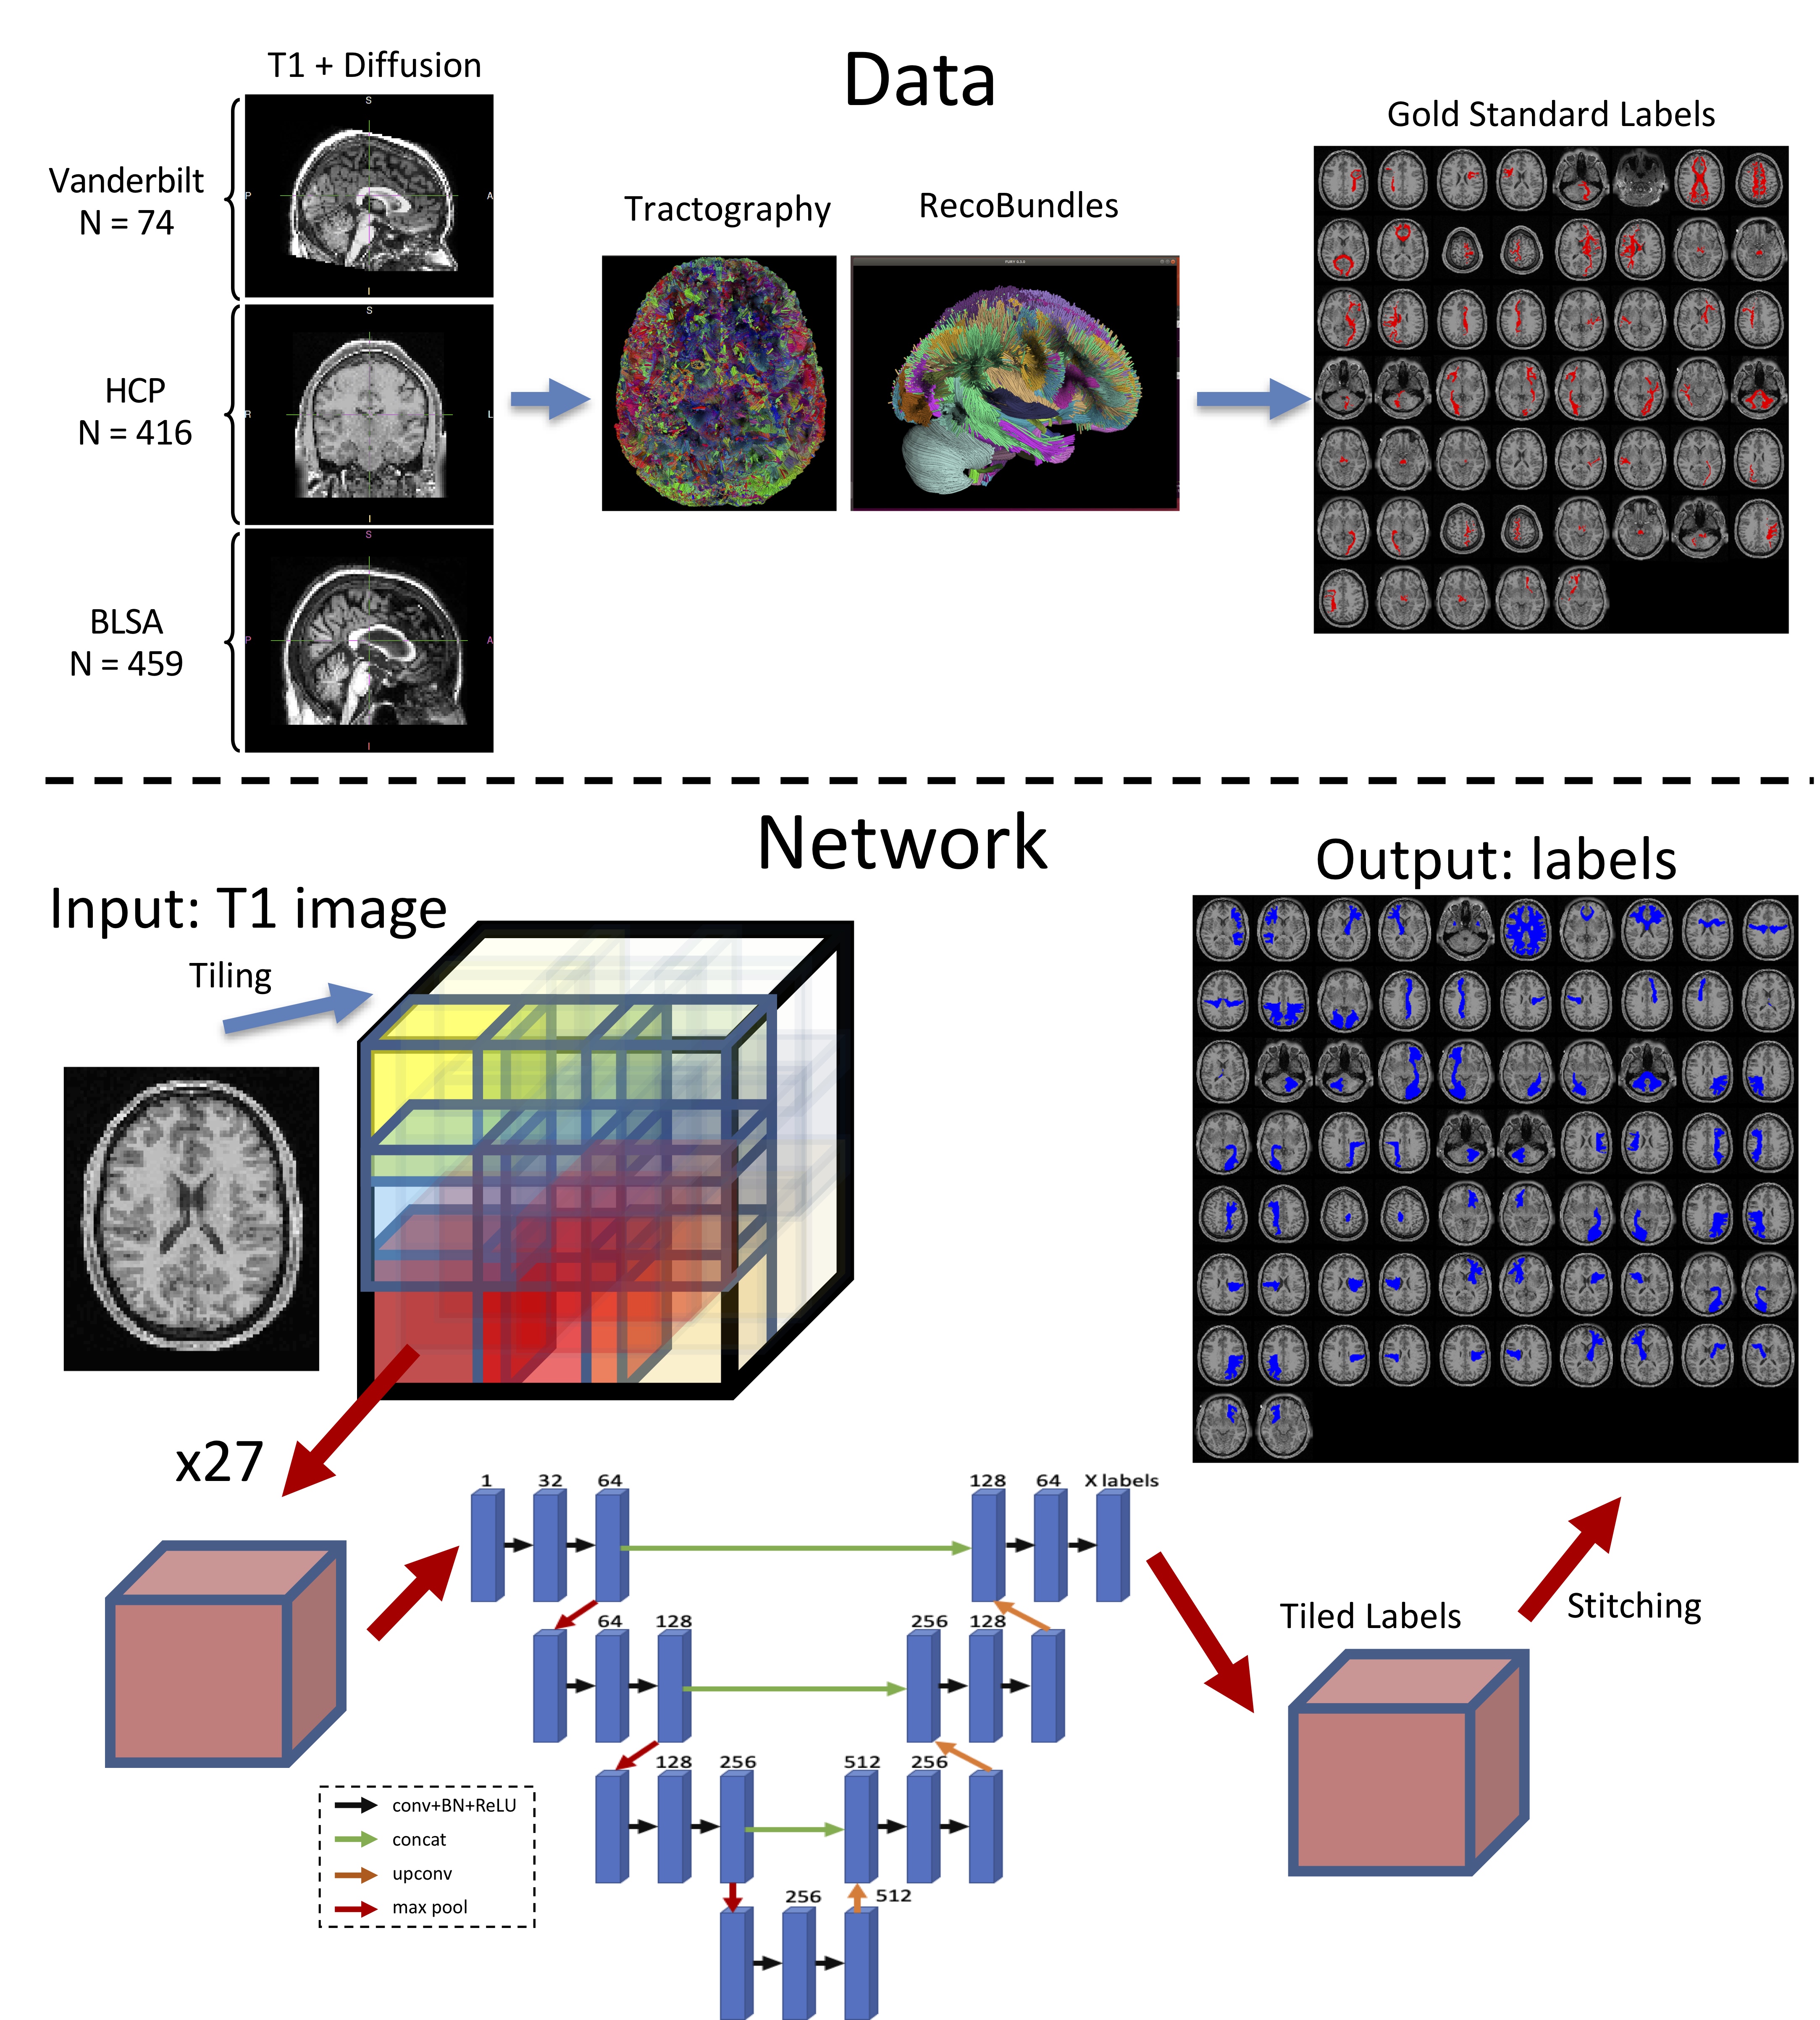
With the aim to increase generalizability, the network was trained from a variety of databases, with varying acquisition techniques, data quality, and a broad age range– with data from the Human Connectome Project, Baltimore Longitudinal Study of Aging, and Vanderbilt University (Figure 2, top). The ground truth labels were derived using whole-brain tractography and Recobundles recognition and clustering2 resulting in 53 pathways on 1109 brain scans (798 total subjects, with between 1 and 5 sessions each). We note that Recobundles included 79 bundles of which 26 were not included in training due to small sizes, and/or occasional failure to recognize during clustering, resulting in 53 total bundles.
Network
All brain volumes (both T1w and binarized pathways) were mapped to MNI 305 standard space, and 3D U-nets were trained at 1mm isotropic resolution (Figure 2, bottom). Importantly, due to GPU memory restrictions at high resolution (matrix=193*229*193 times the number of weights in the model, i.e., channels per layer) we utilized a patch-based, spatially-localized, approach to training3 where multiple independent 3D U-nets were distributed for high-resolution whole-brain segmentation. The inputs to each network were tiled images (27 total tiles) and each network learned contextual information at a fixed spatial location. Outputs were concatenated as a final step in predicting labels. Data were stratified by subject into training (N=949), validation (N=53), and testing (N=107).
Results
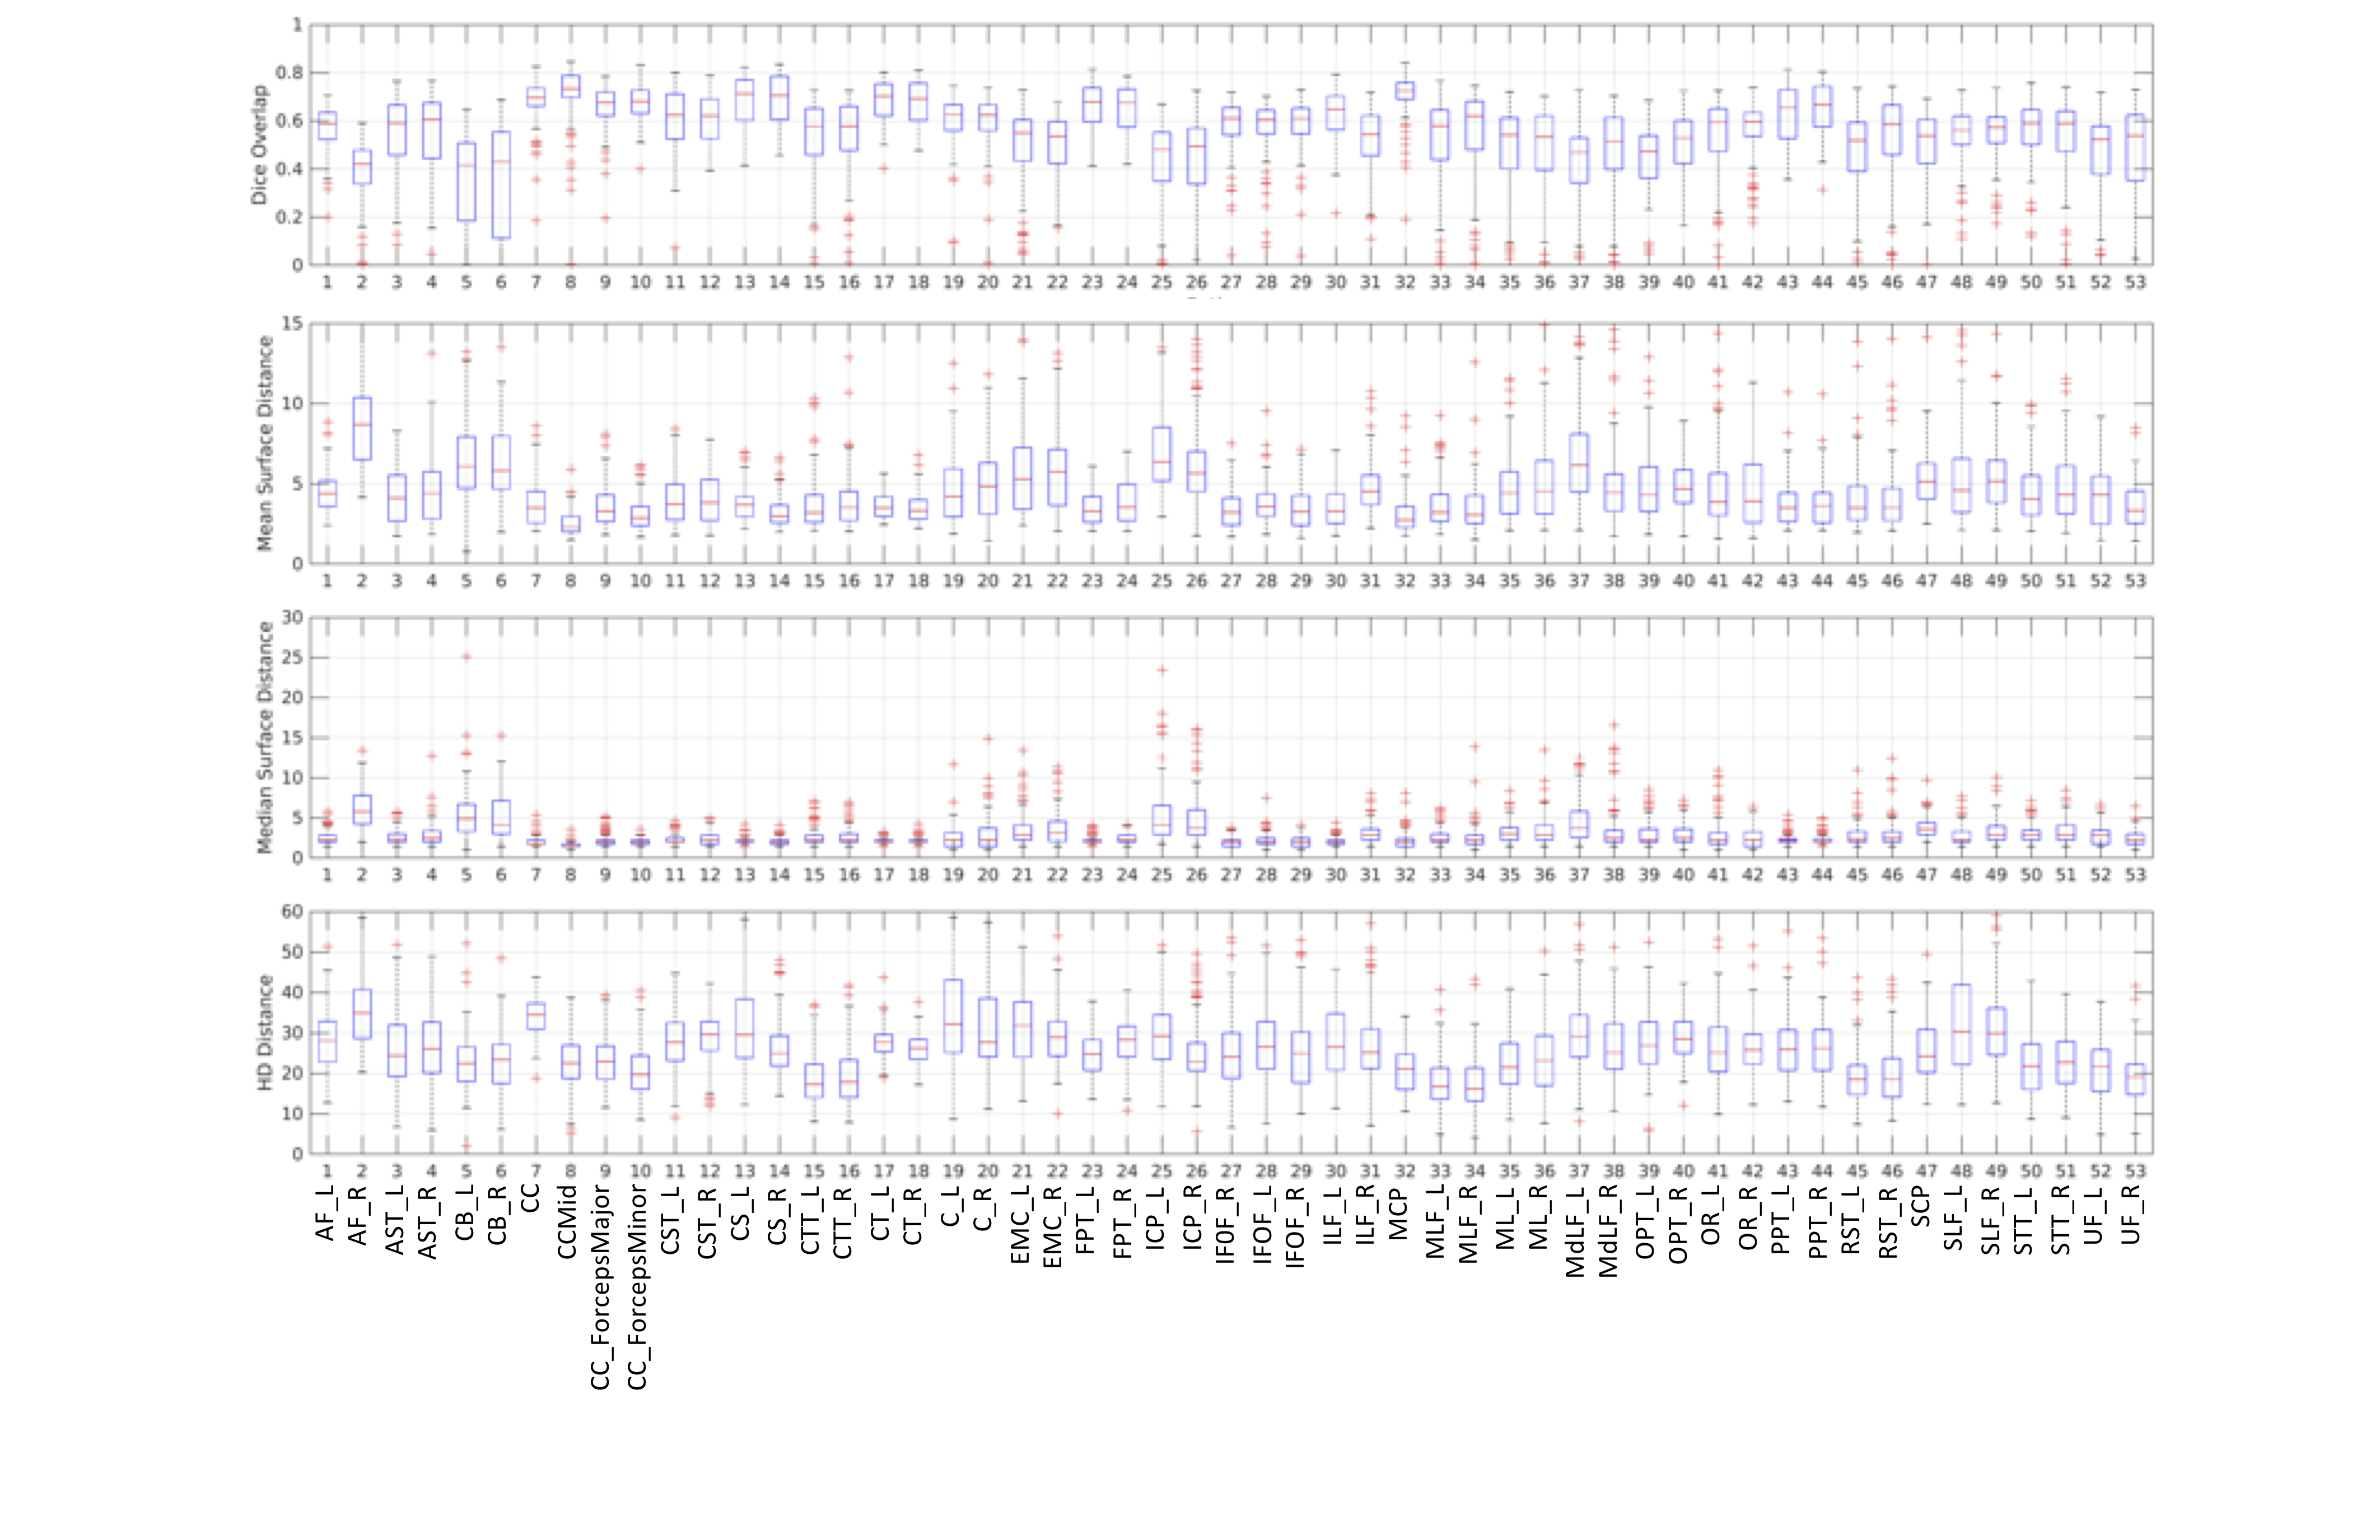
Quantitative agreementPrediction accuracy was assessed by comparing gold-standard labels (tractography) with predicted labels on the testing datasets (Figure 3). In general, overlap was moderate with median Dice values between 0.4-0.75. Mean surface distances between truth and predictions were consistently below 5mm, with few exceptions, and median surface distance (less sensitive to outliers) consistently 3mm or less (3 voxels) for most pathways. Finally, Hausdorff distance, which measures the distance of maximum dissimilarity, is on the order of 15-30mm.
Value of tractography
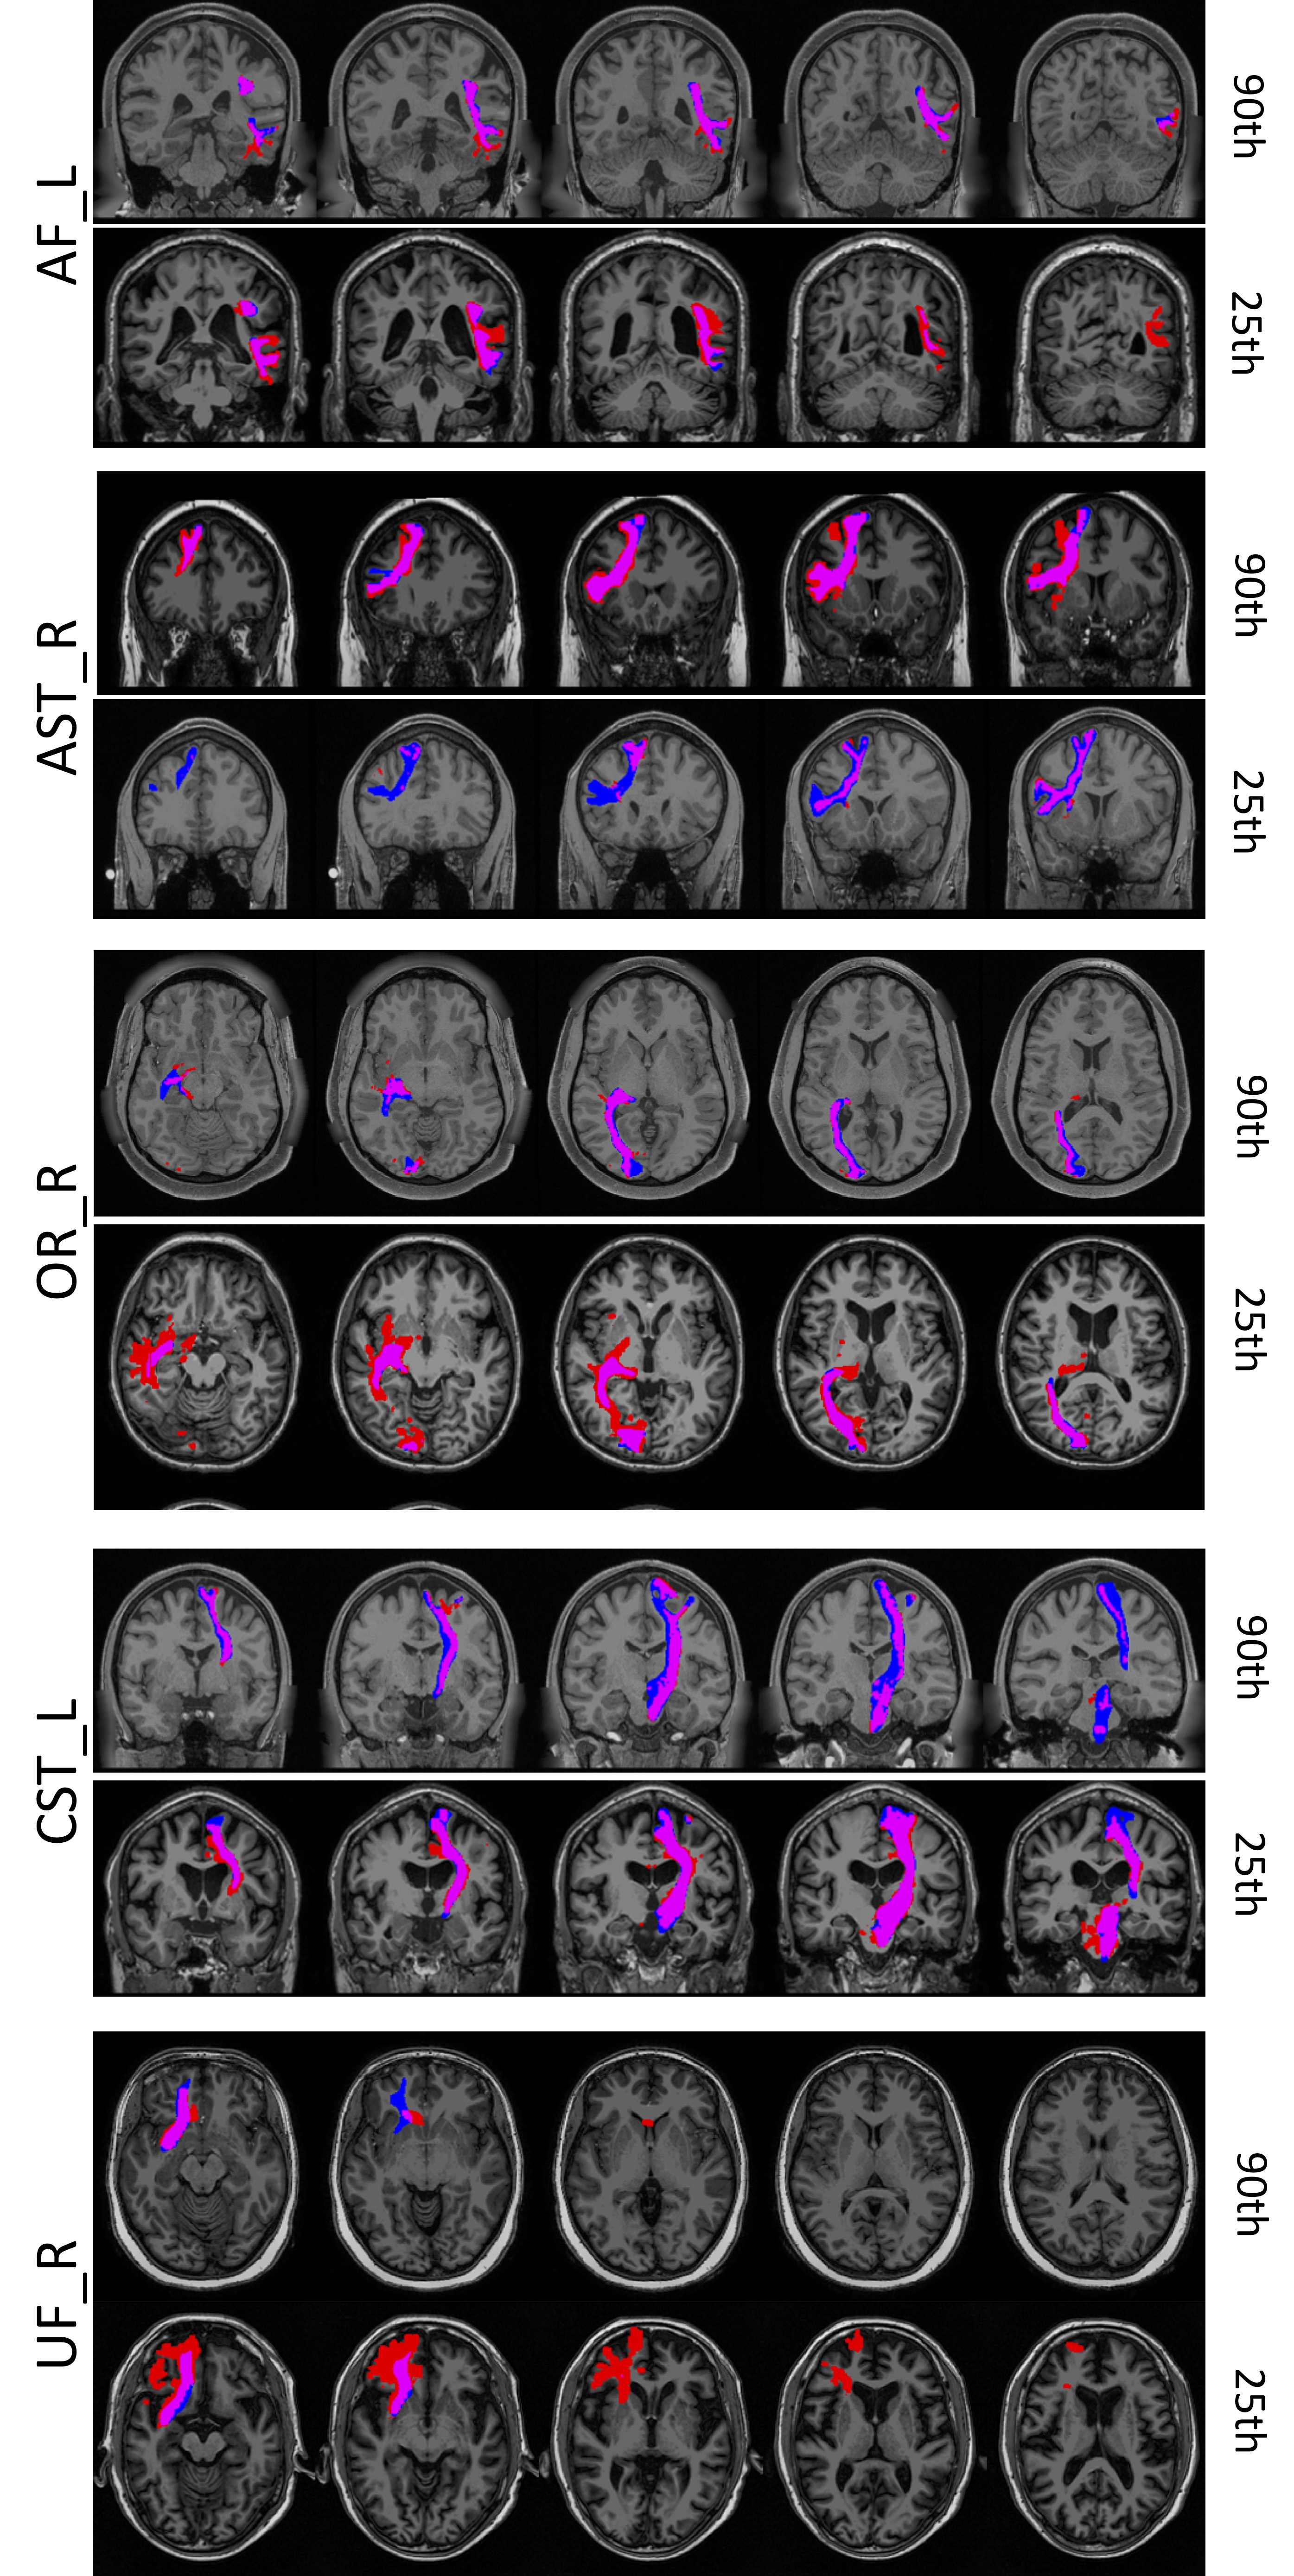
Figure 3 shows qualitative depictions of ground-truth and predicted labels, and areas of agreement, for several pathways, with examples of both high and low agreement. It is clear that even in the cases of poor overall overlap, the network is able to predict the stem of the bundle, the area in which most WM bundles form dense cores coursing through deeper WM. However, the value of tractography is shown in the specificity of delineating superficial WM and cortical connections, where most areas of disagreement are obvious, even in results with high dice coefficients. Another area of value is in delineating the thickness, or orthogonal shape/geometry, of the stem of the bundle. Despite predicting location accurately, the thickness is often over or under-estimated.
Value of predictions
Despite limitations in superficial WM regions, the predicted pathways are anatomically plausible, with reasonable parcellations of white matter on structural images (Figure 5). And most critically, WM parcellations that may overlap other labels, unlike traditional cortical or WM atlases.
Discussion
We investigate the ability to learn WM segmentations directly on T1w images, in a manner similar to how a neuroradiologist may describe locations or regions-of-interest on images where WM is homogenous.We demonstrate value of tractography in delineating precise cortical terminations, as well as in finely delineating the shape of the bundle stem. Although the core location is generally accurately predicted, it is interesting that the thickness is not accurately predicted using structure alone, suggesting that tractography’s integration of neighborhood information and streamline clustering is unique in its ability to overcome possible partial-volume effects.
On the other hand, we’ve also demonstrated that tractography is not a strict requirement to map the bulk of WM pathways. We envision the use of this, and similar, networks trained on tractography images to segment WM regions when diffusion information may not be available, with the advantage over traditional WM or GM atlases being that labels may overlap.
While the value of diffusion for non-invasively mapping the WM pathways is undeniable, here we demonstrate where value is added over the information available in standard structural images.
Acknowledgements
This work was conducted in part using the resources of the Advanced Computing Center for Research and Education at Vanderbilt University, Nashville, TN. This work was supported by the National Institutes of Health under award numbers R01EB017230, RO1NS058639, and T32EB001628. This research was funded in part by the Intramural Research Program of the National Institutes of Health, National Institute on Aging.References
1. Schmahmann, J.D. and D.N. Pandya, Cerebral white matter--historical evolution of facts and notions concerning the organization of the fiber pathways of the brain.J Hist Neurosci, 2007. 16(3): p. 237-67.
2. Garyfallidis, E., et al., Recognition of white matter bundles using local and global streamline-based registration and clustering.Neuroimage, 2018. 170: p. 283-295.
3. Huo, Y., et al., 3D whole brain segmentation using spatially localized atlas network tiles.Neuroimage, 2019. 194: p. 105-119.
Figures