4473
What factor influences most the reproducibility of MRI-based white matter tract estimation using probabilistic tractography?1Department of Biomedical Engineering, School of Biomedical Engineering and Imaging Sciences, King’s College London, London, United Kingdom, 2Department of Neuroradiology, King’s College Hospital, London, United Kingdom, 3Computer Assisted Clinical Medicine, Medical Faculty Mannheim, Heidelberg University, Mannheim, Germany, 4Department of Medical Physics and Bioengineering, NHS Highland, Inverness, United Kingdom
Synopsis
MRI-based white matter tract estimation using probabilistic tractography is valuable for presurgical planning. In this work, we investigate three factors influencing the reproducibility of probabilistic tractography: the tract threshold used to visualise the analysis results in the final tractography image, the manually drawn seed region, and the end region of the tracts. A compromise between low risk and high reproducibility has to be found for the tract threshold. The end region definition was found to be the most important parameter for the inter-user reproducibility of restricted tracts. Good inter-user reproducibility for the unrestricted tracts is achievable for similar seed regions.
Introduction
MRI-based white matter tract estimation using probabilistic tractography is valuable for presurgical planning in cases where resection close to white matter tracts connecting essential functional areas of the brain is required1,2,3. In previous work, we found good inter-user reproducibility in comparison to the intrinsic reproducibility resulting from the probabilistic nature of the analysis4. In this work, we analyse in more detail three factors influencing the reproducibility of probabilistic tractography: the tract threshold used to visualise the analysis results in the final tractography image, the manually drawn seed region, and the end region of the tracts.Methods
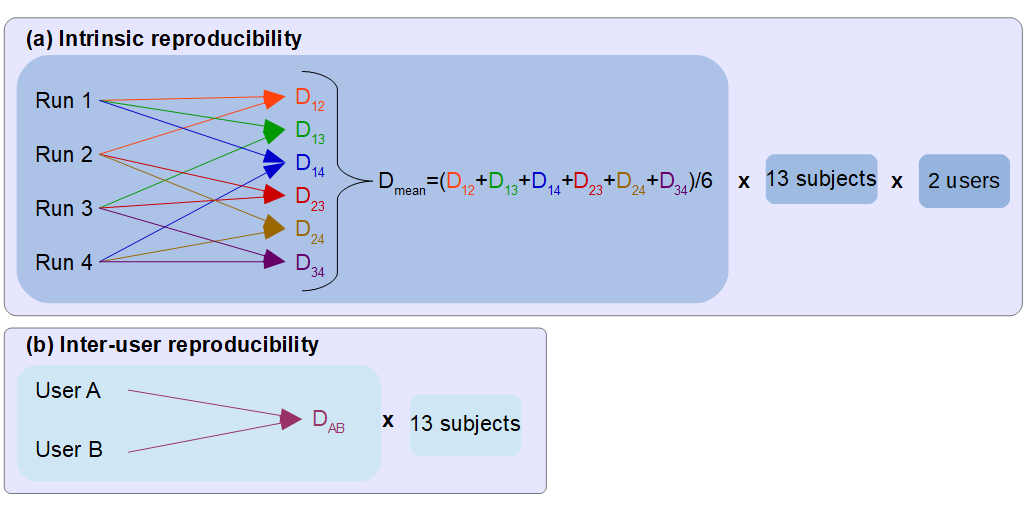
3D T1-weighted MPRAGE (TE/TR=3.02/2200ms, voxel=(1mm)3), fMRI GE-EPI (TE/TR=40/3000ms, voxel=2.5x2.5x3mm3, 6x(30s rest and 30s activation)) and DTI SE-EPI (TE/TR=86/9500ms, voxel=(2.5mm)3, 6xb=0s/mm2, 64 diffusion directions b=1500s/mm2) images from 11 subjects acquired at 1.5T (Siemens Aera, 20-channel head-only receive coil) were employed. fMRI tasks included finger tapping, lip pouting, foot rocking. Subjects 1 to 8 are patients (no fMRI data for subject 8) and subjects 9 to 11 are healthy volunteers. Two additional test datasets (subject 12 and 13) are subjects 7 and 8, respectively, with atlas defined seed and end regions. Constrained spherical deconvolution and probabilistic tractography (MRtrix35) were used to analyse the diffusion data. Two users (medical physicists) performed blind and independent data analysis. The instructions were: 1) produce activation t-maps with SPM126, threshold to define region of highest activation, combine results from all tasks and binarise; 2) manually draw the seed region for the corticospinal tract on the posterior limb of the internal capsule (PLIC) on the fractional anisotropy map; 3) generate tracts using only the seed region as starting point (unrestricted) and using both seed and end regions (restricted). The process was stopped when 10,000 tracts starting from the seed and reaching the end region, when provided, had been generated7. For the atlas-defined seed and end regions, both users selected the PLIC and primary motor cortex structures using the ICBM-DTI-81 PLIC8 and Jülich histological9 atlases, respectively. The reproducibility between users was assessed by volume comparison of binarised seed regions, binarised end regions, and binarised streamline distributions (tracts) obtained by the two users by computing a Dice index10 for each subject. The intrinsic reproducibility was assessed by volume comparison of binarised streamline distributions obtained by repeating the tract estimation four times with identical parameters for each subject-user combination (Figure 1). For binarising the streamline distributions, thresholds of 0,2,3,10 were considered. Pearson correlation coefficients were calculated to determine factors with significant influence on the tract reproducibility.Results and Discussion
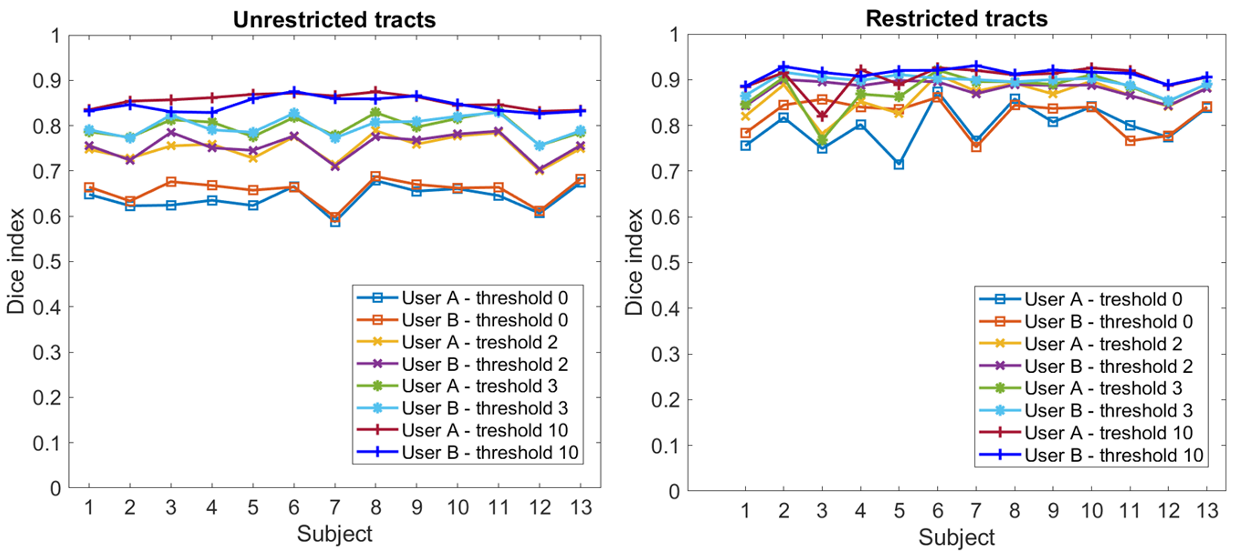
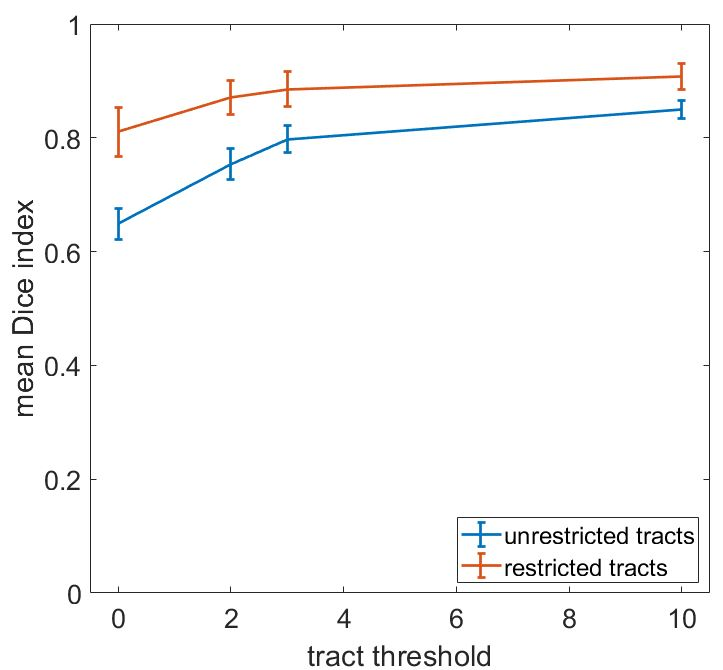
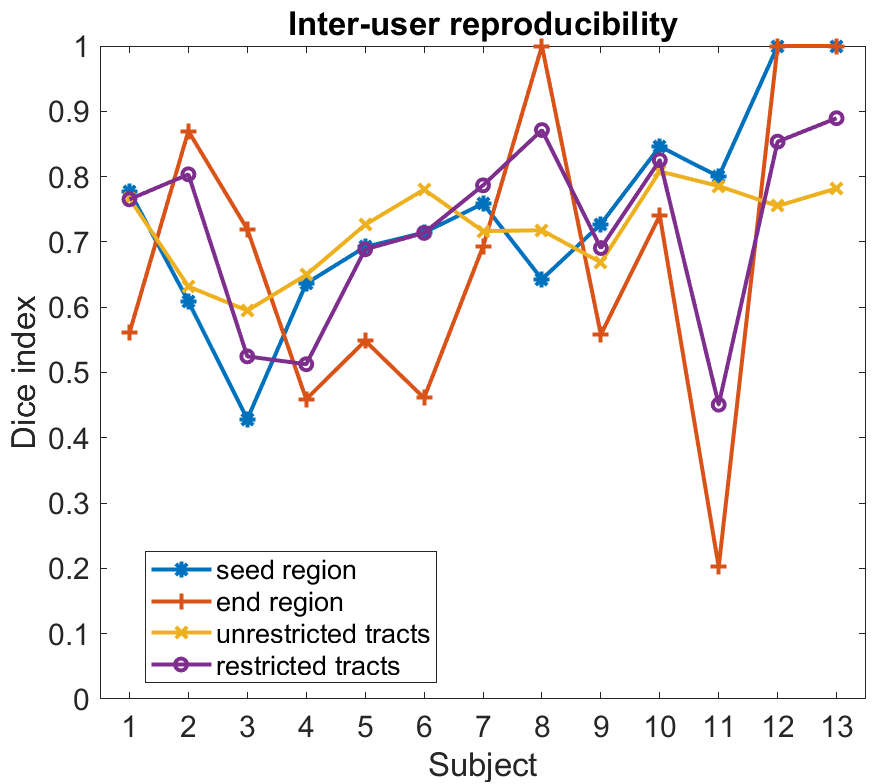
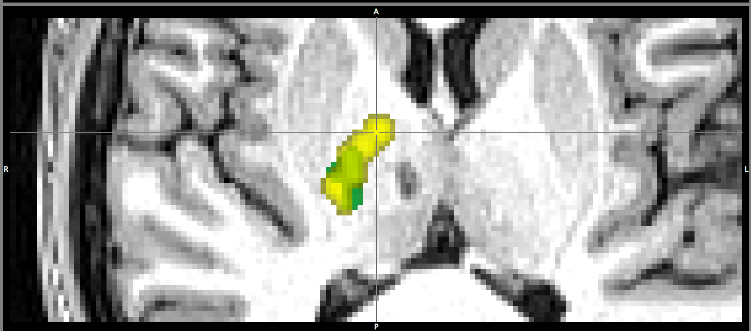
Intrinsic reproducibility for unrestricted and restricted tracts and for different tract thresholds is shown in Figure 2. For the same tract threshold, the Dice indices obtained for the restricted tracts are higher than for the unrestricted tracts. This is expected as the inclusion of an end region will restrict the available pathways. The highest intrinsic reproducibility was 93%: at least 7% of tracts are different in two analyses with identical parameters. The differences in intrinsic reproducibility between the two users is larger for the restricted tracts than the unrestricted tracts. Furthermore, the intrinsic reproducibility of both unrestricted and restricted tracts increases with increasing tract threshold. This is expected, as high thresholds exclude low probability tracts from the comparison. However, choosing too high a threshold may exclude true positive tracts from the final tractography image used for pre-surgical planning, for which conservative margins should be adopted to reduce risks of post-surgical deficits for the patient. The dependence of the intrinsic Dice index on the tract threshold is shown in Figure 3. A threshold of 3 was chosen for the evaluation of the inter-user reproducibility, as the curves have a plateau for values > 3. The dice indices obtained for the inter-user reproducibility for the seed region, end region, unrestricted, and restricted tracts are shown in Figure 4. The inter-user reproducibility of the final tracts is clearly subject-dependent, even when both seed and end regions are identical for both users, as for datatsets 12 and 13. The agreement between users on the seed and end regions ranged from 42% to 84% and from 20% to 86%, respectively (disregarding atlas-defined regions). For the comparison of seed regions, the two-dimensional extensions of the region defined by the users were compared. However, the slice on which the seed region was defined differed between users (Figure 5). Pearson analysis indicated a significant correlation (p<0.05) between identical slice for the seed region definition and the Dice index for the seed. Furthermore, significant (p<0.05) positive correlations between seed region and unrestricted tracts as well as between end region and restricted tracts were found, suggesting that these factors are determinant for the final distribution of the respective tracts.Conclusion
This work emphasizes that inter-user differences in seed and end region should be minimized to improve the reproducibility of unrestricted and restricted white matter tracts. Despite the influence of these factors, in most of the cases tract reproducibility ranged between 60% and 80%. The end region definition was found to be the most important parameter for the inter-user reproducibility of restricted tracts. A good inter-user reproducibility for the unrestricted tracts is achievable for good agreement on the seed region.Acknowledgements
This work was carried out at, and supported by, the Department of Neuroradiology at King’s College Hospital NHS Foundation Trust. EDV is supported by the Wellcome/EPSRC Centre for Medical Engineering [WT 203148/Z/16/Z]. The views expressed are those of the authors and not necessarily those of the NHS, the NIHR or the Department of Health.References
1. Abbott et al. fMRI assessment of language lateralization: an objective approach. Neuroimage. 2010;50(4), 1446-1455.
2. Bizzi, A. Presurgical mapping of verbal language in brain tumors with functional MR imaging and MR tractography. Neuroimaging Clinics. 2009;19(4), 573-596.
3. Bucci et al. Quantifying diffusion MRI tractography of the corticospinal tract in brain tumors with deterministic and probabilistic methods. NeuroImage: Clinical. 2013;3, 361-368.
4. Brumer I, De Vita E, Ashmore J, et al. How reproducible are the results of probabilistic white matter tract estimation?. Proc. Intl. Soc. Mag. Reson. Med. 27, Montréal, Canada, 2019, p.3653.
5. http://www.mrtrix.org/
6. Wellcome Trust Centre for Neuroimaging, University College London, UK (www.fil.ion.ucl.ac.uk/spm)
7. Farquharson et al. White matter fiber tractography: why we need to move beyond DTI. Journal of neurosurgery. 2013;118.6, 1367-1377.
8. Mori, S., Oishi, K., Jiang, H., et al. Stereotaxic white matter atlas based on diffusion tensor imaging in an ICBM template. Neuroimage. 2008;40(2), 570-582.
9. Geyer, S., Ledberg, A., Schleicher, et al. Two different areas within the primary motor cortex of man. Nature. 1996;382(6594), 805.
10. Dice, L.R. Measures of the amount of ecologic association between species. Ecology. 1945;26(3), 297-302.
Figures