4471
The investigation of topological contributions: A novel approach for modelling brain networks1Mary Mackillop Institute for Health Research, Australian Catholic University, Melbourne, Australia, 2Florey Institute of Neuroscience and Mental Health, University of Melbourne, Melbourne, Australia
Synopsis
Diffusion MRI streamline tractography offers a unique approach to probe into such mechanisms underlying structural brain network. In this study, we propose modelling network strength based on both fibre length and topological profile of brain network. The proposed model leads to more robust fitting outcomes. Meanwhile, our results show that network thresholding could dramatically alter the relationship between the connection strength and physical length; this would inevitably compromise further network analyses. Further results demonstrate that within- and between-hemisphere connections bear distinct patterns in terms of the relationship between network strength and topological correlation matrix.
INTRODUCTION
The human brain can be modelled as a spatially embedded network, with a common conjecture that brain network is an optimal network constrained by low wiring and metabolic costs1. Diffusion MRI streamline tractography offers a unique approach to probe into such mechanisms underlying structural brain network. A recent study demonstrates that network strength decays with streamline length2. However, this focuses exclusively on fibre length without modelling other topological information. Furthermore, most analyses have been focusing on sparse networks by applying certain thresholds to dense networks, whereas it is unclear whether the application of thresholds will affect the relationship between connection strength and streamline length. In this study, we propose modelling network strength based on both fibre length and topological profile of brain network. Specifically, we aim to investigate: (1) if network strength can be better modelled by combining whole-brain topological information into each network edge than solely based on streamline length; (2) the effects of thresholds on networks; and (3) whether topological information based on streamline length contributes differently to within- and between-hemisphere connections.METHODS
Structural connectome generation:(a) MRI data: Pre-processed anatomical T1 and diffusion-weighted MRI data of 10 subjects were downloaded from ConnectomeDB3.
(b) Tractogram reconstruction: Fibre orientation distributions were computed using multi-shell multi-tissue CSD.4 ACT5 was used to generate tractograms of 107 streamlines through the probabilistic iFOD26 algorithm with dynamic seeding7. Tractograms were post-processed using SIFT27 for quantitative reconstructions.
(c) Brain parcellation: 84 brain nodes were defined using FreeSurfer’s8 Desikan-Killiany9 cortical atlas parcellation, with the subcortical structures replaced by FSL’s FIRST10 segmentation.
(d) Brain connectome construction: For each tractogram, two types of connectomes were generated with the edge weights computed as: i) the sum of SIFT2 track weights7 (S) scaled by the proportionality coefficient7; ii) the mean streamline length between nodes (L).
Proposed model:
(a) Topological correlation connectome construction: Topological correlation connectome T is calculated from streamline length matrix as follows: for i=1:84 & for j=1:84: T(i,j)=corrcoef(L(i,:), L(j,:)), where function corrcoef is used to calculate Pearson correlation coefficients. Note: each entry of T incorporates topological information across the whole brain.
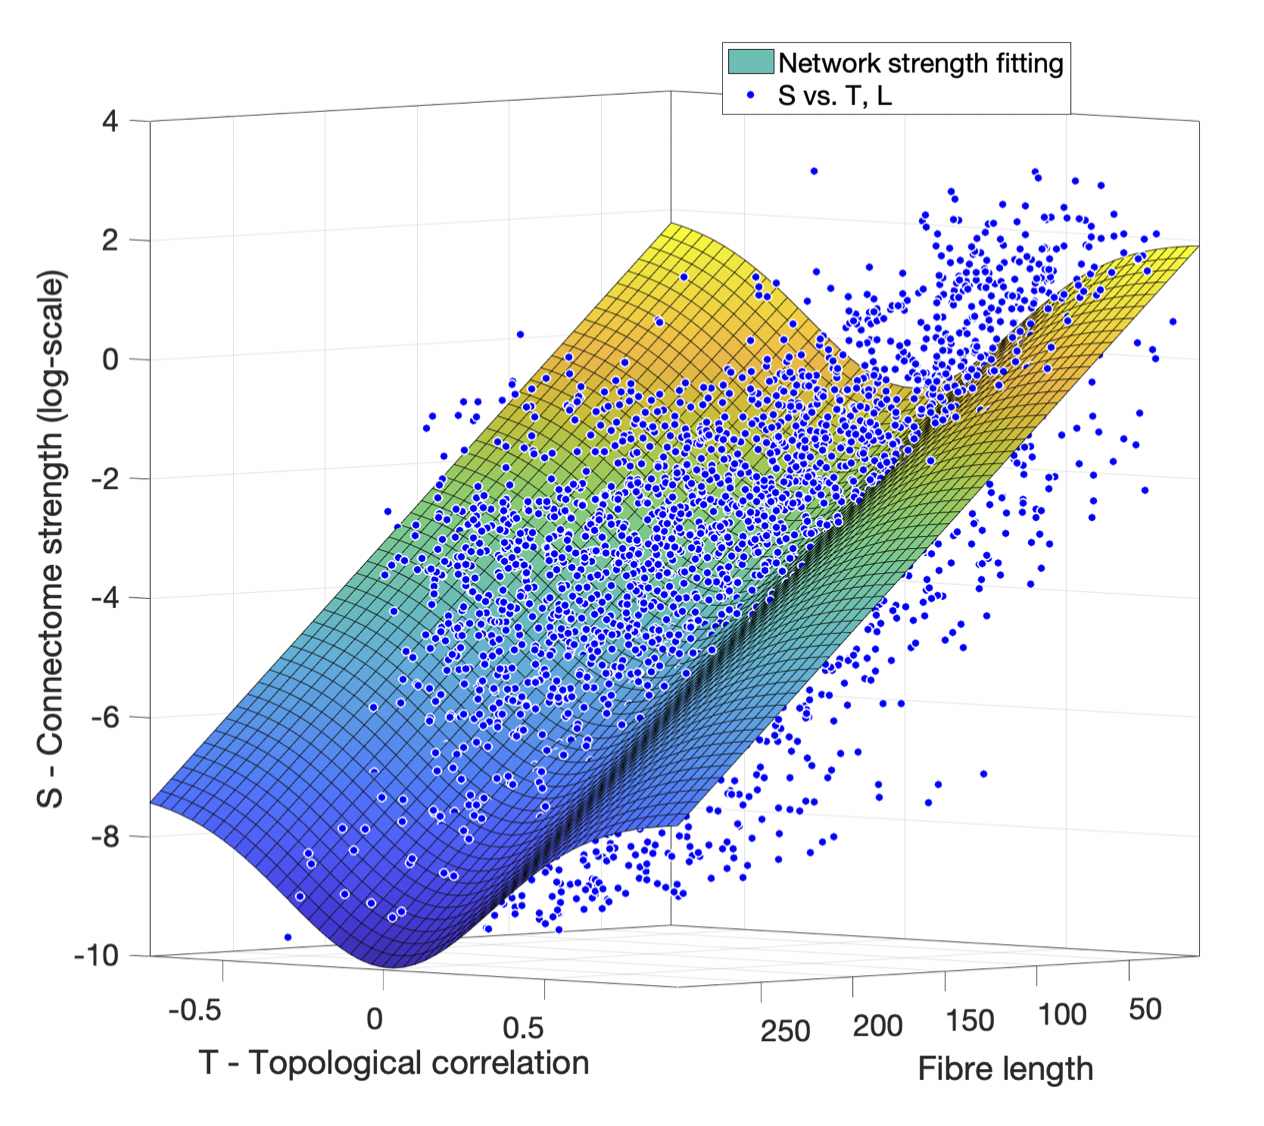
(b) Network strength fitting: Given that independent modelling of network strength vs. streamline length or topological correlation shows a linear or Gaussian distribution, respectively, network strength (S) vs. L and T are fitted with the following model: a*L-b*exp(-((T-c)/d)2)+e, where a, b, c, d & e are fitting parameters. In addition, given the distinct roles of within- and between-hemisphere connections2, such relationships between S and T are separately investigated.
RESULTS
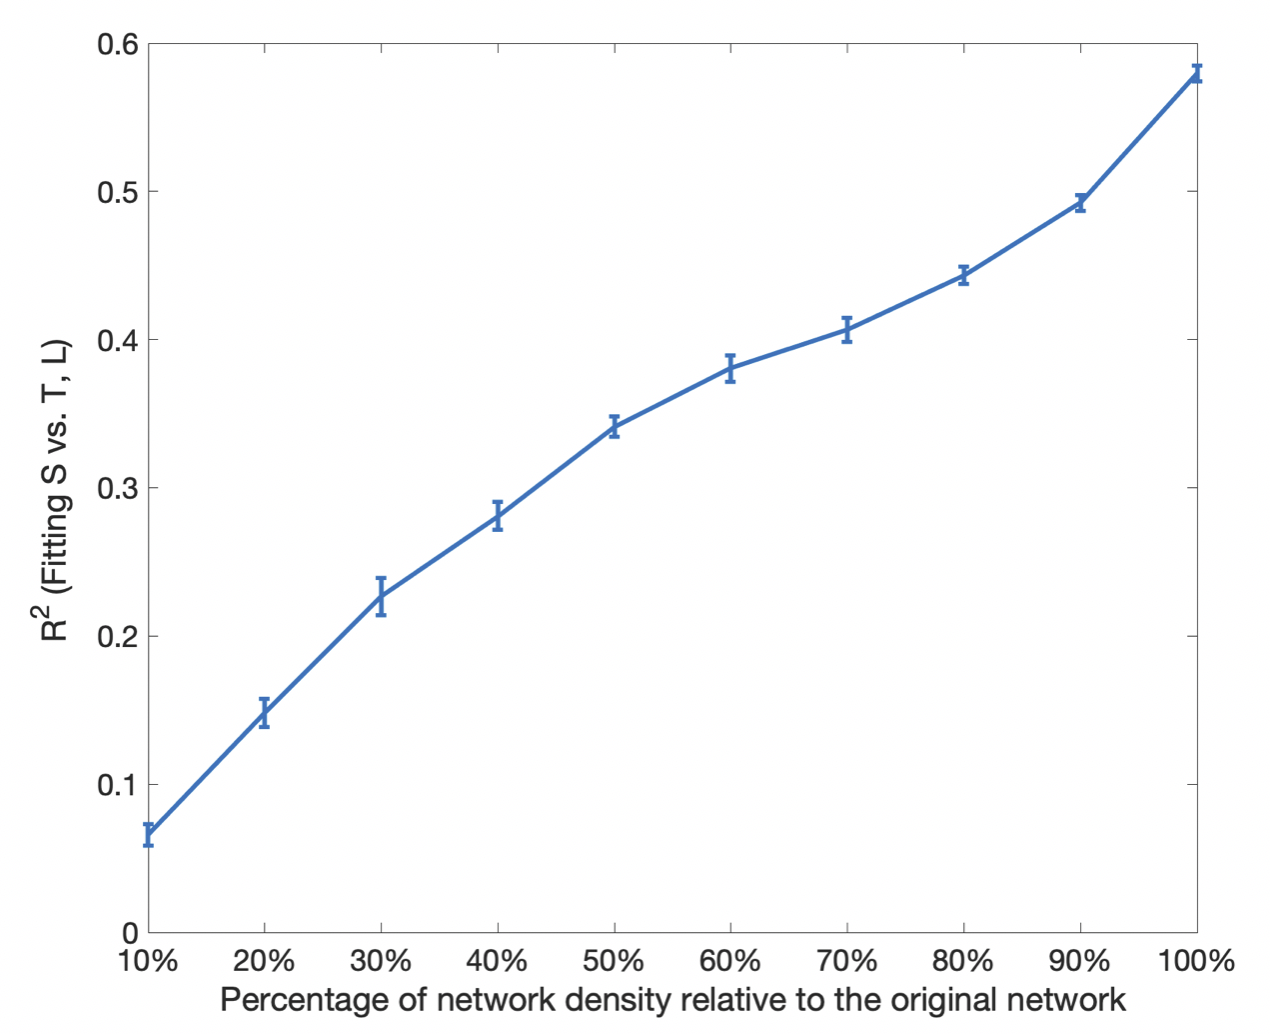
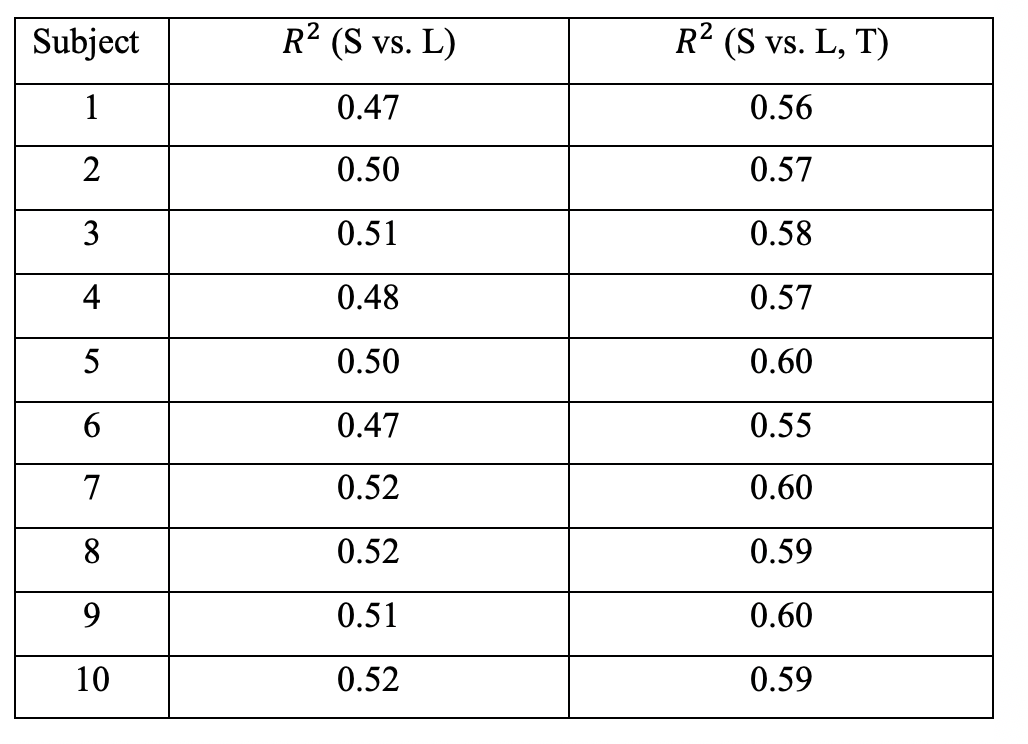
Connectome strength fitting results show that the proposed model consistently explains more variance (i.e. obtaining higher R2 values) than the model based on length only (Table 1); paired t-tests demonstrate the significant improvement (p=1e-09). Figure 1 shows the fitting result using the proposed model from a representative subject.Meanwhile, our results show that fitting outcomes are unfavourably compromised by removing increasing number of relatively weak edges (i.e. towards denser networks, see Figure 2). Specifically, the best fitting outcome is achieved (R2 = ~0.6) using the proposed model when no threshold is applied, whereas such a relationship no longer exists for very sparse networks (i.e. R2 < 0.1 when 90% of the network edges are removed).
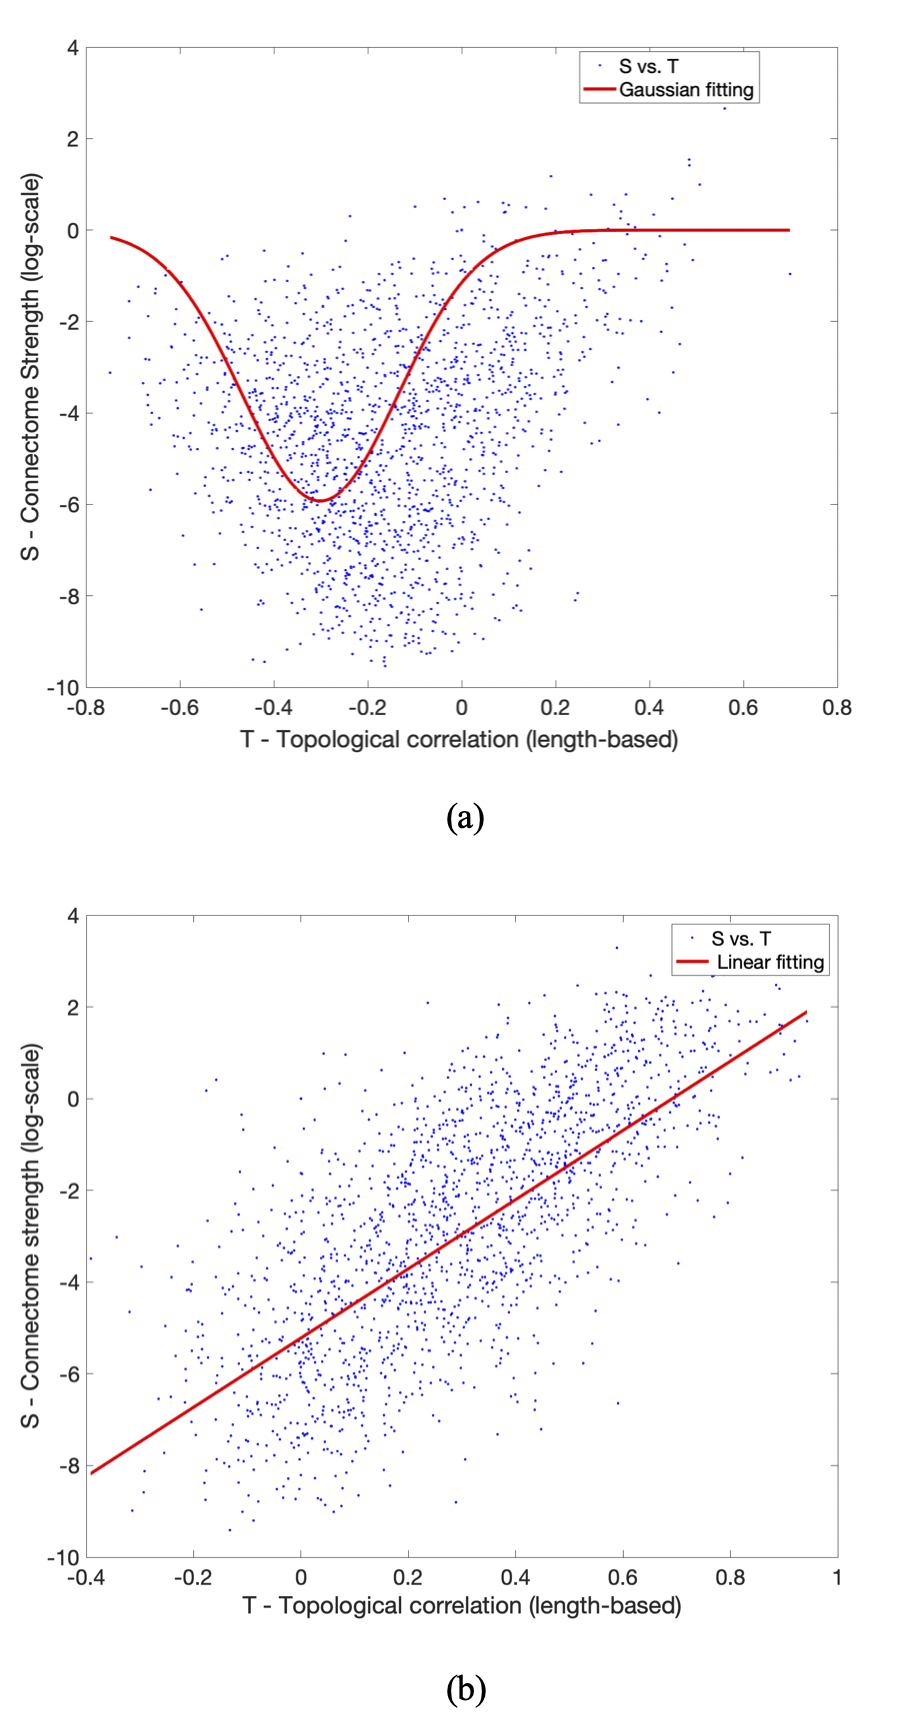
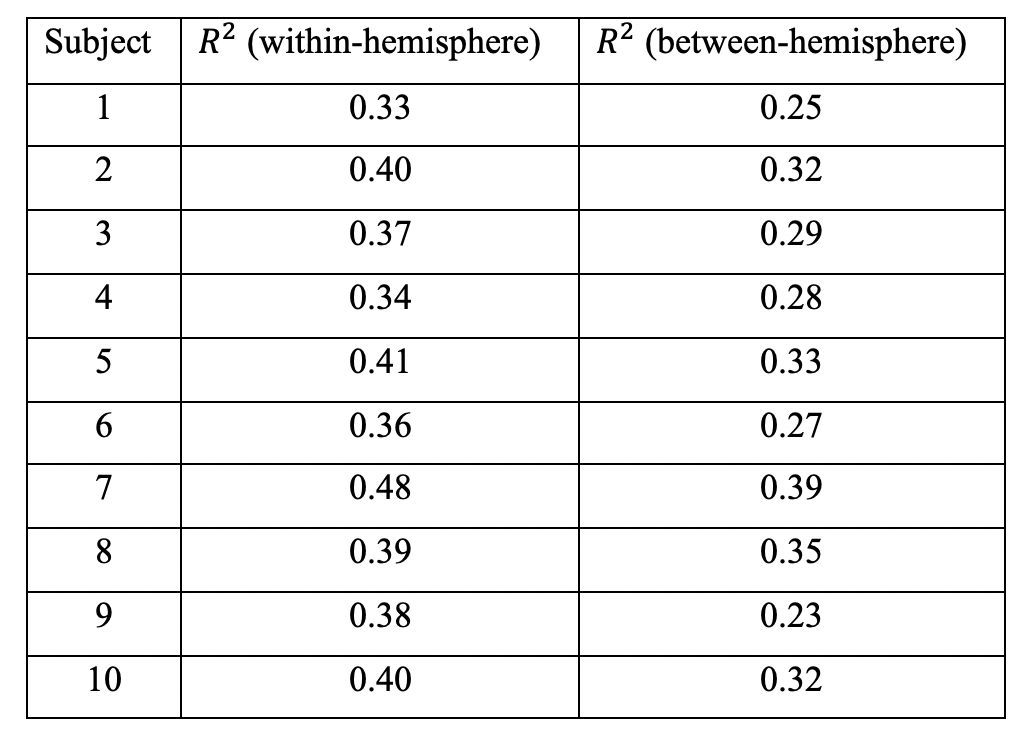
Further probing into the relationship between strength (S) and topological connectomes (T) show distinct distribution patterns between within- and between-hemisphere connections; Figure 3 (a) & (b) illustrate these different patterns from an example subject. In addition, our results reveal that between-hemisphere connections have longer connection length and weaker strength than within-hemisphere connections (data not shown). Specifically, fitting results demonstrate that between-hemisphere connections follow a Gaussian distribution (Figure 3 (a)), whereas within-hemisphere connections tend to follow a linear model (Figure 3 (b)). Also, we could observe similar patterns across the subjects (as can be seen in the goodness of fit measures in Table 2).
DISCUSSION
Our study shows that incorporating brain topological information can significantly improve the modelling of network strength than the conventional method where the topology of brain network is measured only using connectivity strength and streamline length. This new model should benefit further understanding of the working principle of brain networks.Importantly, our results show that network thresholding could dramatically alter the relationship between the connection strength and physical length; this would inevitably compromise further network analyses. One could argue that those removed weak edges are likely false positives. However, if weak edges are mostly spurious, discarding them should in principle improve fitting outcome, which is however not the case as shown in this study.
Interestingly, our proposed model demonstrates that within- and between-hemisphere connections bear distinct patterns in terms of the relationship between network strength and topological correlation matrix, which echo the differences of connection length and strength between within-hemisphere and between-hemisphere; this cannot be replicated with the simple model based on streamline length. In contrast, within- and between-hemisphere connections in normal functional networks usually have comparable magnitudes. Given the abovementioned disparities between functional and structural networks, our distinct findings between within- and between-hemisphere connections are likely to provide a starting point for reconciling the inconsistency between structural and functional networks. Future multimodal MRI data (functional and structural networks) are warranted to further explore such relationships.
Acknowledgements
No acknowledgement found.References
1. Papo D, Buldu JM, Boccaletti S, Bullmore ET. Complex network theory and the brain. Phil. Trans. R Soc. B. 2014; 369: 20130520.
2. Roberts JA, Perry A, Lord AR, Roberts G, Mitchell PB, Smith RE, Calamante F, Breakspear M. The contribution of geometry to the human connectome. NeuroImage. 2016; 124: 379-93.
3. Van Essen DC, et al. The WU-Minn Human Connectome Project: An overview. NeuroImage. 2013; 80:62-79.
4. Jeurissen B, et al. Multi-tissue constrained spherical deconvolution for improved analysis of multi-shell diffusion MRI data. NeuroImage. 2014; 103: 411-426.
5. Smith RE, et al. Anatomically constrained tractography: improved diffusion MRI streamlines tractography through effective use of anatomical information. NeuroImage. 2012; 62(3): 1924-1938.
6. Tournier JD, et al. Improved probabilistic streamlines tractography by 2nd order integration over fibre orientation distributions. Proc. ISMRM. 2010; p.1670.
7. Smith RE, et al. SIFT2: Enabling dense quantitative assessment of brain white matter connectivity using streamlines tractography. NeuroImage. 2015; 119: 338-351.
8. Dale AM, et al. Cortical surface-based analysis: I. Segmentation and surface reconstruction. NeuroImage. 1999; 9: 179-194.
9. Desikan RS, et al. An automated labeling system for subdividing the human cerebral cortex on MRI scans into gyral based regions of interest. NeuroImage. 2006; 31: 968-980.
10. Patenaude B, et al. A Bayesian model of shape and appearance for subcortical brain segmentation. NeuroImage. 2011; 56(3): 907-922.
Figures