4469
Does the intensity inhomogeneity field in diffusion MRI data affect constrained spherical deconvolution results?1Image Sciences Institute, University Medical Center Utrecht, Utrecht, Netherlands, 2Department of Radiology, University Medical Center Utrecht, Utrecht, Netherlands
Synopsis
The correction for the intensity inhomogeneity field (IIF) is becoming de-facto a pre-processing step in diffusion MRI, but its effect on CSD remains unclear. In this study, we investigated the fundamental effects of the IIF on CSD and the effectiveness of corrections based on a tool commonly applied to structural MRI (N4ITK). We show that the IIF modulates the amplitude of the fiber orientation distribution (FOD), influencing not only the estimation of the response function, but also subsequent uses of the FOD amplitude, as tractography termination criteria or the estimation of the number of fibers (NuFO).
Introduction
Intensity inhomogeneity field (IIF) affects all MRI modalities, and originates from an interplay of effects, including the efficiency of the transmission field1 (B1+). In structural MRI, the IIF is commonly corrected with post-processing techniques. In diffusion MRI (dMRI) applications as constrained spherical deconvolution2 (CSD), the use of tools as N4ITK3 has similarly been suggested, with the idea of preventing spatially varying scaling of the fiber orientation distributions4,5 (FOD). Here, we investigate the effect of the IIF on CSD-related steps as the response function estimation, fiber tractography and FOD-derived metrics as the number of fibers6 (NuFO).Methods
Brain data of one healthy volunteer (female, 27 years old) was acquired at 3T at the UMC Utrecht. The acquisition included a 3D T2-weighted scan (voxel size 1x1x1mm3, TE=258ms, TR=2.5s), a B1+ measurement with variable repetition time (voxel-size 3x3x6mm3), and a dMRI sequence including 8 non-weighted images and 45 volumes at b = 2500s/mm2 (TE=90ms, TR=2s, voxel size 2x2x2.5mm3). The whole acquisition was repeated twice, before (Scan-1) and after (Scan-2) repositioning of the subject, respectively. Additionally, we considered data of 2 subjects from the HCP database [7] (HCP-1 and HCP-2).The in-house dMRI data was pre-processed with ExploreDTI8 to correct motion and eddy currents (affine registration) and EPI distortions (non-linear registration to the T2-weighted image). The processing resulted in a dataset in anatomical space with a voxel resolution of 1.5x1.5x1.5mm3. Consequently, the IIF of each dMRI sequence was estimated with N4ITK using the first b = 0 s/mm2 volume. The B1+ images were registered to the resampled T2-weighted image with Elastix using a rigid transformation. Once the IIF is estimated, the dMRI data is corrected by dividing each 3D volume by the IIF itself.
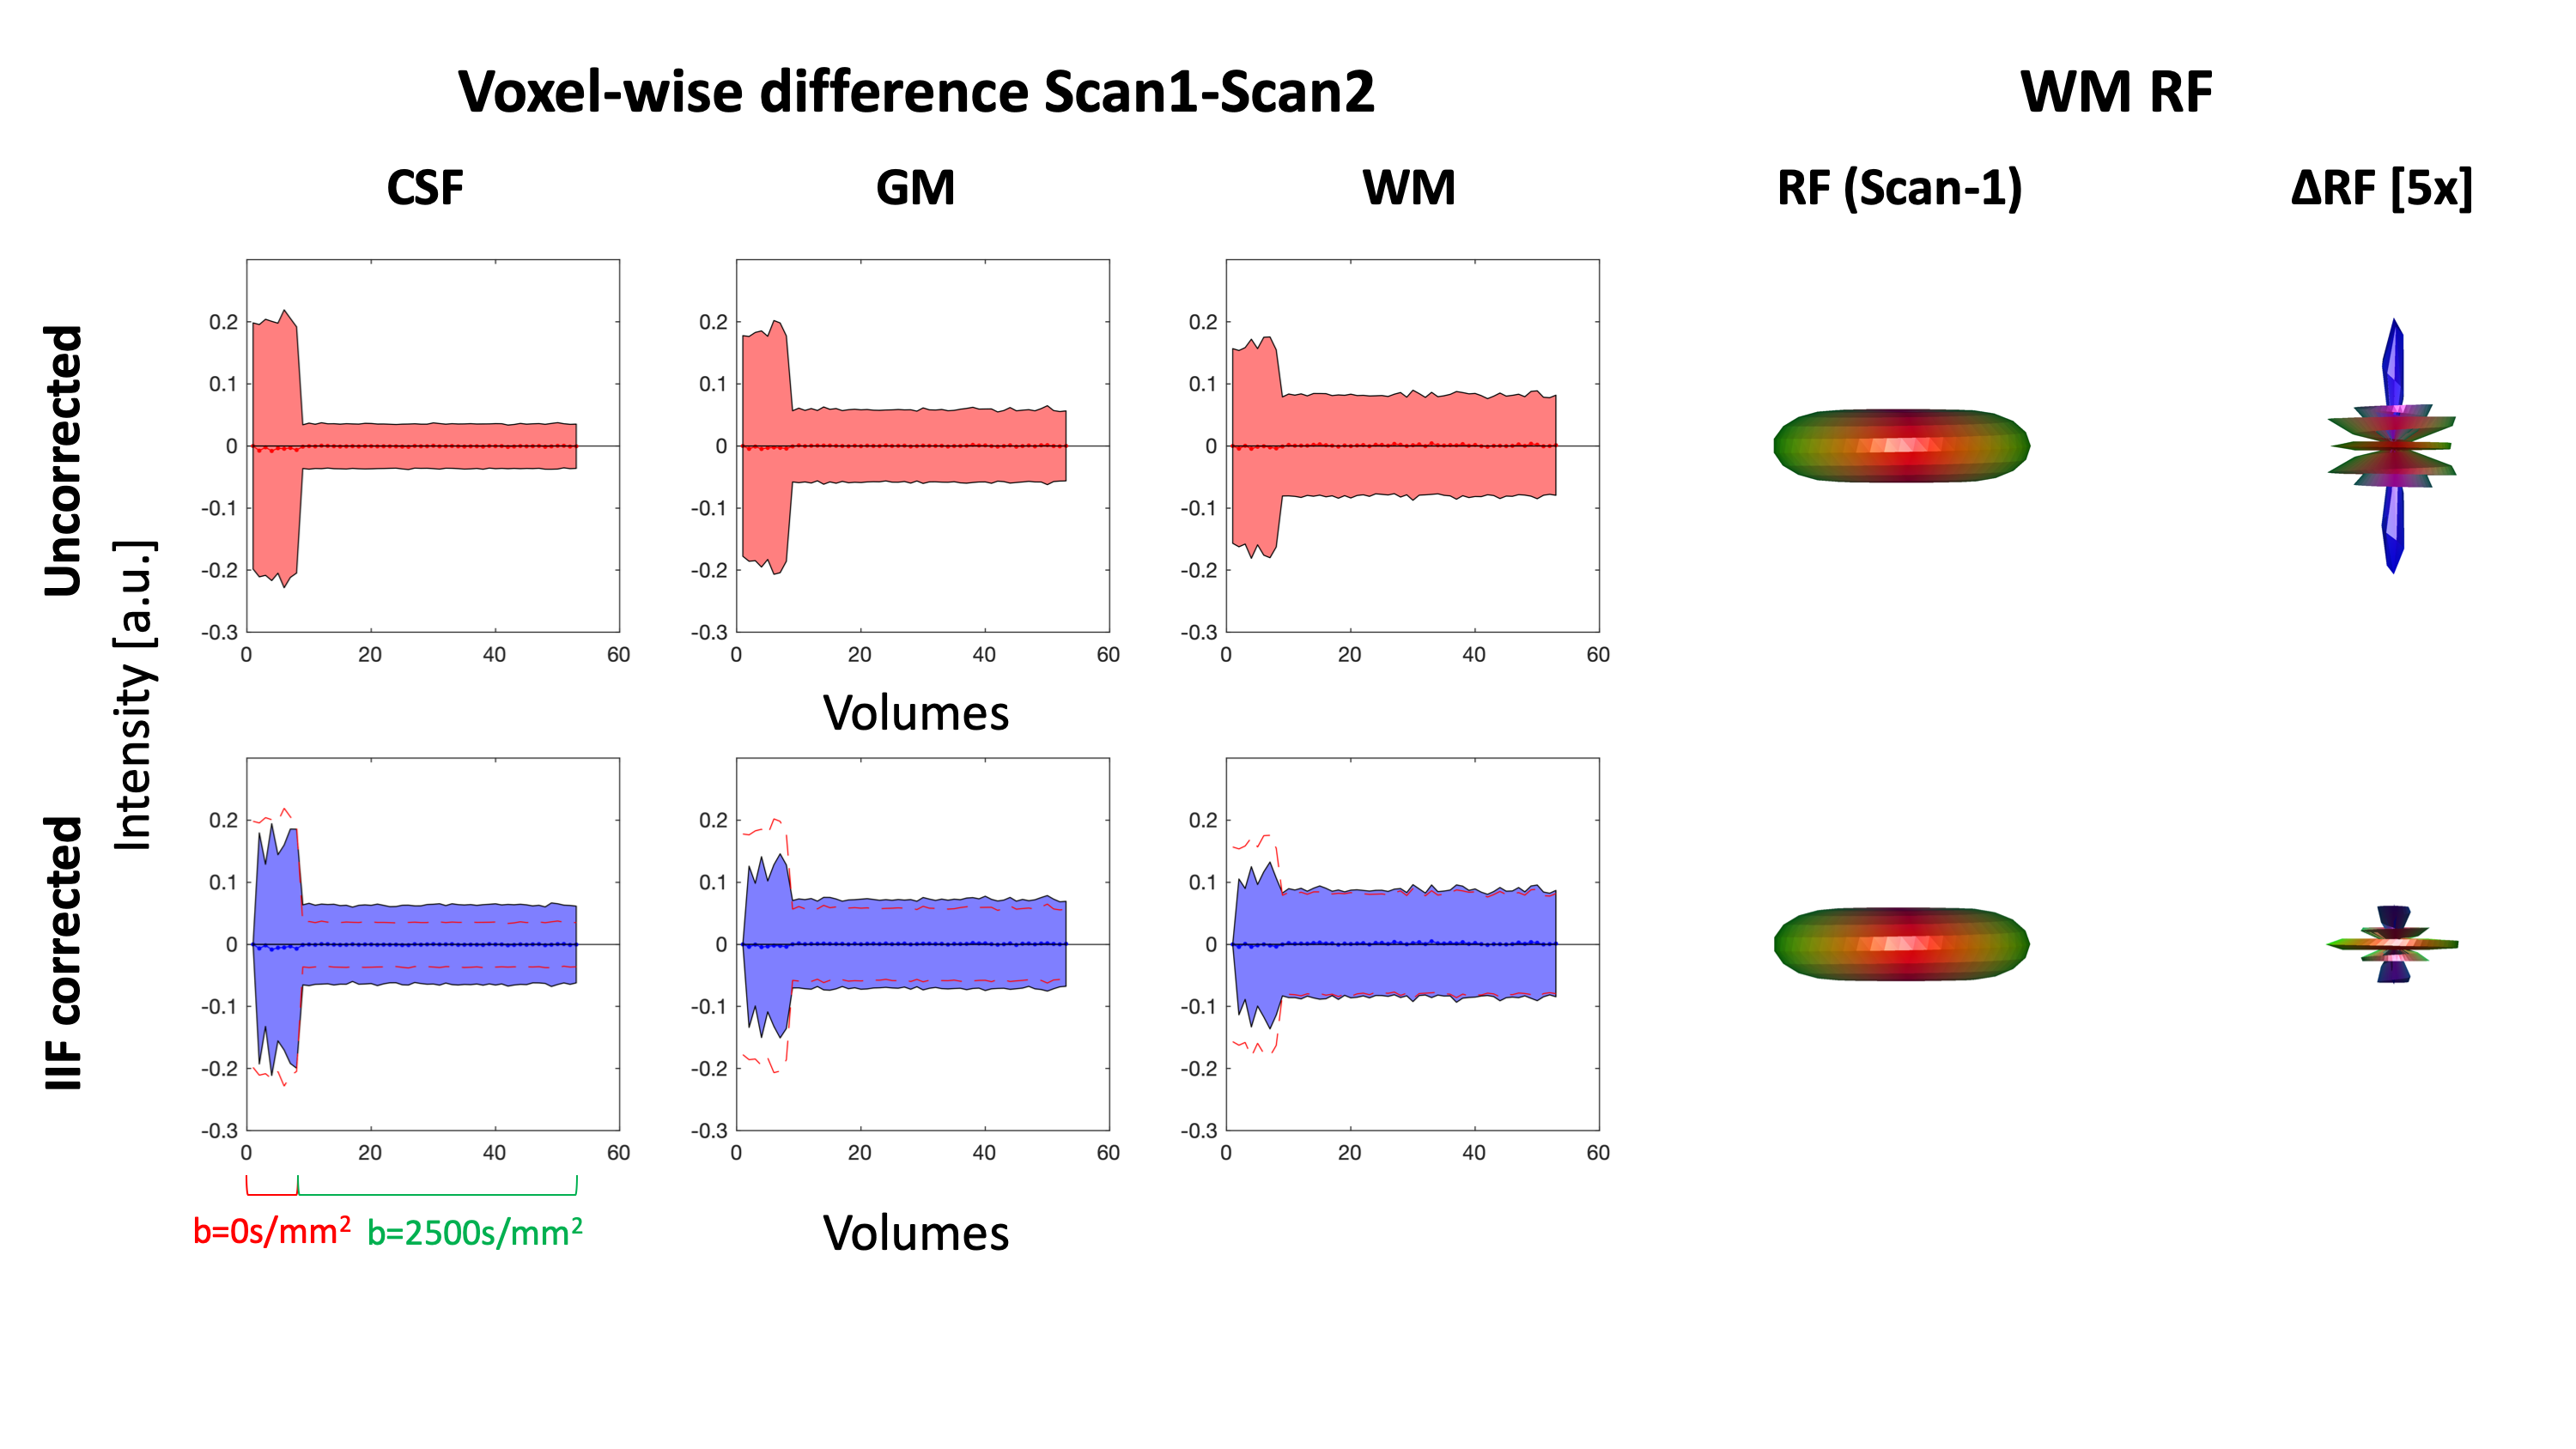
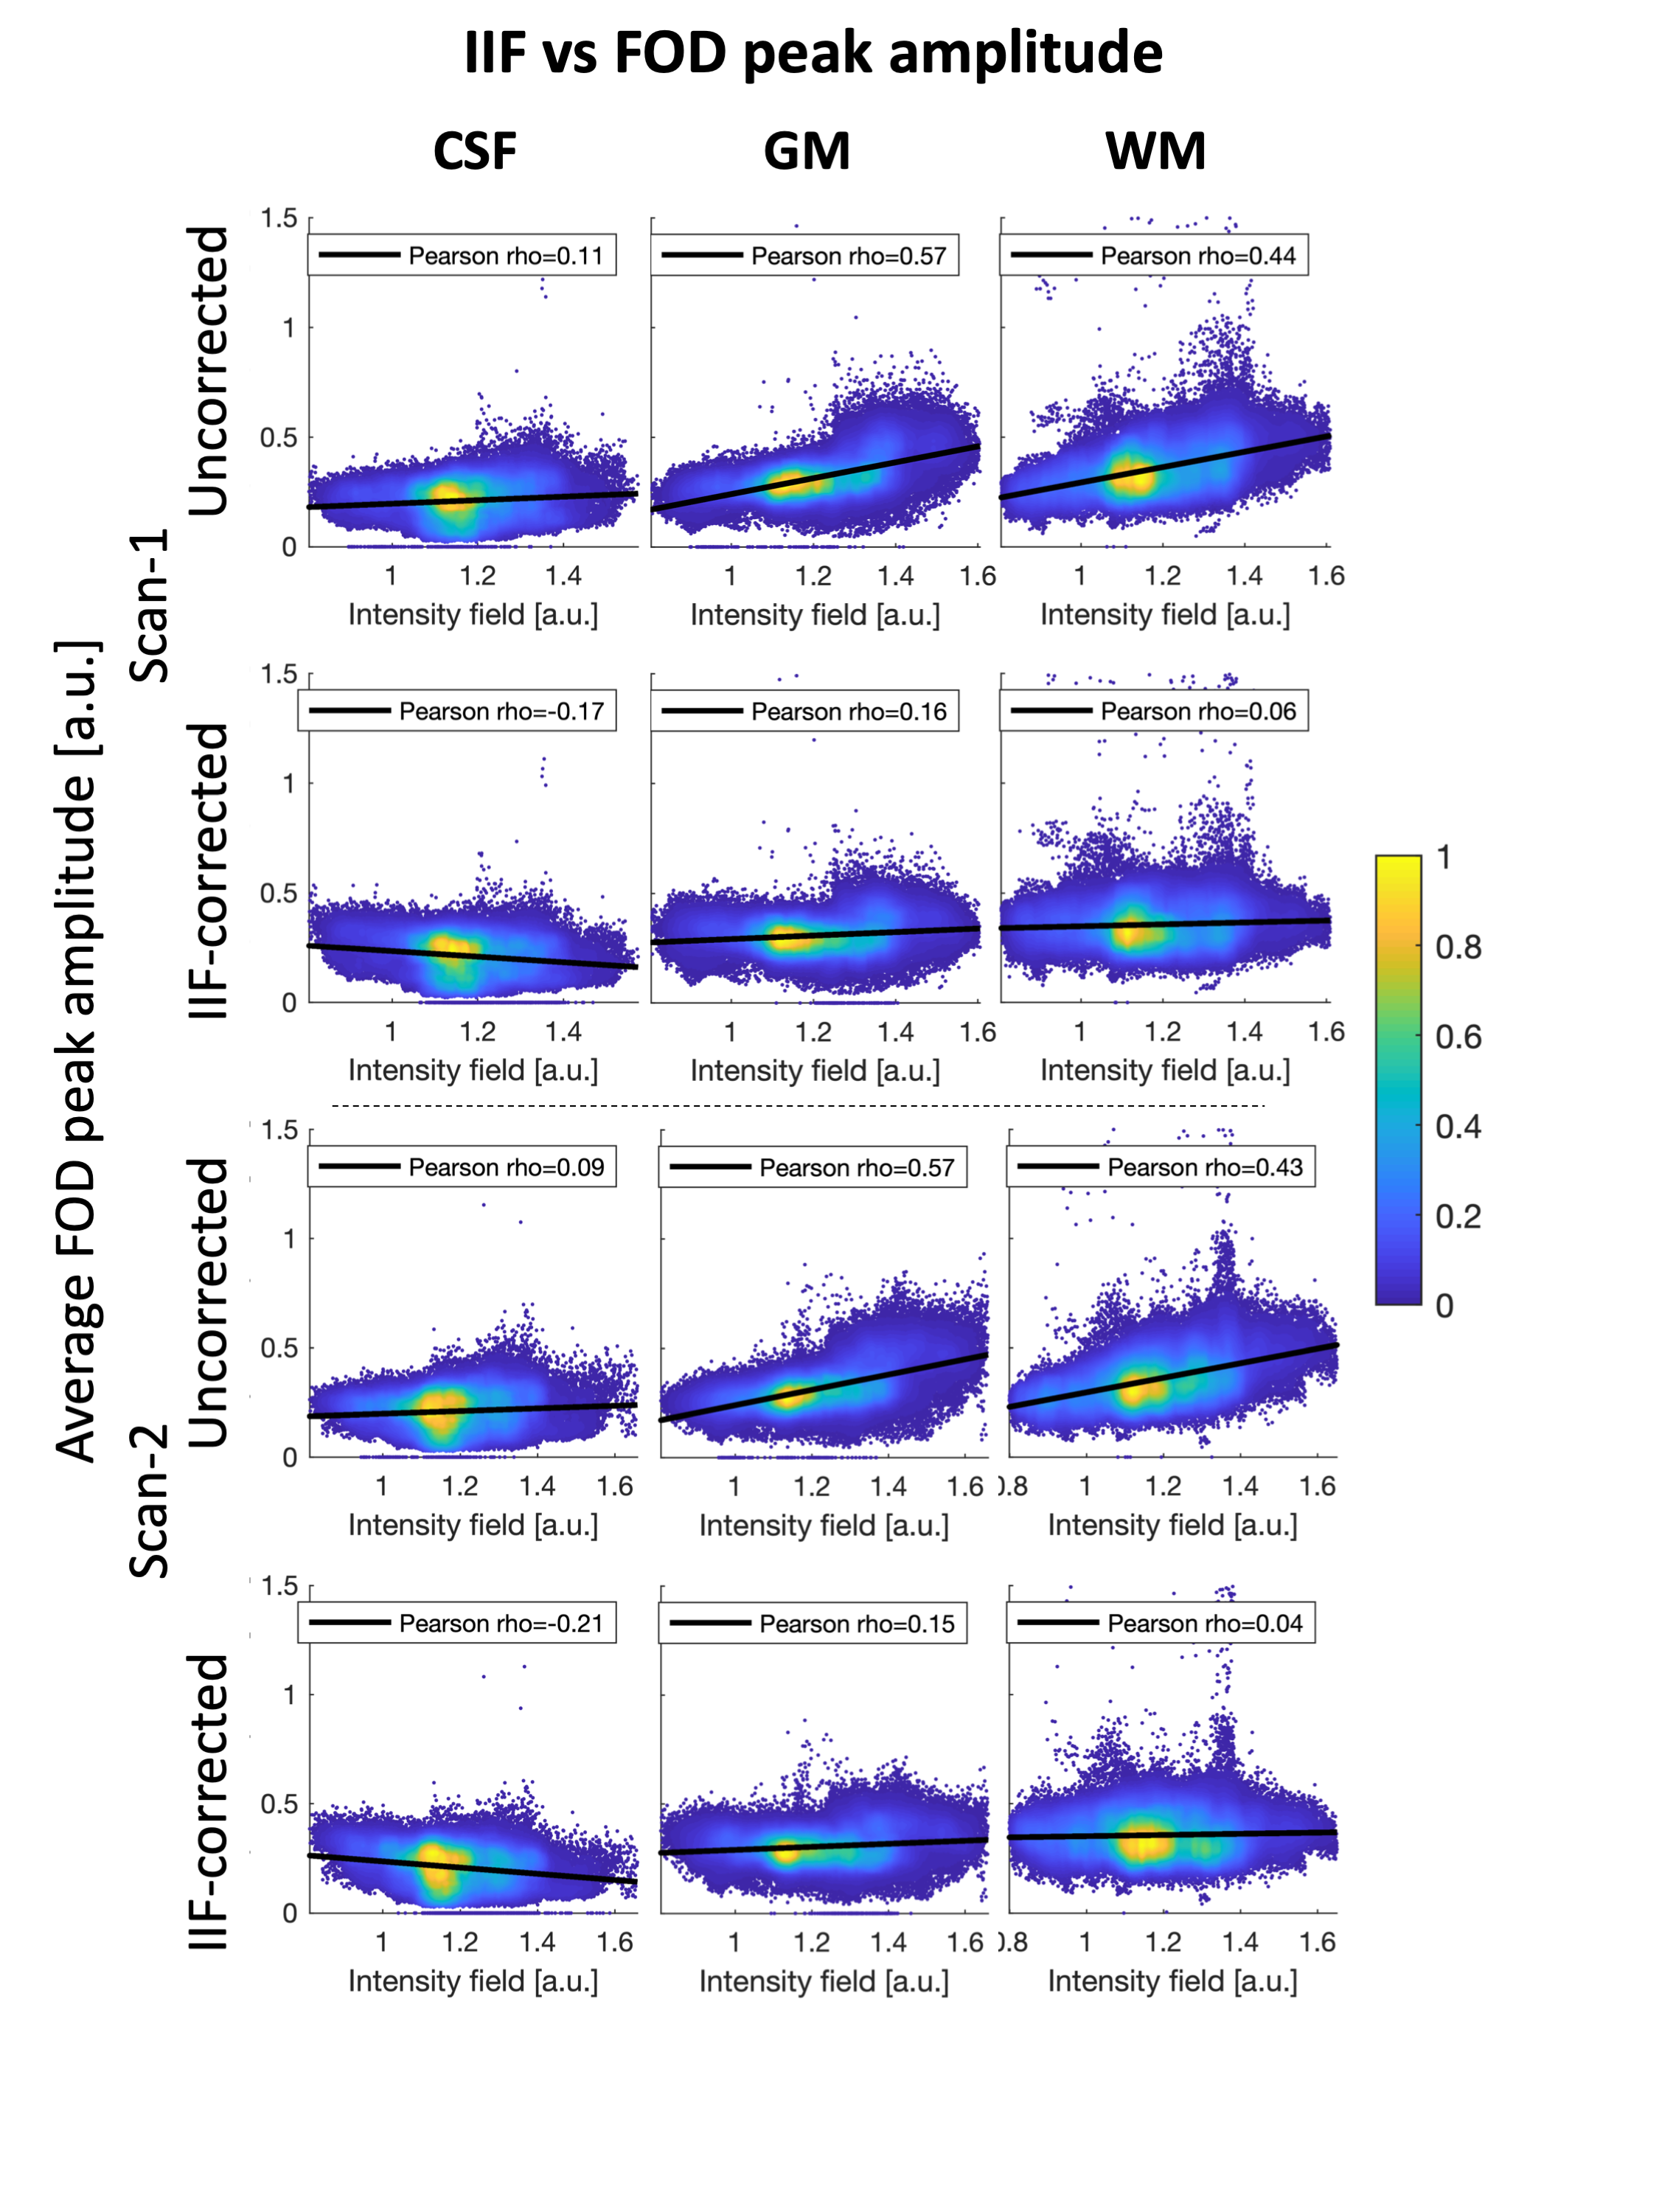
To evaluate the role of the B1+ field in the IIF, we evaluated their voxel-wise Pearson correlation. On Scan-1 and Scan-2, we verified whether correcting for the IIF reduces the inter-scan variability of the data by evaluating the standard deviation of the voxel-wise difference of the two acquisitions. Subsequently, we performed CSD in ExploreDTI with recursive calibration of the response function9 (RF) and evaluated whether correcting for the IIF reduces the inter-scan variability of the RF. The correlation between the IFI and the mean voxel-wise FOD amplitude was evaluated using Pearson correlation.
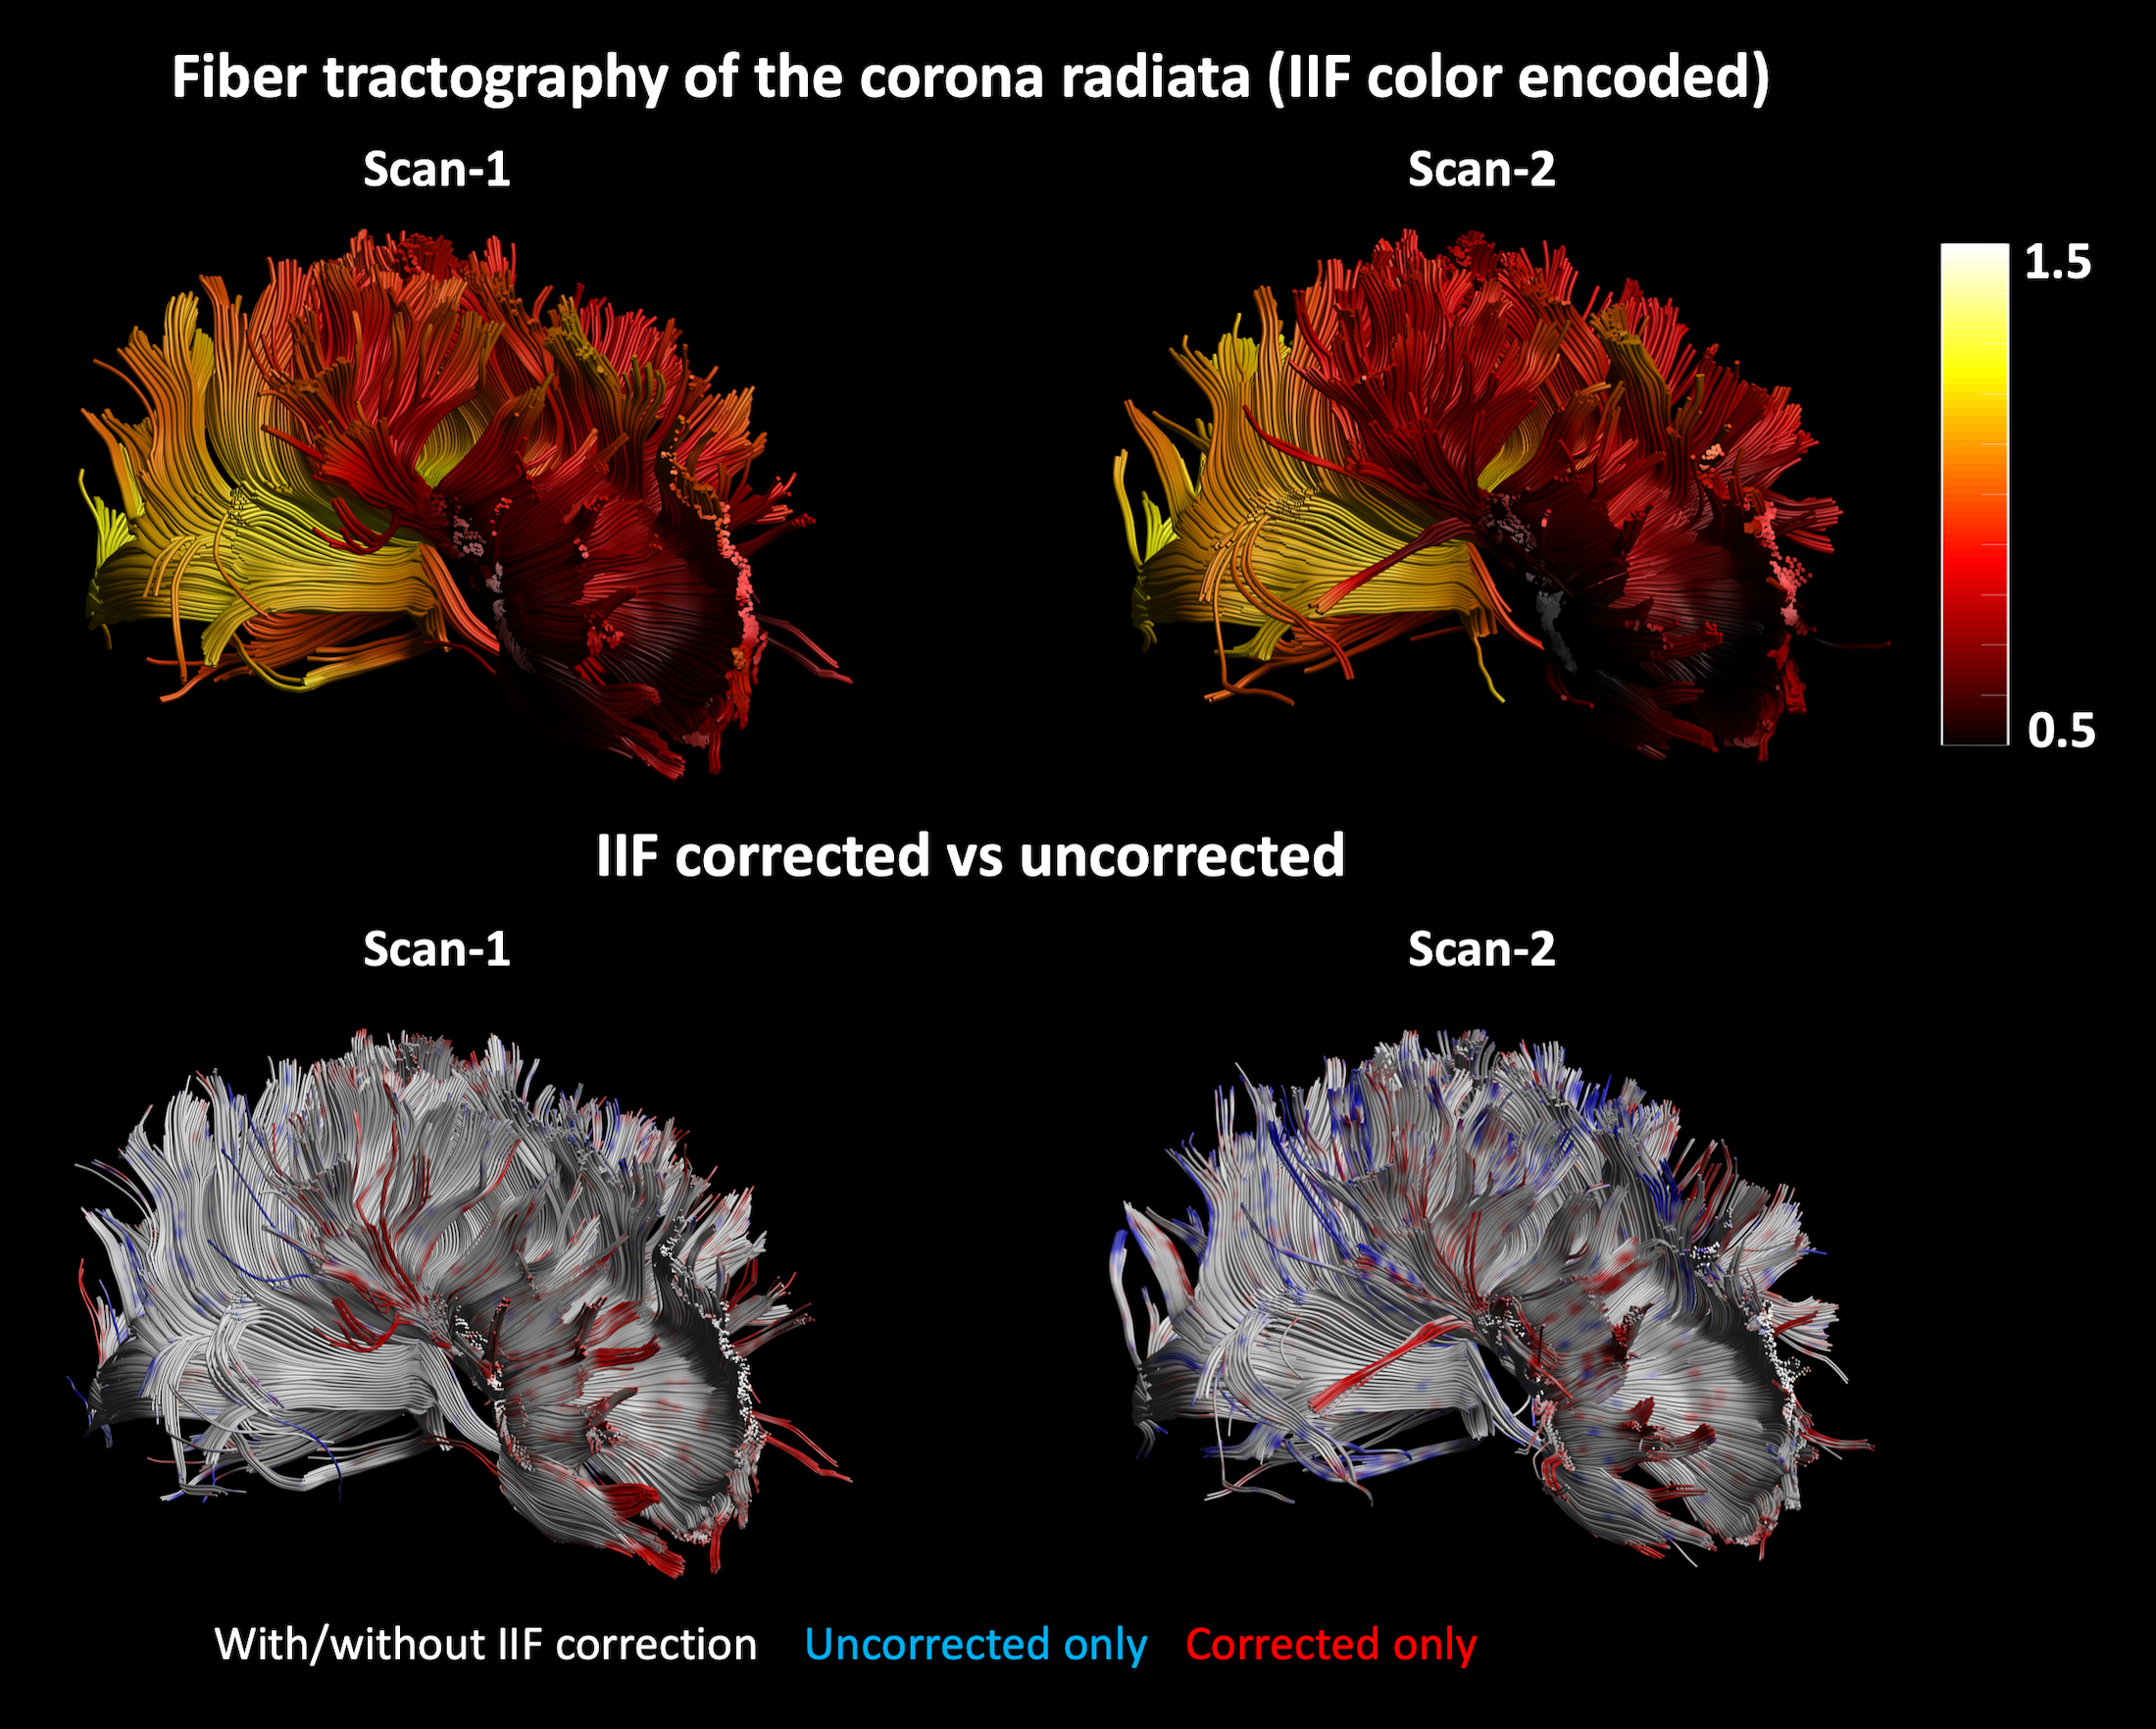
Fiber tractography of Scan-1 and Scan-2 was performed by placing a seed region of interest (ROI) and two logical AND gates on the corpus callosum, to reconstruct the corona radiata. The termination criteria were FOD threshold 0.3, angle threshold 30 degrees. Finally, the NuFO metric was derived from the FOD of HCP-1 and HCP-2 before and after IIF correction.
Results
An axial slice of the B1+ and IIF of Scan-1 and Scan-2 are shown in Fig. 1. Both the B1+ and the IIF are similar across acquisitions, as shown by their very strong self-correlation above 0.97, but poorly correlated to each other. Fig. 2 shows the standard deviation of the voxel-wise difference between the two time-points. The IIF correction reduces the variability of the b = 0 s/mm2 volumes, but increases the variability of the data at b = 2500 s/mm2 in CSF and GM. The difference between the RF estimated at the two timepoints, shown in Fig. 2, is smaller after IIF correction.When applying CSD, a significant correlation between the IIF and the FOD amplitude is observed on the uncorrected data in Fig. 3, but not after applying N4ITK. Fig. 4 shows that the IIF can affect fiber tractography results, by reducing the FOD peak amplitude below the termination threshold. In our acquisition configuration, the frontal lobe was more prone to this kind of error than the rest of the brain.
On HCP data, the correcting for the IIF affects the NuFO, as shown in Fig. 5. After correction, less peaks are observed in proximity of the outer edges of the brain, where the coil sensitivity profile is likely high. Conversely, more peaks are revealed in the middle of the brain, where the signal intensity is typically lower.
Results and Discussion
In this work, we have investigated the IIF and its effect on CSD estimates in dMRI and explored its origin and whether it is possible to attenuate it by means of post processing methods. The main effect of the IIF is the scaling of the FOD peak amplitudes, which can be removed post-hoc (Fig. 3), improving the extents of fiber tractography (Fig. 4). In our dataset, the IIF is largely uncorrelated to the B1+ field, which is therefore not suitable as basis for the IIF correction. Also, little differences were observed in a scan-rescan experiment, which suggests little sensitivity of the IIF to motion.While the results here presented should be interpreted within the limitations of a single dataset, we showed that the IIF does play a critical role in decreasing inter-scan differences in the response function estimation (Fig. 2). This also generalizes to data from the HCP database (Fig. 5) and suggests that the IIF plays a role on FOD-derived metrics. Altogether, these results support previous works4,5 suggesting the IIF correction as an important pre-processing step in CSD .
Acknowledgements
No acknowledgement found.References
[1] I. Uwano et al., “Intensity inhomogeneity correction for magnetic resonance imaging of human brain at 7T.,”Med. Phys., vol. 41, no. 2, p. 022302, 2014.
[2] J.-D. Tournier, C.-H. Yeh, F. Calamante, K.-H. Cho, A. Connelly, and C.-P. Lin, “Resolving crossing fibres using constrained spherical deconvolution: validation using diffusion-weighted imaging phantom data.,” Neuroimage, vol. 42, no. 2, pp. 617–25, Aug. 2008.
[3] N. J. Tustison et al., “N4ITK: improved N3 bias correction.,” IEEE Trans. Med. Imaging, vol. 29, no. 6, pp. 1310–20, Jun. 2010.
[4] I. I. Maximov, D. Alnæs, and L. T. Westlye, “Towards an optimised processing pipeline for diffusion magnetic resonance imaging data: Effects of artefact corrections on diffusion metrics and their age associations in UK Biobank,” Hum. Brain Mapp., no. January, pp. 4146–4162, 2019.
[5] D. Raffelt et al., “Apparent Fibre Density: A novel measure for the analysis of diffusion-weighted magnetic resonance images,” Neuroimage, vol. 59, no. 4, pp. 3976–3994, 2012.
[6] F. Dell’Acqua, A. Simmons, S. C. R. Williams, and M. Catani, “Can spherical deconvolution provide more information than fiber orientations? Hindrance modulated orientational anisotropy, a true-tract specific index to characterize white matter diffusion,” Hum. Brain Mapp., vol. 34, no. 10, pp. 2464–2483, 2013.
[7] D. C. Van Essen, S. M. Smith, D. M. Barch, T. E. J. Behrens, E. Yacoub, and K. Ugurbil, “The WU-Minn Human Connectome Project: An overview,” Neuroimage, vol. 80, pp. 62–79, 2013.
[8] A. Leemans, B. Jeurissen, J. Sijbers, and D. K. Jones, “ExploreDTI: a graphical toolbox for processing, analyzing, and visualizing diffusion MR data.,” in 17th annual meeting of the International Society for Magnetic Resonance in Medicine, Honolulu, Hawaii, USA, 2009, p. 3537.
[9] C. M. W. Tax, B. Jeurissen, S. B. Vos, M. A. Viergever, and A. Leemans, “Recursive calibration of the fiber response function for spherical deconvolution of diffusion MRI data,” Neuroimage, vol. 86, pp. 67–80, 2014.
Figures