4468
Diffusion MRI analysis of complex fiber configurations in human brain white matter and cortex1Image Sciences Institute, UMC Utrecht, Utrecht, Netherlands
Synopsis
Fiber configurations in the human brain white matter and cortex are dominant with multiple orientations. In this work, we investigated the prevalence of crossing fibers in the brain, utilizing the latest multi-shell multi tissue (MSMT) constrained spherical deconvolution (CSD) method to analyze diffusion MRI data from the Human Connectome Project (HCP). Voxel-wise number of fiber orientation (NuFO) was calculated from 56 subjects, using the Generalized Richardson Lucy (GRL) framework, which offers robust fiber orientation distribution (FOD) estimation. Our results suggest that 83% of the voxels have at least one and 37% of the voxels have at least two fiber orientations.
Introduction
Diffusion MRI (dMRI) is commonly used to investigate the orientation and microstructure of white matter (WM) and recently has gained attention in studying the cortical grey matter (GM) [1]. Different layers of the cortex show distinct diffusion properties [2]–[5] offering a window into dMRI in order to investigate the organization of the cortex. On the other hand, methodological developments in spherical deconvolution [6] modeling, as in the Generalized Richardson Lucy (GRL) [7] framework offer robust estimation of fiber orientation distributions (FOD) with less spurious peaks in both WM and GM when compared to single-shell methods, as previously observed by Jeurissen et al. [8]. In this work, we apply GRL to investigate population properties of crossing fiber configurations in human brain white matter and cortex using data provided by the Human Connectome Project (HCP).Methods
Minimally pre-processed dMRI data were collected from the S500 release of the HCP [9],[10]. Briefly, a motion- and distortion corrected dataset consisted of 18 non-DWIs (b-value = 0 s/mm2) and 90 DWIs per shell with b-values equal to 1000/2000/3000 s/mm2, with a voxel size of 1.25mm isotropic and a sample size of 56 participants. For diffusion tensor imaging (DTI) estimates, 9 non-DWIs and 90 DWIs of the b=1000 s/mm2 shell were selected and the weighted linear least squares (WLLS) [11] estimation method was utilized. From the DTI model fractional anisotropy (FA) was calculated. Number of fiber orientations (NuFO) [12] and the amplitude of the dominant peak, also known as apparent fiber density (AFD) [13], were calculated from the GRL estimated FODs, which is a multi-shell, multi-tissue (MSMT) variant of the damped Richardson-Lucy algorithm [6]. In GRL, the response functions (RF) of WM, grey matter (GM) and cerebrospinal fluid (CSF) were modelled separately. The RF of WM was defined using the diffusion tensor imaging (DTI)-based fixed tensor modelling approach using all 288 DWI volumes. In addition, we also corrected for the gradient nonlinearities in the diffusion-weighted gradients [14]–[16]. Briefly, due to the strong gradients of the custom-made HCP scanner significant nonlinearities were present, which caused the strength (aka. the b-value) and the direction of the diffusion-weighted (DW) gradients to differ in reality from their nominal (or desired) version. Therefore in both the tensor and FOD estimations we used the correct, spatially varying b-values and vectors voxel by voxel, rather than a global one. The main orientations of the FODs were derived with a gradient descent method and then NuFO was determined while discarding FOD peaks below 20% of maximum peak amplitude. The maximum NuFO was limited to 3. After calculating the scalars (FA, NuFO and AFD) all maps were transformed to MNI space. Furthermore, the spatially normalized NuFO maps were mapped to the Freesurfer [17] surface template via the computational anatomy toolbox (CAT) [18]. The area between the white matter surface and the central surface (CS), and the area between the CS and the grey matter surface were mapped separately.Results
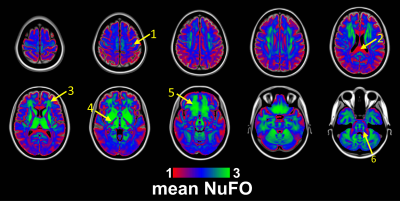
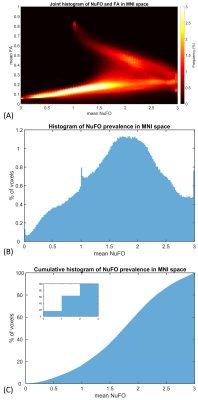
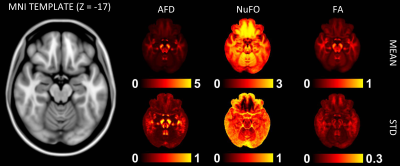
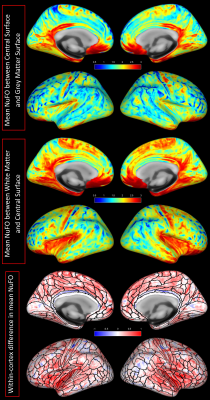
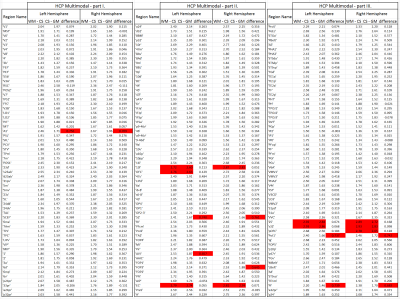
Fig. 1 shows the volumetric prevalence of NuFO in standard MNI space, highlighting some remarkable features with high fiber complexity in (1), (3), (5) and (6), reinforcing the dominant single fiber structure of the genu and splenium of corpus callosum (CC) in (2) and showcasing the partial volume effect (PVE) of NuFOs in (4). Fig.2/A show the voxelwise relationship between spatially normalized FA and NuFO, while Fig. 2/(B) and (C) show the histogram and cumulative histogram, respectively. As expected, high FA regions show single fiber populations, while lower FA areas show a wide variety of NuFO. At very high levels of fiber complexity, the corresponding FA is converging to 0.2. The subfigure of Fig.2/C shows the highly discretized cumulative histogram. In Fig. 3, we examine the relationship between different dMRI scalars in the orbitofrontal cortex. NuFO shows a consistently high value, while both FA and AFD are small with narrow deviations in the region, pointing to a network of WM structures without a single clear dominant structure. The top part of fig. 4 shows the surface mapped NuFO from the upper cortical regions, between the Central Surface (CS) and the surface of the GM, while in the middle the mapped region is between the WM surface and the CS. Bottom of Fig.4 shows the difference in NuFO between the top and bottom GM layers. Fig.5 shows a table of mean NuFO based on the HCP multimodal atlas [19].Discussion and Conclusion
We investigated crossing fiber configurations in the human brain from a large-scale, healthy cohort. A previous study, Jeurissen et al.[20], already showed the dominance of crossing fibers all over the white matter, which experimental setup here was extended to a higher sample size and a higher angular resolution. Our results suggest that 83% of the voxels have at least a single and 37% of the voxels have at least two fiber orientations. Also, it is clear that NuFO in the cortex shows coherent patterns of fiber complexity, with high values in the orbital-, polar frontal cortex, in the entorhinal cortex, in the medial prefrontal cortex as well as in the primary motor cortex, suggesting the feasibility of in vivo intracortical tractography in humans, which had been demonstrated ex vivo [21],[22].Acknowledgements
No acknowledgement found.References
[1] Y. Assaf, “Imaging laminar structures in the gray matter with diffusion MRI,” Neuroimage, no. December 2017, pp. 1–12, 2018.
[2] T. K. Truong, A. Guidon, and A. W. Song, “Cortical depth dependence of the diffusion anisotropy in the human cortical gray matter in vivo,” PLoS One, vol. 9, no. 3, 2014.
[3] J. A. McNab et al., “Surface based analysis of diffusion orientation for identifying architectonic domains in the in vivo human cortex,” Neuroimage, vol. 69, pp. 87–100, 2013.
[4] M. Aggarwal, D. W. Nauen, J. C. Troncoso, and S. Mori, “Probing region-specific microstructure of human cortical areas using high angular and spatial resolution diffusion MRI,” Neuroimage, vol. 105, pp. 198–207, 2015.
[5] J. A. McNab, S. Jbabdi, S. C. L. Deoni, G. Douaud, T. E. J. Behrens, and K. L. Miller, “High resolution diffusion-weighted imaging in fixed human brain using diffusion-weighted steady state free precession,” Neuroimage, vol. 46, no. 3, pp. 775–785, 2009.
[6] F. Dell’Acqua et al., “A modified damped Richardson-Lucy algorithm to reduce isotropic background effects in spherical deconvolution,” Neuroimage, vol. 49, no. 2, pp. 1446–1458, Jan. 2010.
[7] F. Guo, A. Leemans, M. A. Viergever, F. Dell’Acqua, and A. De Luca, “Generalized Richardson-Lucy (GRL) for analyzing multi-shell diffusion MRI data,” Oct. 2019.
[8] B. Jeurissen, J. D. Tournier, T. Dhollander, A. Connelly, and J. Sijbers, “Multi-tissue constrained spherical deconvolution for improved analysis of multi-shell diffusion MRI data,” Neuroimage, vol. 103, pp. 411–426, 2014.
[9] M. F. Glasser et al., “The minimal preprocessing pipelines for the Human Connectome Project,” Neuroimage, vol. 80, pp. 105–124, Oct. 2013.
[10] D. C. Van Essen, S. M. Smith, D. M. Barch, T. E. J. Behrens, E. Yacoub, and K. Ugurbil, “The WU-Minn Human Connectome Project: An overview,” Neuroimage, vol. 80, pp. 62–79, 2013.
[11] J. Veraart, J. Sijbers, S. Sunaert, A. Leemans, and B. Jeurissen, “Weighted linear least squares estimation of diffusion MRI parameters: Strengths, limitations, and pitfalls,” Neuroimage, vol. 81, pp. 335–346, 2013.
[12] F. Dell’Acqua, A. Simmons, S. C. R. R. Williams, and M. Catani, “Can spherical deconvolution provide more information than fiber orientations? Hindrance modulated orientational anisotropy, a true-tract specific index to characterize white matter diffusion,” Hum. Brain Mapp., vol. 34, no. 10, pp. 2464–2483, 2013.
[13] D. Raffelt et al., “Apparent Fibre Density: A novel measure for the analysis of diffusion-weighted magnetic resonance images,” Neuroimage, vol. 59, no. 4, pp. 3976–3994, Feb. 2012.
[14] S. N. Sotiropoulos et al., “Advances in diffusion MRI acquisition and processing in the Human Connectome Project,” Neuroimage, vol. 80, pp. 125–143, 2013.
[15] R. Bammer et al., “Analysis and generalized correction of the effect of spatial gradient field distortions in diffusion-weighted imaging,” Magn. Reson. Med., vol. 50, no. 3, pp. 560–569, Sep. 2003.
[16] H. Y. Mesri, S. David, M. A. Viergever, and A. Leemans, “The adverse effect of gradient nonlinearities on diffusion MRI: From voxels to group studies,” Neuroimage, p. 116127, 2019.
[17] B. Fischl, “FreeSurfer,” NeuroImage, vol. 62, no. 2. Academic Press, pp. 774–781, 15-Aug-2012.
[18] C. Gaser and R. Dahnke, “CAT-a computational anatomy toolbox for the analysis of structural MRI data,” Hbm, vol. 2016, no. 7, pp. 336–48, 2016. [19] M. F. Glasser et al., “A multi-modal parcellation of human cerebral cortex,” Nature, vol. 536, no. 7615, pp. 171–178, 2016.
[20] B. Jeurissen, A. Leemans, J. D. Tournier, D. K. Jones, and J. Sijbers, “Investigating the prevalence of complex fiber configurations in white matter tissue with diffusion magnetic resonance imaging,” Hum. Brain Mapp., vol. 34, no. 11, pp. 2747–2766, Nov. 2013.
[21] A. Roebroeck, K. L. Miller, and M. Aggarwal, “Ex vivo diffusion MRI of the human brain: Technical challenges and recent advances,” NMR Biomed., vol. 32, no. 4, p. e3941, Apr. 2019.
[22] L. J. Edwards, E. Kirilina, S. Mohammadi, and N. Weiskopf, “Microstructural imaging of human neocortex in vivo,” Neuroimage, vol. 182, no. October 2017, pp. 184–206, 2018.
Figures
