4467
Cortical projections of the superoanterior fasciculus (SAF)1Image Sciences Institute, UMC Utrecht, Utrecht, Netherlands, 2Brain Connectivity and Behaviour Laboratory, Sorbonne Universities, Paris, France, 3NatBrainLab, Department of Forensics and Neurodevelopmental Sciences, Sackler Institute for Translational Neurodevelopment, King's College London, London, United Kingdom
Synopsis
The superoanterior fasciculus (SAF) is defined as a bilateral tract in the frontal lobe that resembles the structure of the anterior cingulum, but is located superior, anterior and lateral. In this work, we investigated the cortical projections of the structure utilizing the latest multi-shell multi tissue (MSMT) constrained spherical deconvolution (CSD) method to analyze diffusion MRI data from the Human Connectome Project (HCP). Our results show that the paracentral lobular, mid cingulate cortex and the orbital- and polar frontal cortex show high SAF termination prevalence, suggesting a novel connection in the frontal lobe.
Introduction
The superoanterior fasciculus (SAF) is defined as a bilateral tract in the frontal lobe that resembles the structure of the anterior cingulum, but is located superior, anterior and lateral. It was first identified in a recent investigation [1] using diffusion MRI (dMRI) with support from dissection [2] and polarized light imaging (PLI) [3]. The pathway appears to spread from the rostrum of the corpus callosum (CC) to the ascending ramus of the cingulate sulcus and is medial to the corona radiate. While the first investigation revealed the existence and discussed the prevalence of the SAF, the functional assessment of the structure remains uncharted. Cortical projection of fiber bundles offer insight into the functional involvement of a tract with comparing functional MRI (fMRI) [4], cytoarchitecture [5] or multimodal imaging [6] derived population-based maps. Previously, disconnectome studies [7] demonstrated the utility of the method in neuroscience [8], [9] as well as clinical studies [10], [11]. In this work, we explored the cortical projections of the SAF.Methods
Minimally pre-processed dMRI data were collected from the S500 release of the Human Connectome Project (HCP) [12], [13]. Briefly, a motion- and distortion corrected dataset consists 18 non-DWIs (b-value = 0 s/mm2) and 90 DWIs per shell with b-values equal to 1000/2000/3000 s/mm2, with a voxel size of 1.25mm isotropic and a sample size of 89 participants. Fiber orientation distribution (FOD) estimation was performed with the Generalized Richardson-Lucy (GRL) [14] method, which distinctly models the response functions (RF) of white matter (WM), grey matter (GM) and cerebrospinal fluid (CSF). The RF of WM was defined using the diffusion tensor imaging (DTI)-based fixed tensor modelling using all 288 DWI volumes. In addition, we also corrected for the gradient nonlinearities in the diffusion-weighted gradients during the FOD estimation procedure [15]–[17]. Then deterministic fiber tractography (FT) was performed in ExploreDTI [18] using spherical-harmonics of order 16. For tracking the SAF, automated tract selection was obtained by atlas-based tractography segmentation [19]. On the template dataset, we defined 4 Boolean ‘AND’ and ‘NOT’ ROIs: 2 axial AND, 1 sagittal NOT and 1 coronal NOT ROIs. The 2 axial AND ROIs were placed as follows: the first one was located at the height of approximately half the genu of the corpus callosum (CC) and the second ROI was placed 10 slices superior. A NOT ROI was placed midsagittal to exclude fiber pathways from the corpus callosum (CC) and one NOT was placed coronal posterior the genu below and above CC to exclude fibers from the inferior fronto-occipital fasciculus (iFOF) and the cingulum. After tracking the SAF, the binarized mask of the tract termination-points were transformed to MNI space, using the warp-files provided by the HCP-team, then mapped to the Freesurfer [20] surface template via the computational anatomy toolbox (CAT) [21]. Mean prevalence of tract terminations per vertex are presented on the inflated- and the central surfaces.Results
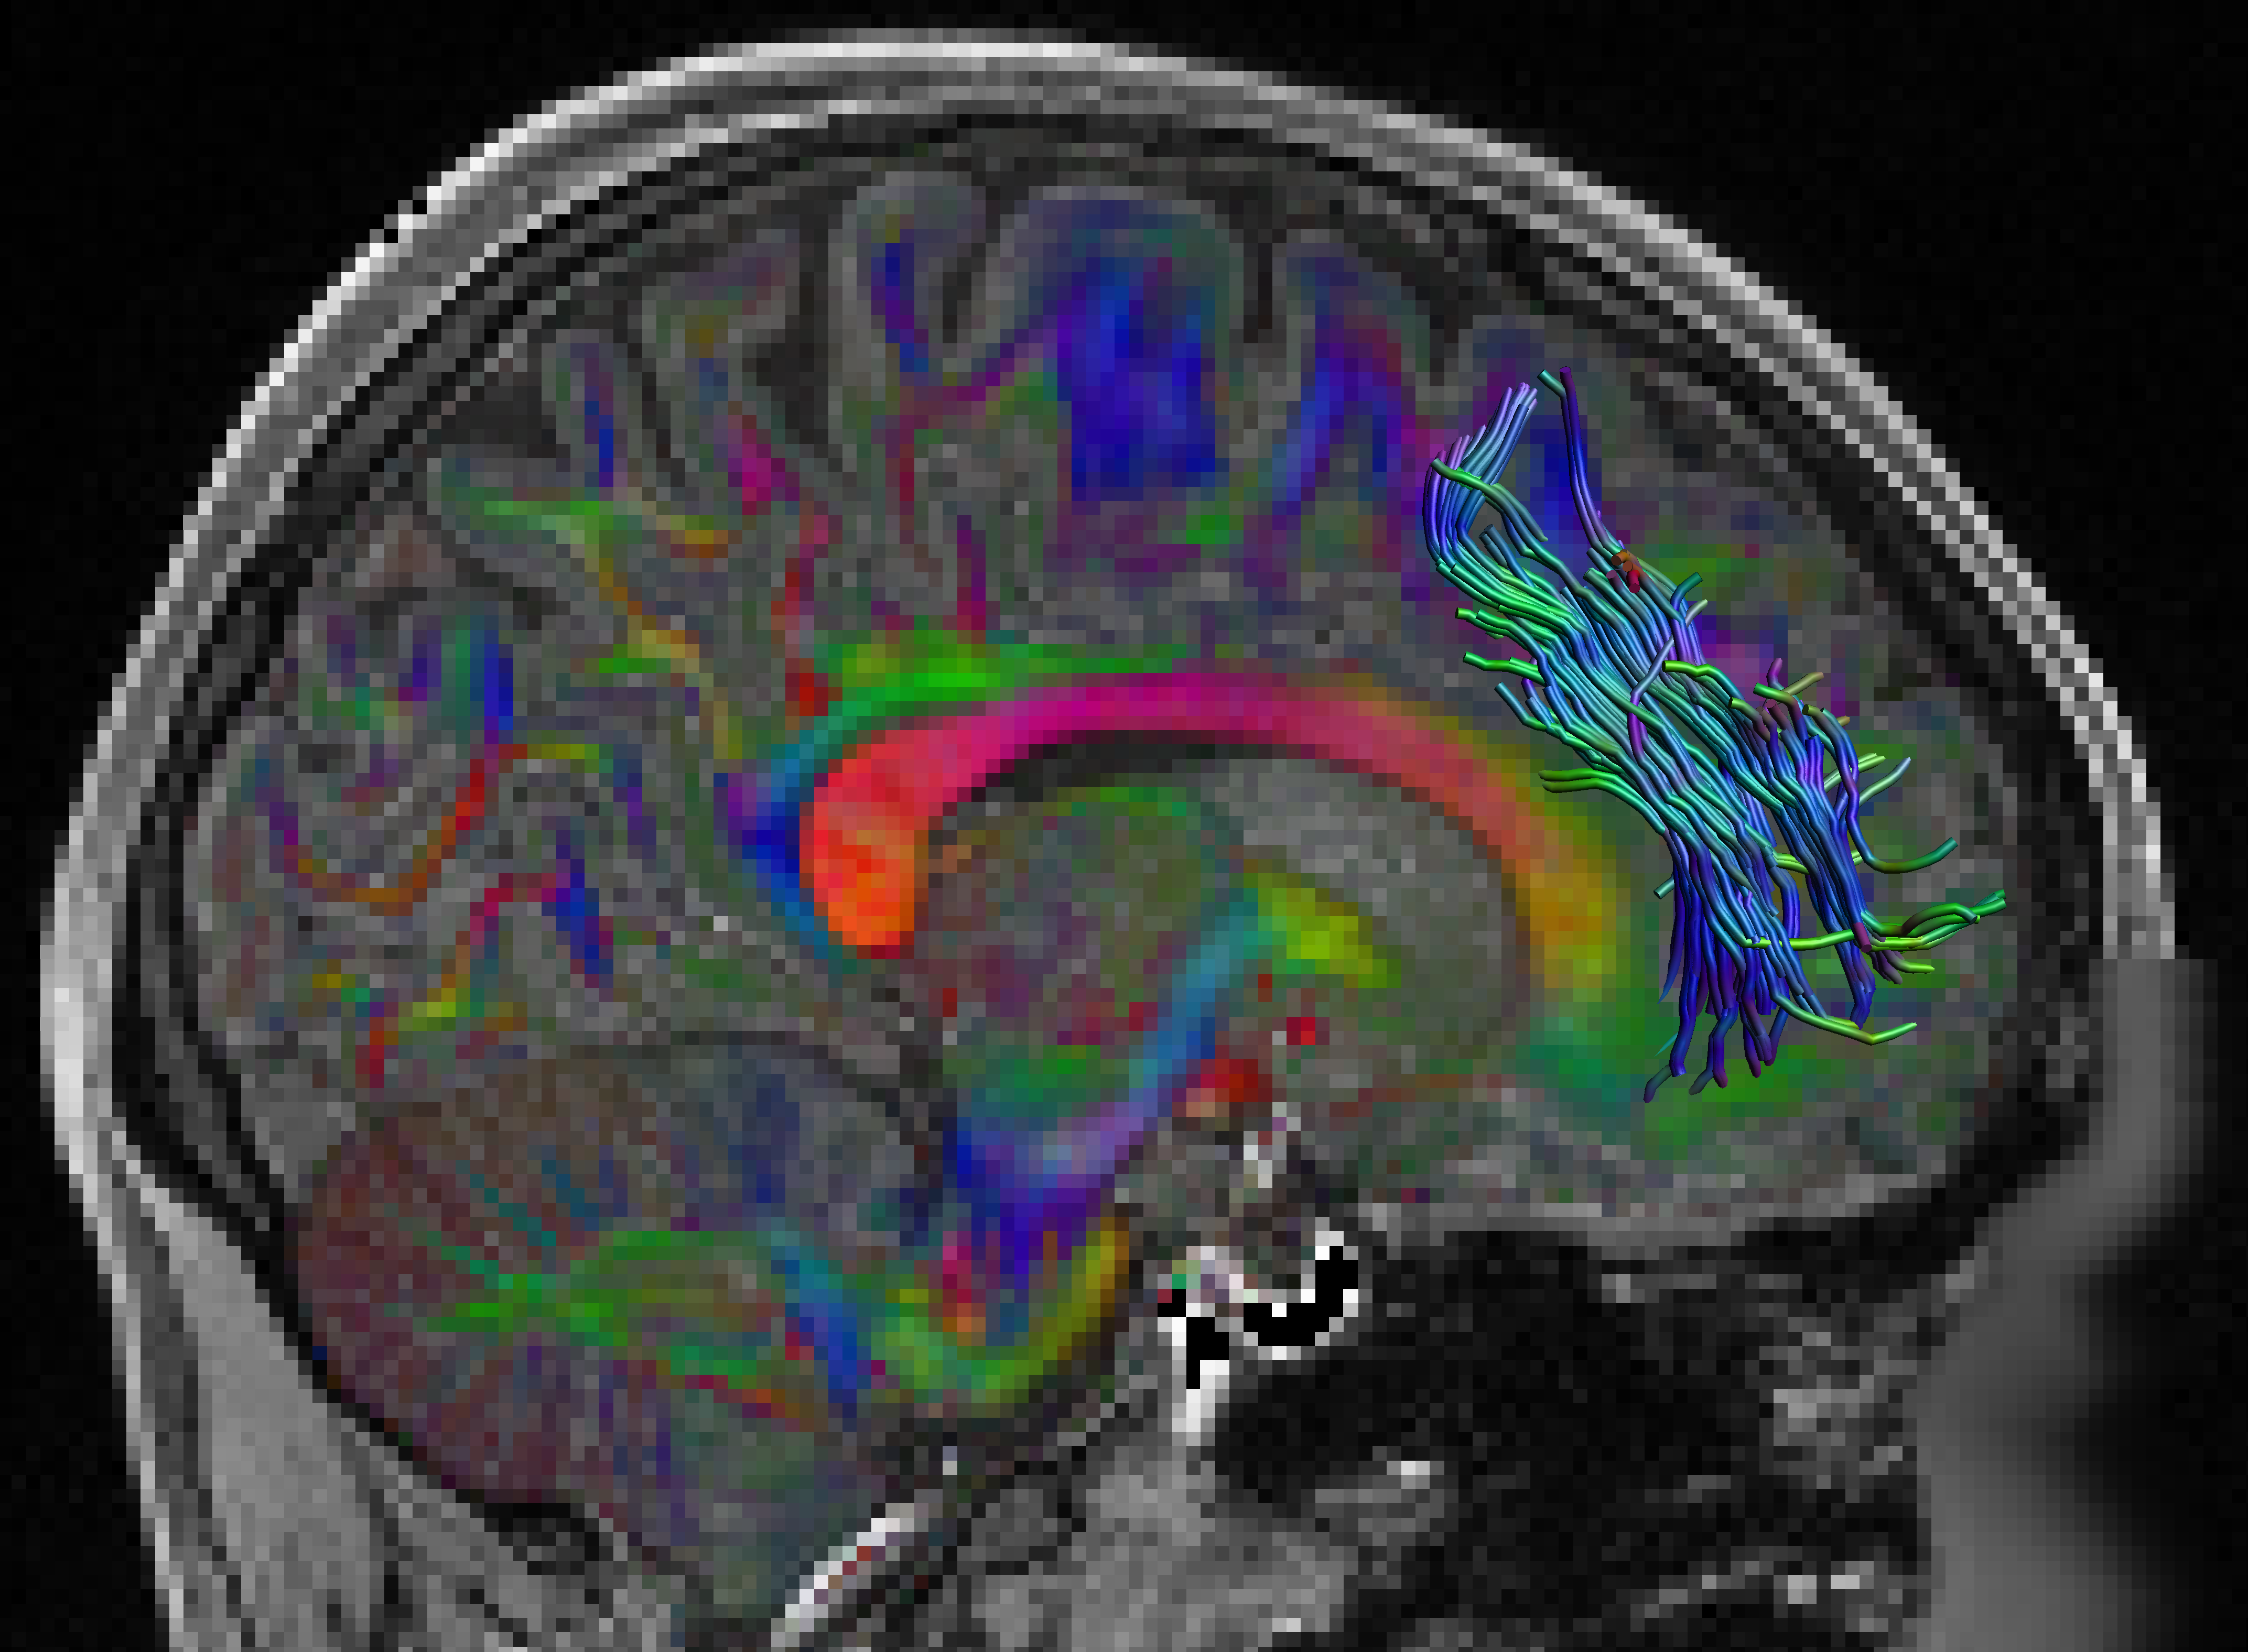
Fig. 1 shows the location of the SAF in the HCP example subject. Fig. 2 shows the prevalence overview of the SAF in MNI space from 89 subjects. Fig. 3 shows the surface projected overview of the SAF. Fig. 4 shows the table of prevalence of the SAF based on the Desikan-Killiany [22], the Destrieux [23] and the HCP Multimodal [6] surface atlases. Clearly, the SAF shows coherent patterns in structural connectivity with high termination prevalence in the paracentral lobular, mid cingulate cortex as well as in the orbital- and polar frontal cortex.Discussion and Conclusion
In this work, we investigated the cortical connections of a recently proposed new fiber bundle, the superoanterior fasciculus. The SAF was revealed with the combination of large scale, high quality imaging data and the advanced dMRI models, capable of disentangling multiple fiber populations in a single voxel. The current nomenclature classifies the SAF as part of the large dorsal system of horizontal fibers connecting frontal and parietal cortices as a branch of the mesial longitudinal system (MesLS) [24]. While the SAF has not been reproduced neither with dissection nor with imaging studies so far, present investigation proposes a novel connection in the frontal lobe. The short-term or U-fiber connections have been described before [25] and long-term connections are well-known from primate [26] and human [27] studies, the frontal lobe remains a challenging region to study due to extensive geometrical distortions caused by the air-tissue interface of the sinuses.Acknowledgements
No acknowledgement found.References
[1] S. David et al., “The Superoanterior Fasciculus (SAF): A Novel White Matter Pathway in the Human Brain?,” Front. Neuroanat., vol. 13, no. March, pp. 1–18, Mar. 2019.
[2] S. Sarubbo et al., “The course and the anatomo-functional relationships of the optic radiation: a combined study with ‘post mortem’ dissections and ‘ in vivo ’ direct electrical mapping,” J. Anat., vol. 226, no. 1, pp. 47–59, Jan. 2015.
[3] H. Axer et al., “Microstructural analysis of human white matter architecture using polarized light imaging: views from neuroanatomy,” Front. Neuroinform., vol. 5, no. November, pp. 1–12, 2011.
[4] S. M. Smith et al., “Correspondence of the brain’s functional architecture during activation and rest,” Proc. Natl. Acad. Sci. U. S. A., vol. 106, no. 31, pp. 13040–13045, Aug. 2009.[5] L. H. Scholtens, M. A. de Reus, S. C. de Lange, R. Schmidt, and M. P. van den Heuvel, “An MRI Von Economo – Koskinas atlas,” Neuroimage, vol. 170, pp. 249–256, Apr. 2018.[6] M. F. Glasser et al., “A multi-modal parcellation of human cerebral cortex,” Nature, vol. 536, no. 7615, pp. 171–178, 2016.
[7] M. Catani and D. H. Ffytche, “The rises and falls of disconnection syndromes,” Brain, vol. 128, no. 10. Oxford University Press, pp. 2224–2239, 2005.
[8] M. Thiebaut de Schotten et al., “From Phineas Gage and Monsieur Leborgne to H.M.: Revisiting Disconnection Syndromes,” Cereb. Cortex, vol. 25, no. 12, pp. 4812–4827, Dec. 2015.
[9] P. N. Alves et al., “An improved neuroanatomical model of the default-mode network reconciles previous neuroimaging and neuropathological findings,” Commun. Biol. 2019 21, vol. 2, no. 1, pp. 1–14, 2019.
[10] F. Corrivetti et al., “Dissociating motor–speech from lexico-semantic systems in the left frontal lobe: insight from a series of 17 awake intraoperative mappings in glioma patients,” Brain Struct. Funct., vol. 224, no. 3, pp. 1151–1165, Apr. 2019.
[11] V. Pacella et al., “Anosognosia for hemiplegia as a tripartite disconnection syndrome,” Elife, vol. 8, Aug. 2019.[12] M. F. Glasser et al., “The minimal preprocessing pipelines for the Human Connectome Project,” Neuroimage, vol. 80, pp. 105–124, Oct. 2013.
[13] D. C. Van Essen, S. M. Smith, D. M. Barch, T. E. J. Behrens, E. Yacoub, and K. Ugurbil, “The WU-Minn Human Connectome Project: An overview,” Neuroimage, vol. 80, pp. 62–79, 2013.
[14] F. Guo, A. Leemans, M. A. Viergever, F. Dell’Acqua, and A. De Luca, “Generalized Richardson-Lucy (GRL) for analyzing multi-shell diffusion MRI data,” Oct. 2019.
[15] S. N. Sotiropoulos et al., “Advances in diffusion MRI acquisition and processing in the Human Connectome Project,” Neuroimage, vol. 80, pp. 125–143, 2013.
[16] R. Bammer et al., “Analysis and generalized correction of the effect of spatial gradient field distortions in diffusion-weighted imaging,” Magn. Reson. Med., vol. 50, no. 3, pp. 560–569, Sep. 2003.
[17] H. Y. Mesri, S. David, M. A. Viergever, and A. Leemans, “The adverse effect of gradient nonlinearities on diffusion MRI: From voxels to group studies,” Neuroimage, p. 116127, 2019.
[18] A. Leemans et al., “ExploreDTI: a graphical toolbox for processing, analyzing, and visualizing diffusion MR data,” Proc. Int. Soc. Magn. Reson. Med., vol. 17, no. 2, p. 3537, 2009.
[19] C. Lebel, L. Walker, A. Leemans, L. Phillips, and C. Beaulieu, “Microstructural maturation of the human brain from childhood to adulthood,” Neuroimage, vol. 40, no. 3, pp. 1044–1055, Apr. 2008.
[20] B. Fischl, “FreeSurfer,” NeuroImage, vol. 62, no. 2. Academic Press, pp. 774–781, 15-Aug-2012.
[21] C. Gaser and R. Dahnke, “CAT-a computational anatomy toolbox for the analysis of structural MRI data,” Hbm, vol. 2016, no. 7, pp. 336–48, 2016.
[22] R. S. Desikan et al., “An automated labeling system for subdividing the human cerebral cortex on MRI scans into gyral based regions of interest,” Neuroimage, vol. 31, no. 3, pp. 968–980, Jul. 2006.
[23] C. Destrieux, B. Fischl, A. Dale, and E. Halgren, “Automatic parcellation of human cortical gyri and sulci using standard anatomical nomenclature,” Neuroimage, vol. 53, no. 1, pp. 1–15, Oct. 2010.
[24] E. Mandonnet, S. Sarubbo, and L. Petit, “The Nomenclature of Human White Matter Association Pathways: Proposal for a Systematic Taxonomic Anatomical Classification,” Front. Neuroanat., vol. 12, no. November, p. 94, Nov. 2018.
[25] M. Catani et al., “Short frontal lobe connections of the human brain,” Cortex, vol. 48, no. 2, pp. 273–291, 2012.
[26] J. D. Schmahmann and D. N. Pandya, Fiber Pathways of the Brain. 2009.
[27] I. N. C. Lawes et al., “Atlas-based segmentation of white matter tracts of the human brain using diffusion tensor tractography and comparison with classical dissection,” Neuroimage, 2008.
Figures