4463
Diffusion MRI with tensor-valued diffusion encoding as a marker of axonal content within malformations of cortical development1Clinical Sciences Lund, Medical Radiation Physics, Lund University, Lund, Sweden, 2Clinical Sciences Lund, Neurology, Lund University, Lund, Sweden, 3Clinical Sciences Lund, Diagnostic Radiology, Lund University, Lund, Sweden, 4Brigham and Women's Hospital, Harvard Medical School, Boston, MA, United States, 5Clinical Sciences Lund, AKVH-Neurology Helsingborg, Lund University, Lund, Sweden, 6Radiology, Sahlgrenska university hospital, Gothenburg, Sweden
Synopsis
MRI is central to presurgical workup for malformations of cortical development (MCD) but findings are ambiguous on morphological imaging. For example, assessments on cortical thickness may disagree with histology. We investigated whether this gap may be bridged by diffusion MRI (dMRI) with the novel ‘tensor-valued diffusion encoding’ technique. Results from thirteen patients showed WM-like content with high microscopic anisotropy within lesions that were uniform and GM-like in T1- and T2-weighted images and on conventional dMRI. As a marker of axonal content less confounded by myelination and orientation dispersion, tensor-valued diffusion encoding may improve MCD characterization and evaluation of cortical thickness.
Introduction
Malformations of cortical development (MCD) are disorders of neuronal migration, organization and proliferation and are an important cause of drug-resistant epilepsy.1 Morphological MRI plays a central role in surgical treatment workup2 but its interpretation can be ambiguous. For example, ‘cortical thickening’ is a commonly reported characteristic of focal cortical dysplasia (FCD) on T1-weighted images even though it is not described in histopathological studies.3 While T1- and T2-weighted image intensities depend on myelination, gliosis and ectopic neurons within subcortical WM,3,4 the sensitivity of diffusion MRI (dMRI) to the anisotropic diffusion within axons5 could potentially bridge this gap. dMRI has previously been challenging within incoherent structures such as MCD where microscopic anisotropy is confounded by orientation dispersion,6,7 but the novel ‘tensor-valued diffusion encoding’ technique overcomes this limitation.8,9 Here, we used tensor-valued diffusion encoding in four types of MCD to demonstrate both GM-like and WM-like content within lesions that were otherwise similar in both morphological MRI images and on conventional dMRI.Methods
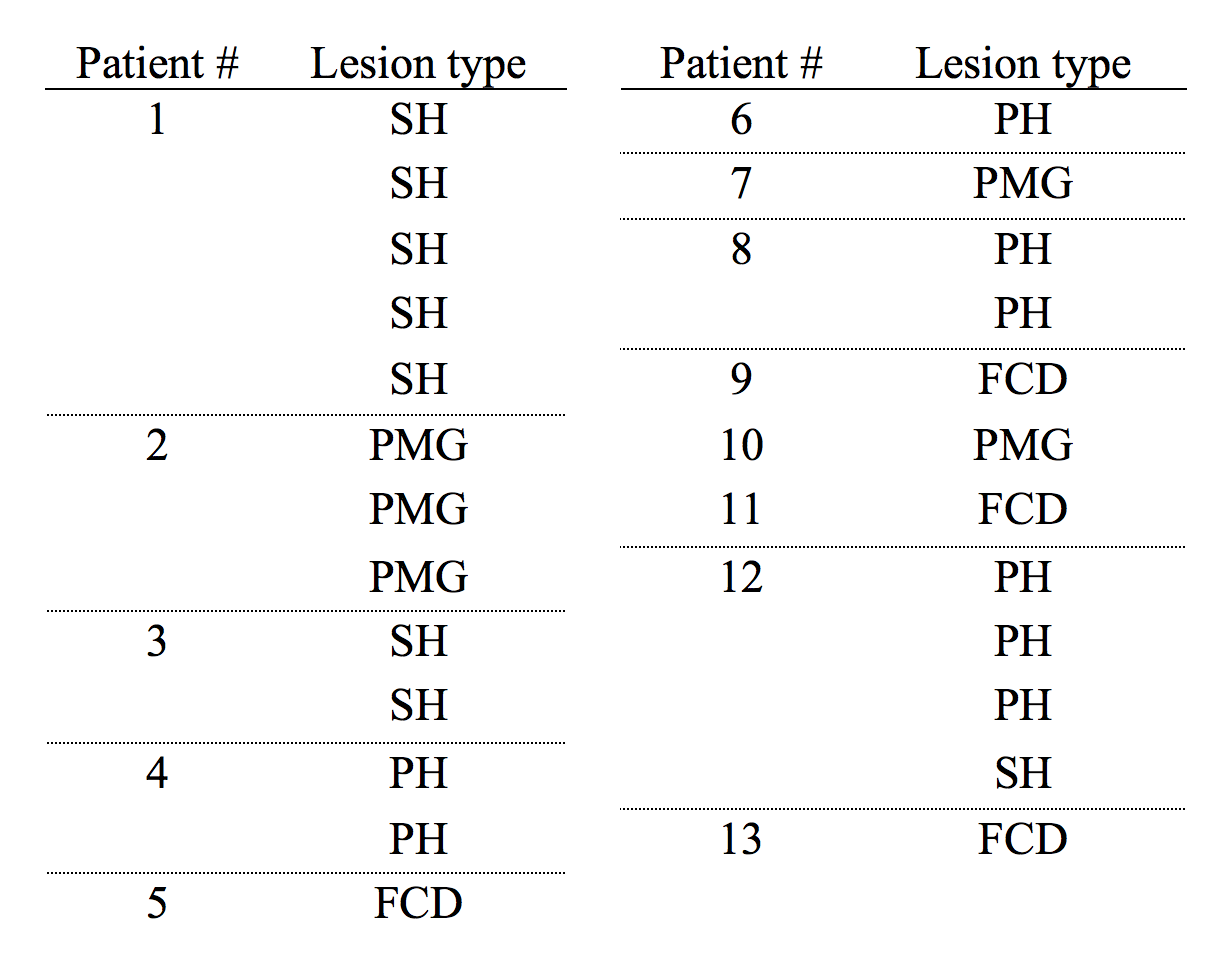
Thirteen patients with MCD (age 32 ± 13 y, 8 females) were scanned on an Achieva 7T system (Philips, Best, The Netherlands). Tensor-valued diffusion encoding was performed with a prototype diffusion-weighted spin-echo sequence10 using TR/TE = 3500/89 ms/ms, 2×2×4 mm3 resolution, and linear and spherical b-tensors with b = 0,0.1,0.5,1.0,1.5, and 2.0 ms/μm2 distributed over up to 16 directions. T1-weighted images were acquired with a 3D TFE sequence using TR/TE = 8/2.8 ms/ms, flip angle = 7° and 0.6 mm3 resolution. T2-FLAIR images were acquired with a 3D spin-echo sequence using TR/TE = 6000/390 ms/ms, flip angle = 55° and 1.4 mm3 resolution. dMRI data were analyzed with the covariance tensor model9 to estimate both the (conventional) fractional anisotropy (FA) and the microscopic anisotropy (MKA) using the multidimensional dMRI toolbox.11 All data were coregistered to the T1-weighted images using Elastix.12Results
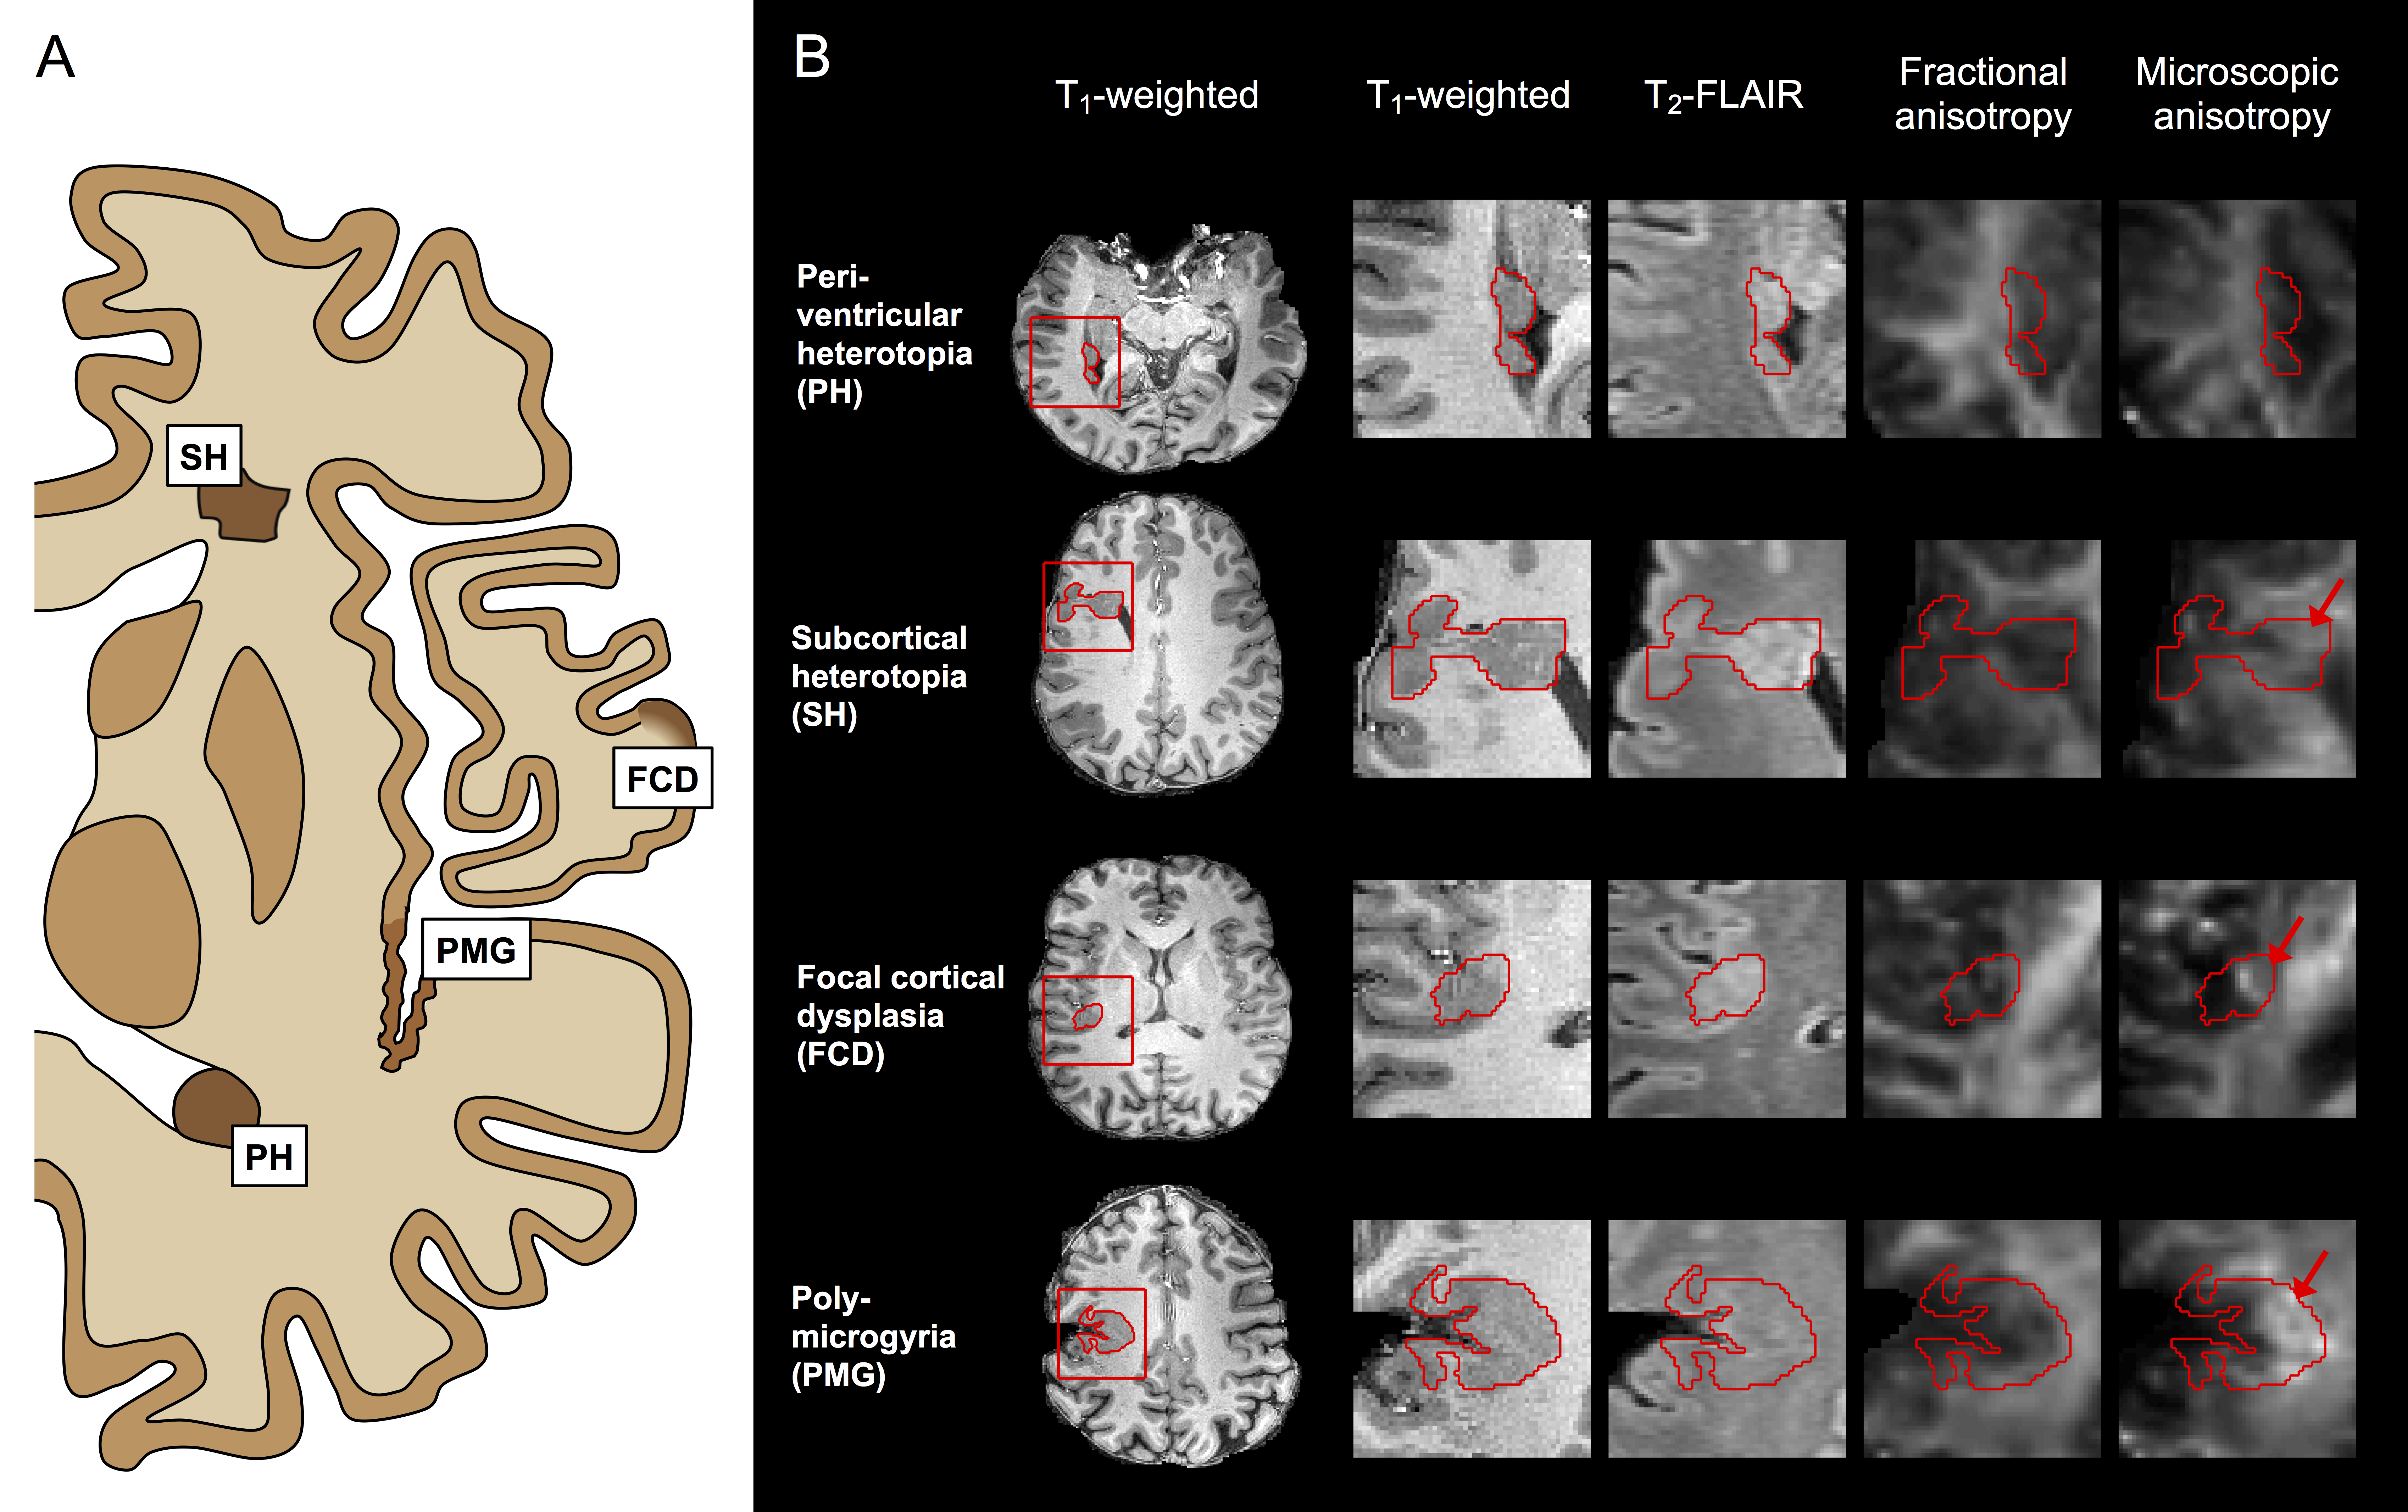
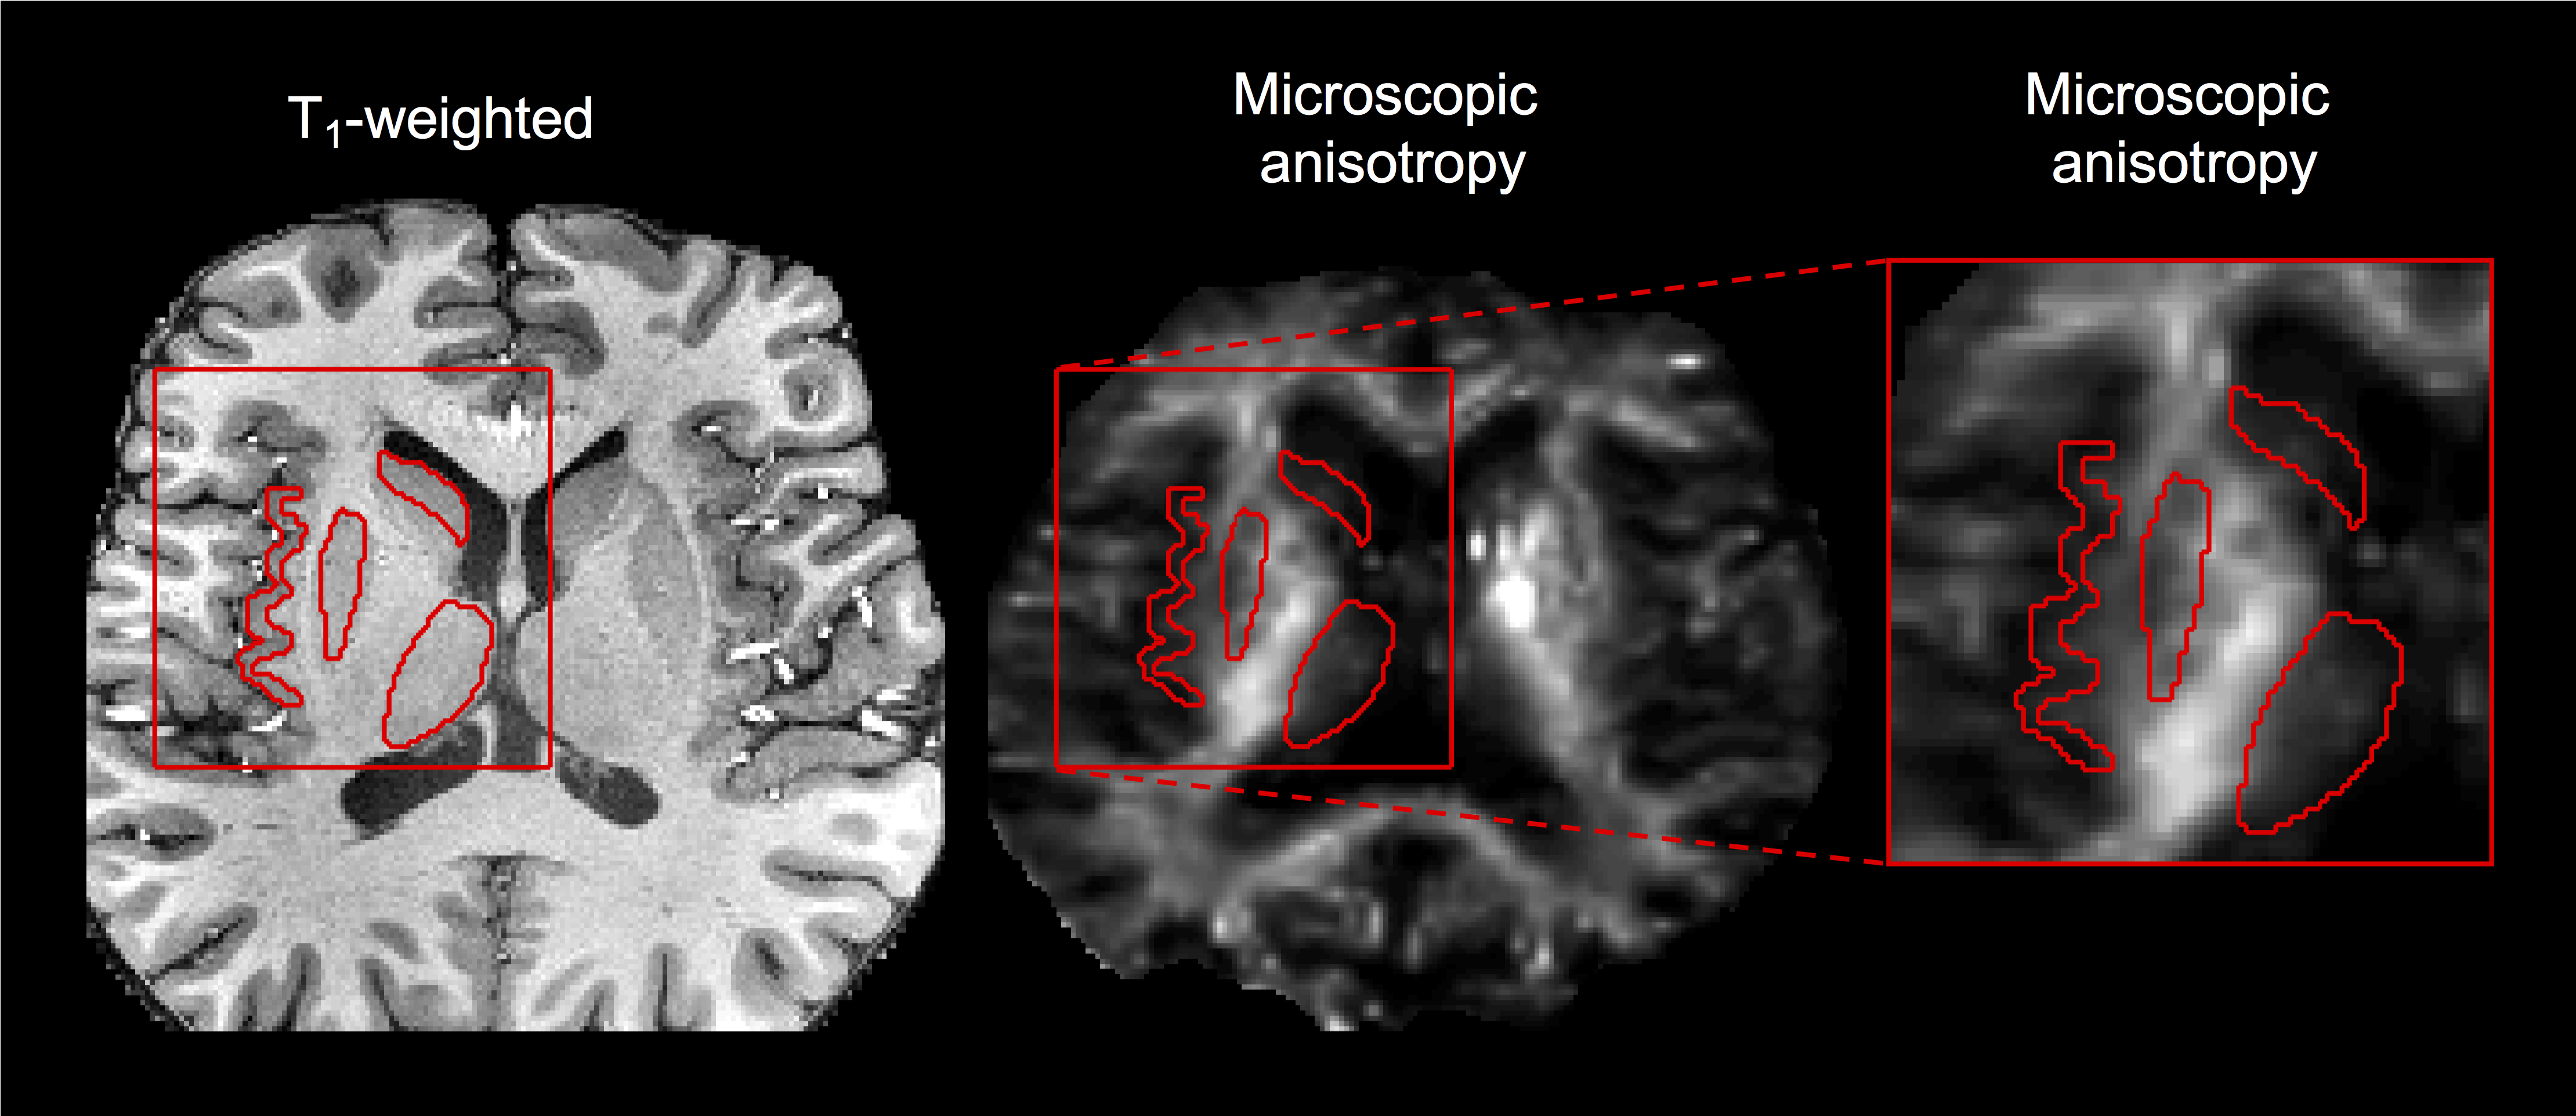
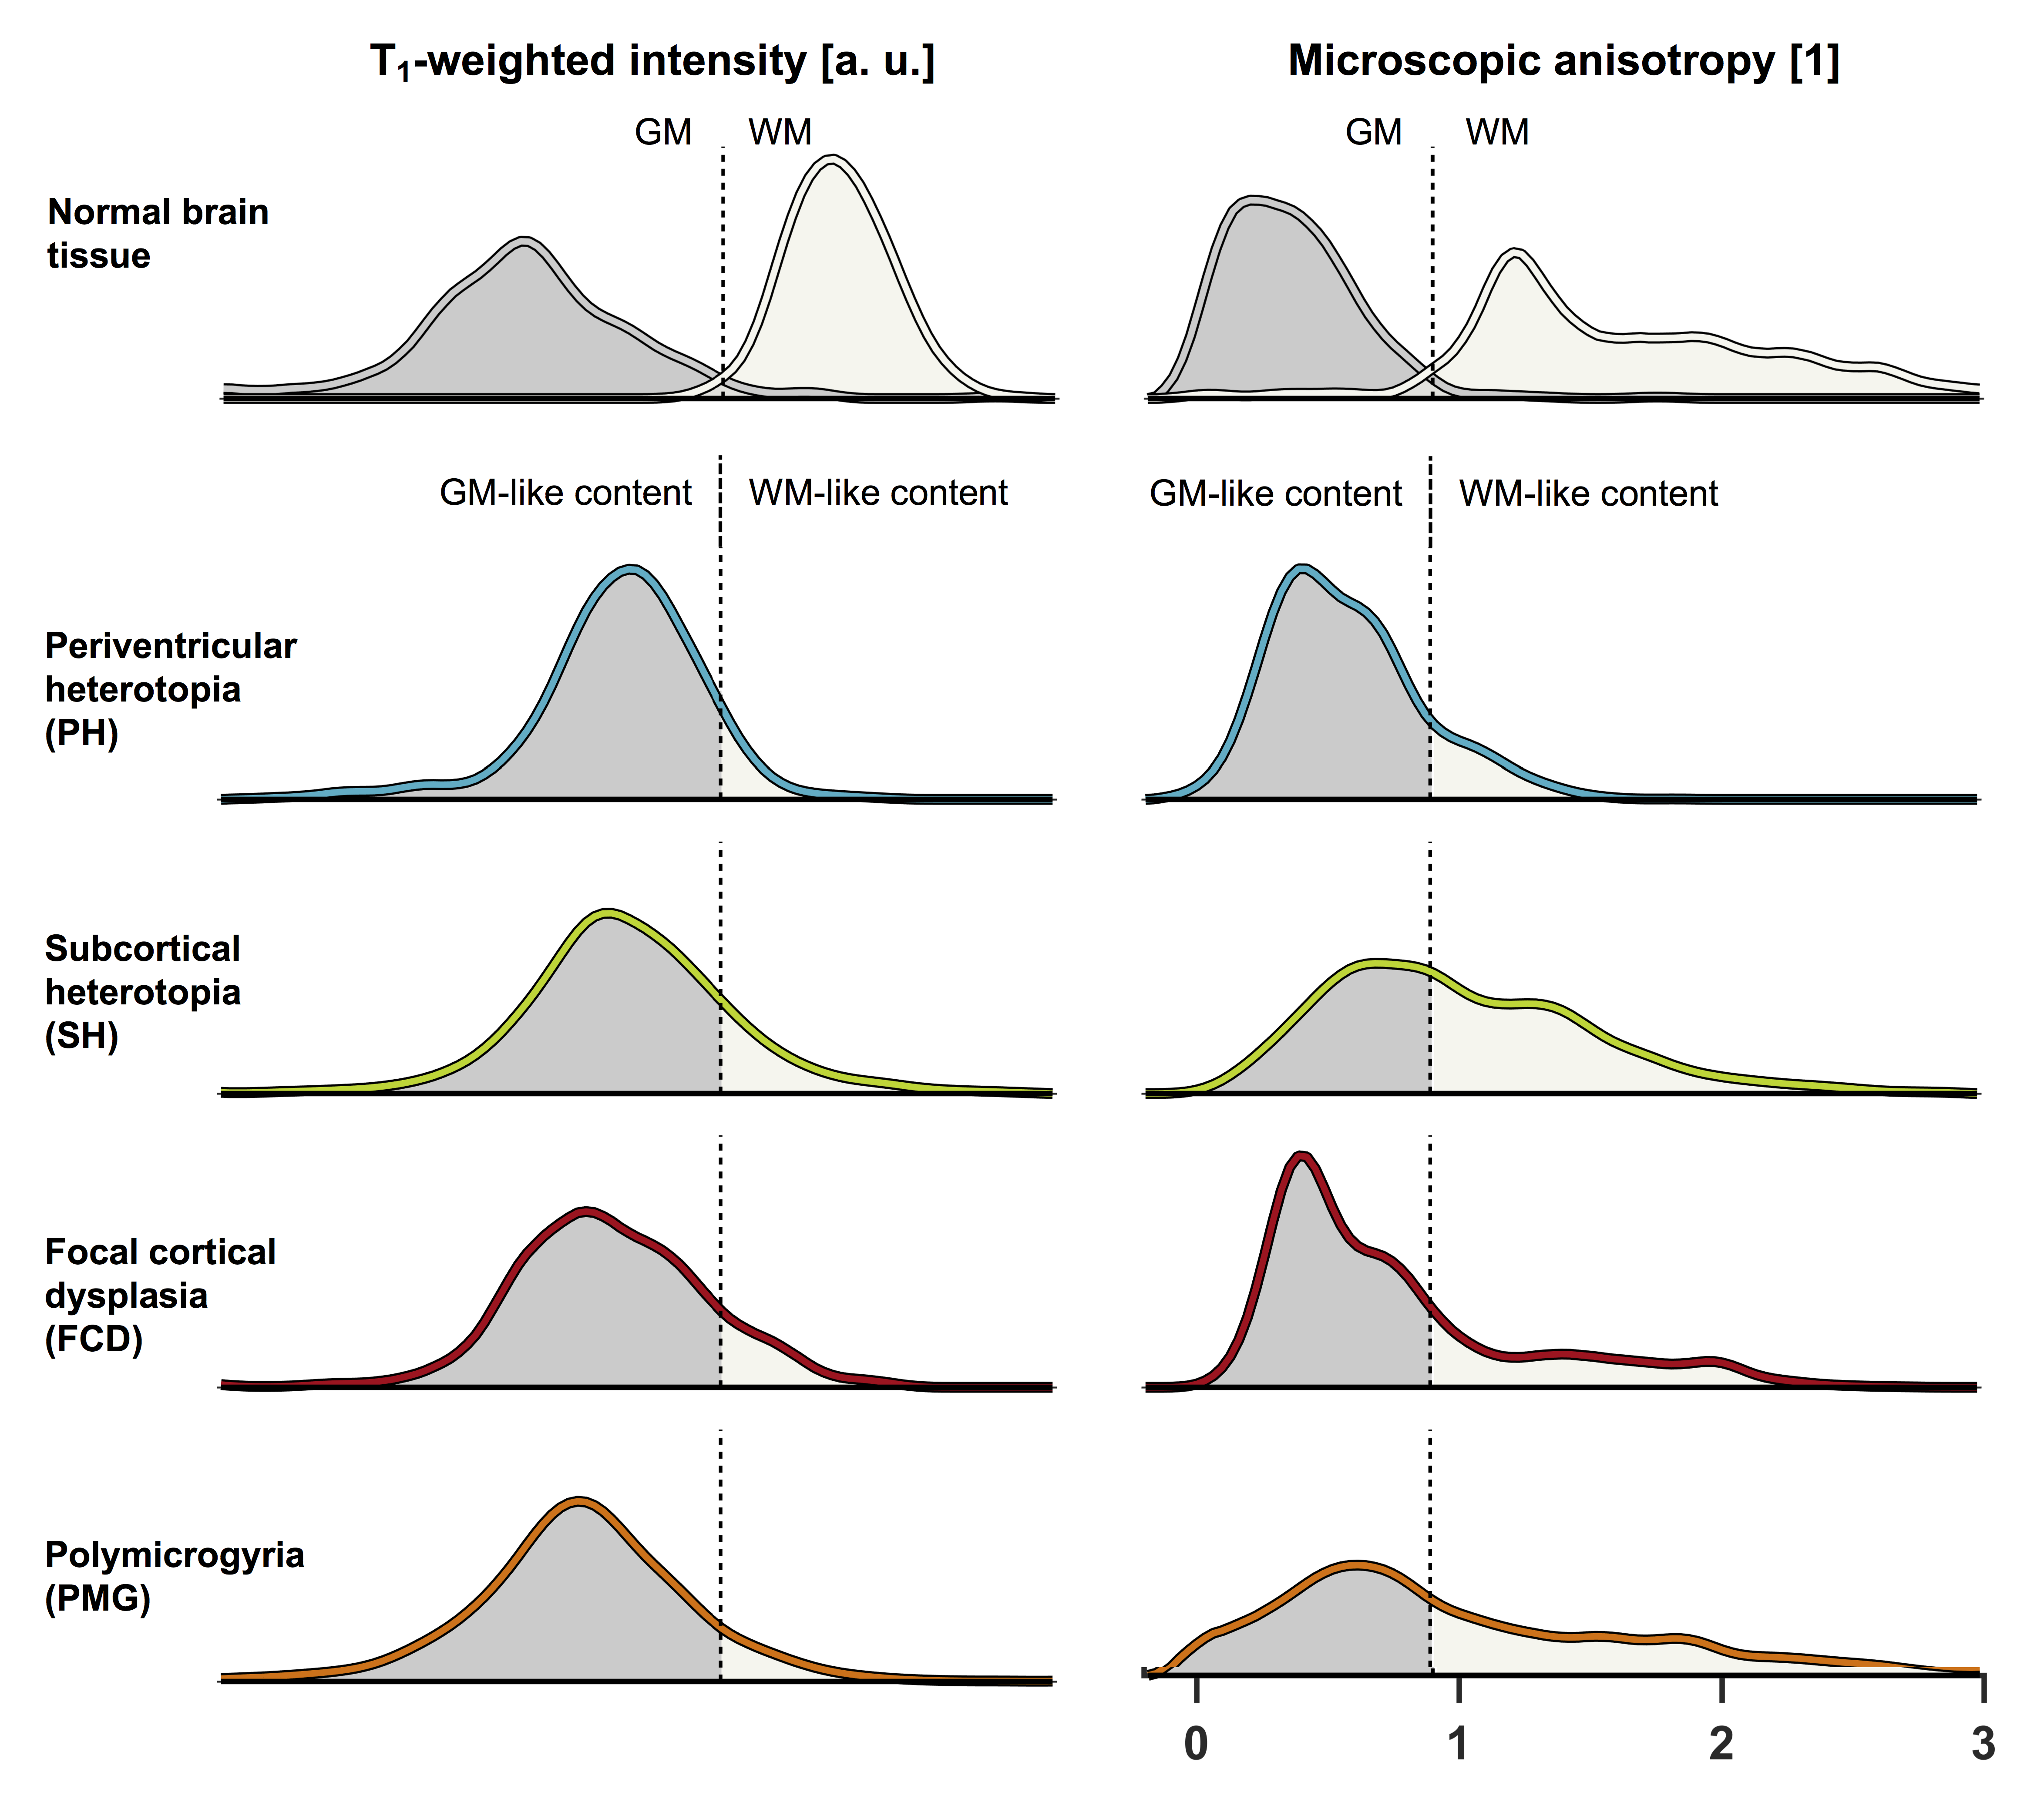
Four types of MCD were identified: periventricular heterotopias (PH), subcortical heterotopias (SH), focal cortical dysplasias (FCD) and polymicrogyrias (PMG). Table 1 shows their distribution among the patients and Fig. 1A shows an overview of typical lesion manifestation per type. On the conventional MRI contrasts of T1-weighted, T2-FLAIR and FA, the lesions were uniform and visually similar to normal GM (Fig. 1B). On the contrary, the MKA maps revealed heterogeneity both between and within lesions. The MKA was low and similar to that of GM in PH and in most ‘intra-cortical’ parts of MCD. Conversely, in the WM-embedded SH, in areas with WM-GM blurring in FCD and in regions with apparently increased cortical thickness in PMG, the MKA was high and similar that of WM (Figs. 1B and 2). Figure 3 shows histograms further emphasizing that all lesions were GM-like on T1-weighted imaging whereas the MKA revealed both GM- and WM-like content in all lesion types except PH.Discussion
Tensor-valued diffusion encoding revealed varying levels of microscopic diffusion anisotropy across MCD tissue that was otherwise similar in morphological images and on conventional dMRI. We hypothesize that the finding reflects a varying axonal content that is confounded by myelination and orientation dispersion in conventional contrasts. The passage of axons through WM-embedded SH is consistent with fiber tracking results in band heterotopias13 and ‘cortex’ that appear blurry in FCD or thick in PMG may actually represent subcortical WM with myelin pathology.4,14 This and previous studies indicate that axons rather than dendrites drive microscopic diffusion anisotropy in the brain (Fig. 2)15-17 and, consequently, anisotropy was low within the ‘GM parts’ of MCD, where the axonal content should be similar or lower compared with in normal GM14,18 but high within the ‘WM parts’.Conclusion
Microscopic anisotropy from tensor-valued diffusion encoding may provide a marker of axonal content unconfounded by the level of myelination, which strongly affects morphological T1- and T2-weighted images. As the sequence can be performed in just three minutes19 and is available at common clinical MRI systems10, the technique may allow clinically feasible characterization of MCD and adjacent WM useful in presurgical workup, as well as an improved evaluation of cortical thickness in general. Future studies will investigate whether the sensitivity to axonal content can be used to identify ‘MRI-invisible’ lesions.Acknowledgements
We thank Philips for providing access to the pulse programming environment. The study was supported by grants from the Swedish Research Council (2016-03443).References
1. Barkovich A, Kuzniecky R, Jackson G, et al. A developmental and genetic classification for malformations of cortical development. Neurology 2005;65:1873-1887.
2. Duncan J, Winston G, Koepp M, et al. Brain imaging in the assessment for epilepsy surgery. Lancet Neurol. 2016;15(4):420-433.
3. Colombo N, Salamon N, Raybaud C, et al. Imaging of malformations of cortical development. Epileptic Discord 2009;11(3):194-205.
4. Takanashi J and Barkovich A. The changing MR imaging appearance of polymicrogyria: a consequence of myelination. AM J Neuroradiol. 2003;24:788-793.
5. Beaulieu C. The basis of anisotropic water diffusion in the nervous system–a technical review. NMR Biomed. 2002;15:435-455.
6. Oouchi H, Yamada K, Sakai K, et al. Diffusion anisotropy measurement of brain white matter is affected by voxel size: underestimation occurs in areas with crossing fibers. AM J Neuroradiol. 2007;28:1102-1106.
7. Douaud G, Jbabdi S, Behrens T, et al. DTI measures in crossing-fibre areas: increased diffusion anisotropy reveals early white matter alteration in MCI and mild Alzheimer's disease. Neuroimage 2011;55:880-890.
8. Lasič S, Szczepankiewicz F, Eriksson S, et al. Microanisotropy imaging: quantification of microscopic diffusion anisotropy and orientational order parameter by diffusion MRI with magic-angle spinning of the q-vector. Frontiers in Physics 2014;2:11.
9. Westin C-F, Knutsson H, Pasternak O, et al. Q-space trajectory imaging for multidimensional diffusion MRI of the human brain. Neuroimage 2016;135:345-362
10. Szczepankiewicz F, Sjölund J, Ståhlberg F, et al. Tensor-valued diffusion encoding for diffusional variance decomposition (DIVIDE): Technical feasibility in clinical MRI systems. PLoS One 2019;14:e0214238
11. Nilsson M, Szczepankiewicz F, Ahlgren A, et al. An open-source framework for analysis of multidimensional diffusion MRI data implemented in MATLAB. In Proceedings of the 26th Annual Meeting of ISMRM, Paris, France. 2018. p. 5355.
12. Klein S, Staring M, Murphy K, et al. Elastix: a toolbox for intensity-based medical image registration. IEEE Transactions on Medical Imaging 2010;29:196-205.
13. Eriksson S, Symms M, Rugg-Gunn F, et al. Exploring white matter tracts in band heterotopia using diffusion tractography. Ann Neurol. 2002;52:327-334.
14. Alonso-Nanclares L, Garbelli R, Sola R, et al. Microanatomy of the dysplastic neocortex from epileptic patients. Brain 2004;128:158-173.
15. Jespersen S, Bjarkam C, Nyengaard J, et al. Neurite density from magnetic resonance diffusion measurements at ultrahigh field: comparison with light microscopy and electron microscopy. Neuroimage 2010;49:205-216.
16. Novikov D, Veraart J, Jelescu I, et al. Rotationally-invariant mapping of scalar and orientational metrics of neuronal microstructure with diffusion MRI. Neuroimage 2018;174:518-538.
17. Lampinen B, Szczepankiewicz F, Novén M, et al. Searching for the neurite density with diffusion MRI: Challenges for biophysical modeling. Hum. Brain Mapp. 2019;40:2529-2545.
18. Hannan A, Servotte S, Katsnelson A, et al. Characterization of nodular neuronal heterotopia in children. Brain 1999;122:219-238.
19. Nilsson M, Szczepankiewicz F, Brabec J, et al. Tensor-valued diffusion MRI in under 3 minutes: An initial survey of microscopic anisotropy and tissue heterogeneity in intracranial tumors. arXiv 2019:1902.09986.
Figures