4462
Precision and goodness of fit of diffusion-based microstructure models in brain tumours: an integrated information theory approach
Umberto Villani1,2, Erica Silvestri1,2, Marco Castellaro1,2, Simona Schiavi3, Mariagiulia Anglani4, Silvia Facchini1,5, Elena Monai1,5, Domenico Davella1,5, Alessandro Della Puppa6, Diego Cecchin7, Maurizio Corbetta1,5,8, and Alessandra Bertoldo1,2
1Padova Neuroscience Center, University of Padova, Padova, Italy, 2Department of Information Engineering, University of Padova, Padova, Italy, 3Department of Computer Science, University of Verona, Verona, Italy, 4Neuroradiology Unit, University of Padova, Padova, Italy, 5Department of Neuroscience, University of Padova, Padova, Italy, 6Departments of Neurosurgery, Neuroscience, Psychology, Pharmacology, and Child Health, University of Firenze, Firenze, Italy, 7Department of Medicine, Unit of Nuclear Medicine, University of Padova, Padova, Italy, 8Departments of Neurology, Radiology, Neuroscience, Washington University School of Medicine, St.Louis, MO, United States
1Padova Neuroscience Center, University of Padova, Padova, Italy, 2Department of Information Engineering, University of Padova, Padova, Italy, 3Department of Computer Science, University of Verona, Verona, Italy, 4Neuroradiology Unit, University of Padova, Padova, Italy, 5Department of Neuroscience, University of Padova, Padova, Italy, 6Departments of Neurosurgery, Neuroscience, Psychology, Pharmacology, and Child Health, University of Firenze, Firenze, Italy, 7Department of Medicine, Unit of Nuclear Medicine, University of Padova, Padova, Italy, 8Departments of Neurology, Radiology, Neuroscience, Washington University School of Medicine, St.Louis, MO, United States
Synopsis
Diffusion-based microstructure modeling techniques potentially provide significant biomarkers to characterize the tumoral architecture in the human brain. While clinical studies focus on the application of these technique, not enough care is being devoted to understand whether the employed models provide precise and reliable parameter estimates when fitted on the cancerous tissues. The present works tackles these issues on a cohorts of 11 patients diagnosed with different types of brain tumours by quantifying the variance of parameter estimates and the goodness-of-fit in an integrated view borrowing concepts from information theory.
Introduction
Advanced diffusion techniques falling under the broad label of ‘microstructure MRI’1 generally employ multi-compartment models with tensors of different shapes, as to deconstruct the diffusion signal into multiple diffusive micro-environment that physiologically coexist inside a single voxel. Although we can currently find several studies employing these models to study tumoral microstructure of the brain which feature promising results2–5, current literature does not extensively address whether microstructural models produce reliable and reproducible parameters estimates in the cancerous tissues of the brain. In this context, the present work adopts an analytical framework employing notions from information theory to characterize the stability of diffusion-based microstructural models, focusing its application on the assessment of two well-known diffusion techniques in a cohort of patients suffering from a range of brain tumours.Methods
The Neurite Orientation Dispersion and Density Imaging6 (NODDI) and the Spherical Mean Technique7 (SMT) models were chosen for this work because of their similarity in diffusion protocol requirement, and the complementarity of information their parameters provide. The utilized dataset comprised 11 patients, scanned with a Siemens Biograph mmR MR/PET scanner at 3T. Diffusion images were acquired with the optimized NODDI protocol6 (TR/TE 5355ms/104ms; 2x2x2mm) with Anterior-Posterior and Posterior-Anterior phase encoding directions for preprocessing needs8. Tumour masks were manually drawn by an expert neurologist on a reference T1w image (TR/TE 2400/3.24ms; TI 1000ms; 1x1x1mm). The residual sum of squares (RSS) statistics was computed to assess the fitting prowess of the models, along with its expectation given the noise model assumed by the employed parameter estimators. The Cramer-Rao Lower Bound (CRLB) approximation of parameter variances9 was computed voxel-wise for each subject for inter-tissue analysis of estimation accuracy.Results&Discussion
As a general overview of the computed metrics, Figure 1 shows, for a slice of a representative subject, the parameter estimates for the NODDI model and the SMT model, along with their precision approximated with the CRLB. A first glance to the various standard deviation images reveals how the general trend of estimation precision differs for the tumoral region (highlighted in red) with respect to the normal appearing brain tissues. Although the modeling choices for the various compartments may be physiologically questionable in tumours, the employed parameter estimators are able to react to the different features of the diffusion signal and output spatially coherent metrics, both in terms of their value and uncertainty. Shifting the focus on the precision of NODDI parameter estimates, Figure 2 shows the boxplots of such quantities across all subjects. Interestingly, the intracellular volume fraction (icvf) and the isotropic volume fraction (isovf) parameters show better precision in the tumoral region than in normal appearing white matter and grey matter. Icvf enhanced accuracy in the tumour comes as unexpected, considering the intracellular compartment is modeled with Watson dispersed sticks to mimic diffusion inside axonal fibers, which are typically absent or extremely reduced in tumours. The Orientation Dispersion Index (ODI) estimation in the cancerous region is found to be more uncertain than normal appearing white matter, but less than normal appearing grey matter. Table 1 shows the tissue-averaged RSS metric for all subjects, with their computed expected value in parenthesis. No clear indication of better or worse fitting performance was found in the dataset at hand, but the good agreement between the RSS and its expected value tissue-wise suggests NODDI presents a healthy fit across the tumour and the rest of the brain. Concerning the SMT, Figure 4 shows the standard deviations of the parameter estimates for the intrinsic diffusion (d||) and the intracellular volume fraction (vintra). The behaviour for both the parameter estimates is similar, as we find increased estimation precision inside the tumoral region with respect to normal appearing tissues. It is noteworthy how with respect to NODDI, the estimation of the intracellular volume fraction in the SMT case leads to substantially lower standard deviations. This finding does not come unexpected, as the shell averaging procedure which yields the spherical mean signal has the welcome side effect of lowering the noise level. Lastly, Table 2 shows the RSS values, along with their expected values, for the SMT model. As it was in NODDI case, we find no evidence of clear difference in quality of fit between the different tissues, although the RSS expected values are extremely higher with respect to computed values in all cases. This mismatch arguably exposes the severe overfitting the SMT bi-compartment model features in the dataset at hand, both in the healthy and in the tumor regions.Conclusions
The proposed work utilized an integrated information theory approach to quantify estimation precision and fitting goodness of NODDI and the SMT. We were able to show that both models feature comparable estimation precision in the tumour and normal appearing tissues across the dataset at hand, and that the SMT presents general overfitting issues. Whether this is due to the often reported model identification degeneracies10,11, it is still object of ongoing research. We believe in the flexibility of the presented approach, which can be integrated as a byproduct of parameter estimation routines and can easily be extended to different models and pathologies.Acknowledgements
No acknowledgement found.References
- Alexander DC, Dyrby TB, Nilsson M, Zhang H. Imaging brain microstructure with diffusion MRI: Practicality and applications. NMR Biomed. 2017. doi:10.1002/nbm.3841
- Maximov II, Tonoyan AS, Pronin IN. Differentiation of glioma malignancy grade using diffusion MRI. Phys Medica. 2017. doi:10.1016/j.ejmp.2017.07.002
- Li S-H, Zhang J, Su C-L, et al. Application of neurite orientation dispersion and density imaging in assessing glioma grades and cellular proliferation. World Neurosurg. 2019. doi:10.1016/j.wneu.2019.07.121
- Zhao J, Li J bin, Wang J yan, et al. Quantitative analysis of neurite orientation dispersion and density imaging in grading gliomas and detecting IDH-1 gene mutation status. NeuroImage Clin. 2018. doi:10.1016/j.nicl.2018.04.011
- Roberts T, Hyare H, Hipwell B, et al. Quantification of tumour microstructure in low and high-grade brain tumours using VERDICT MRI: an initial feasibility study. Neuro Oncol. 2018. doi:10.1093/neuonc/nox238.072
- Zhang H, Schneider T, Wheeler-Kingshott CA, Alexander DC. NODDI: Practical in vivo neurite orientation dispersion and density imaging of the human brain. Neuroimage. 2012. doi:10.1016/j.neuroimage.2012.03.072
- Kaden E, Kelm ND, Carson RP, Does MD, Alexander DC. Multi-compartment microscopic diffusion imaging. Neuroimage. 2016. doi:10.1016/j.neuroimage.2016.06.002
- Andersson JLR, Skare S, Ashburner J. How to correct susceptibility distortions in spin-echo echo-planar images: Application to diffusion tensor imaging. Neuroimage. 2003. doi:10.1016/S1053-8119(03)00336-7
- Seber GA., Wild CJ. Nonlinear Regression. (Wiley, ed.).; 1989.
- Jelescu IO, Veraart J, Fieremans E, Novikov DS. Degeneracy in model parameter estimation for multi-compartmental diffusion in neuronal tissue. NMR Biomed. 2016. doi:10.1002/nbm.3450
- Novikov DS, Fieremans E, Jespersen SN, Kiselev VG. Quantifying brain microstructure with diffusion MRI: Theory and parameter estimation. NMR Biomed. 2018. doi:10.1002/nbm.3998
Figures
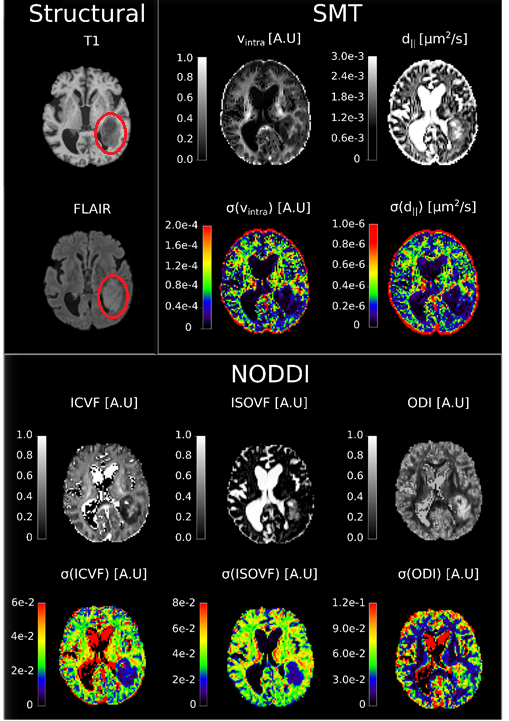
Figure 1: Overview of the parameter maps and their standard deviation
coming from the SMT and NODDI models for a representative subject. The red
circle drawn on the structural maps represents the tumoral area.
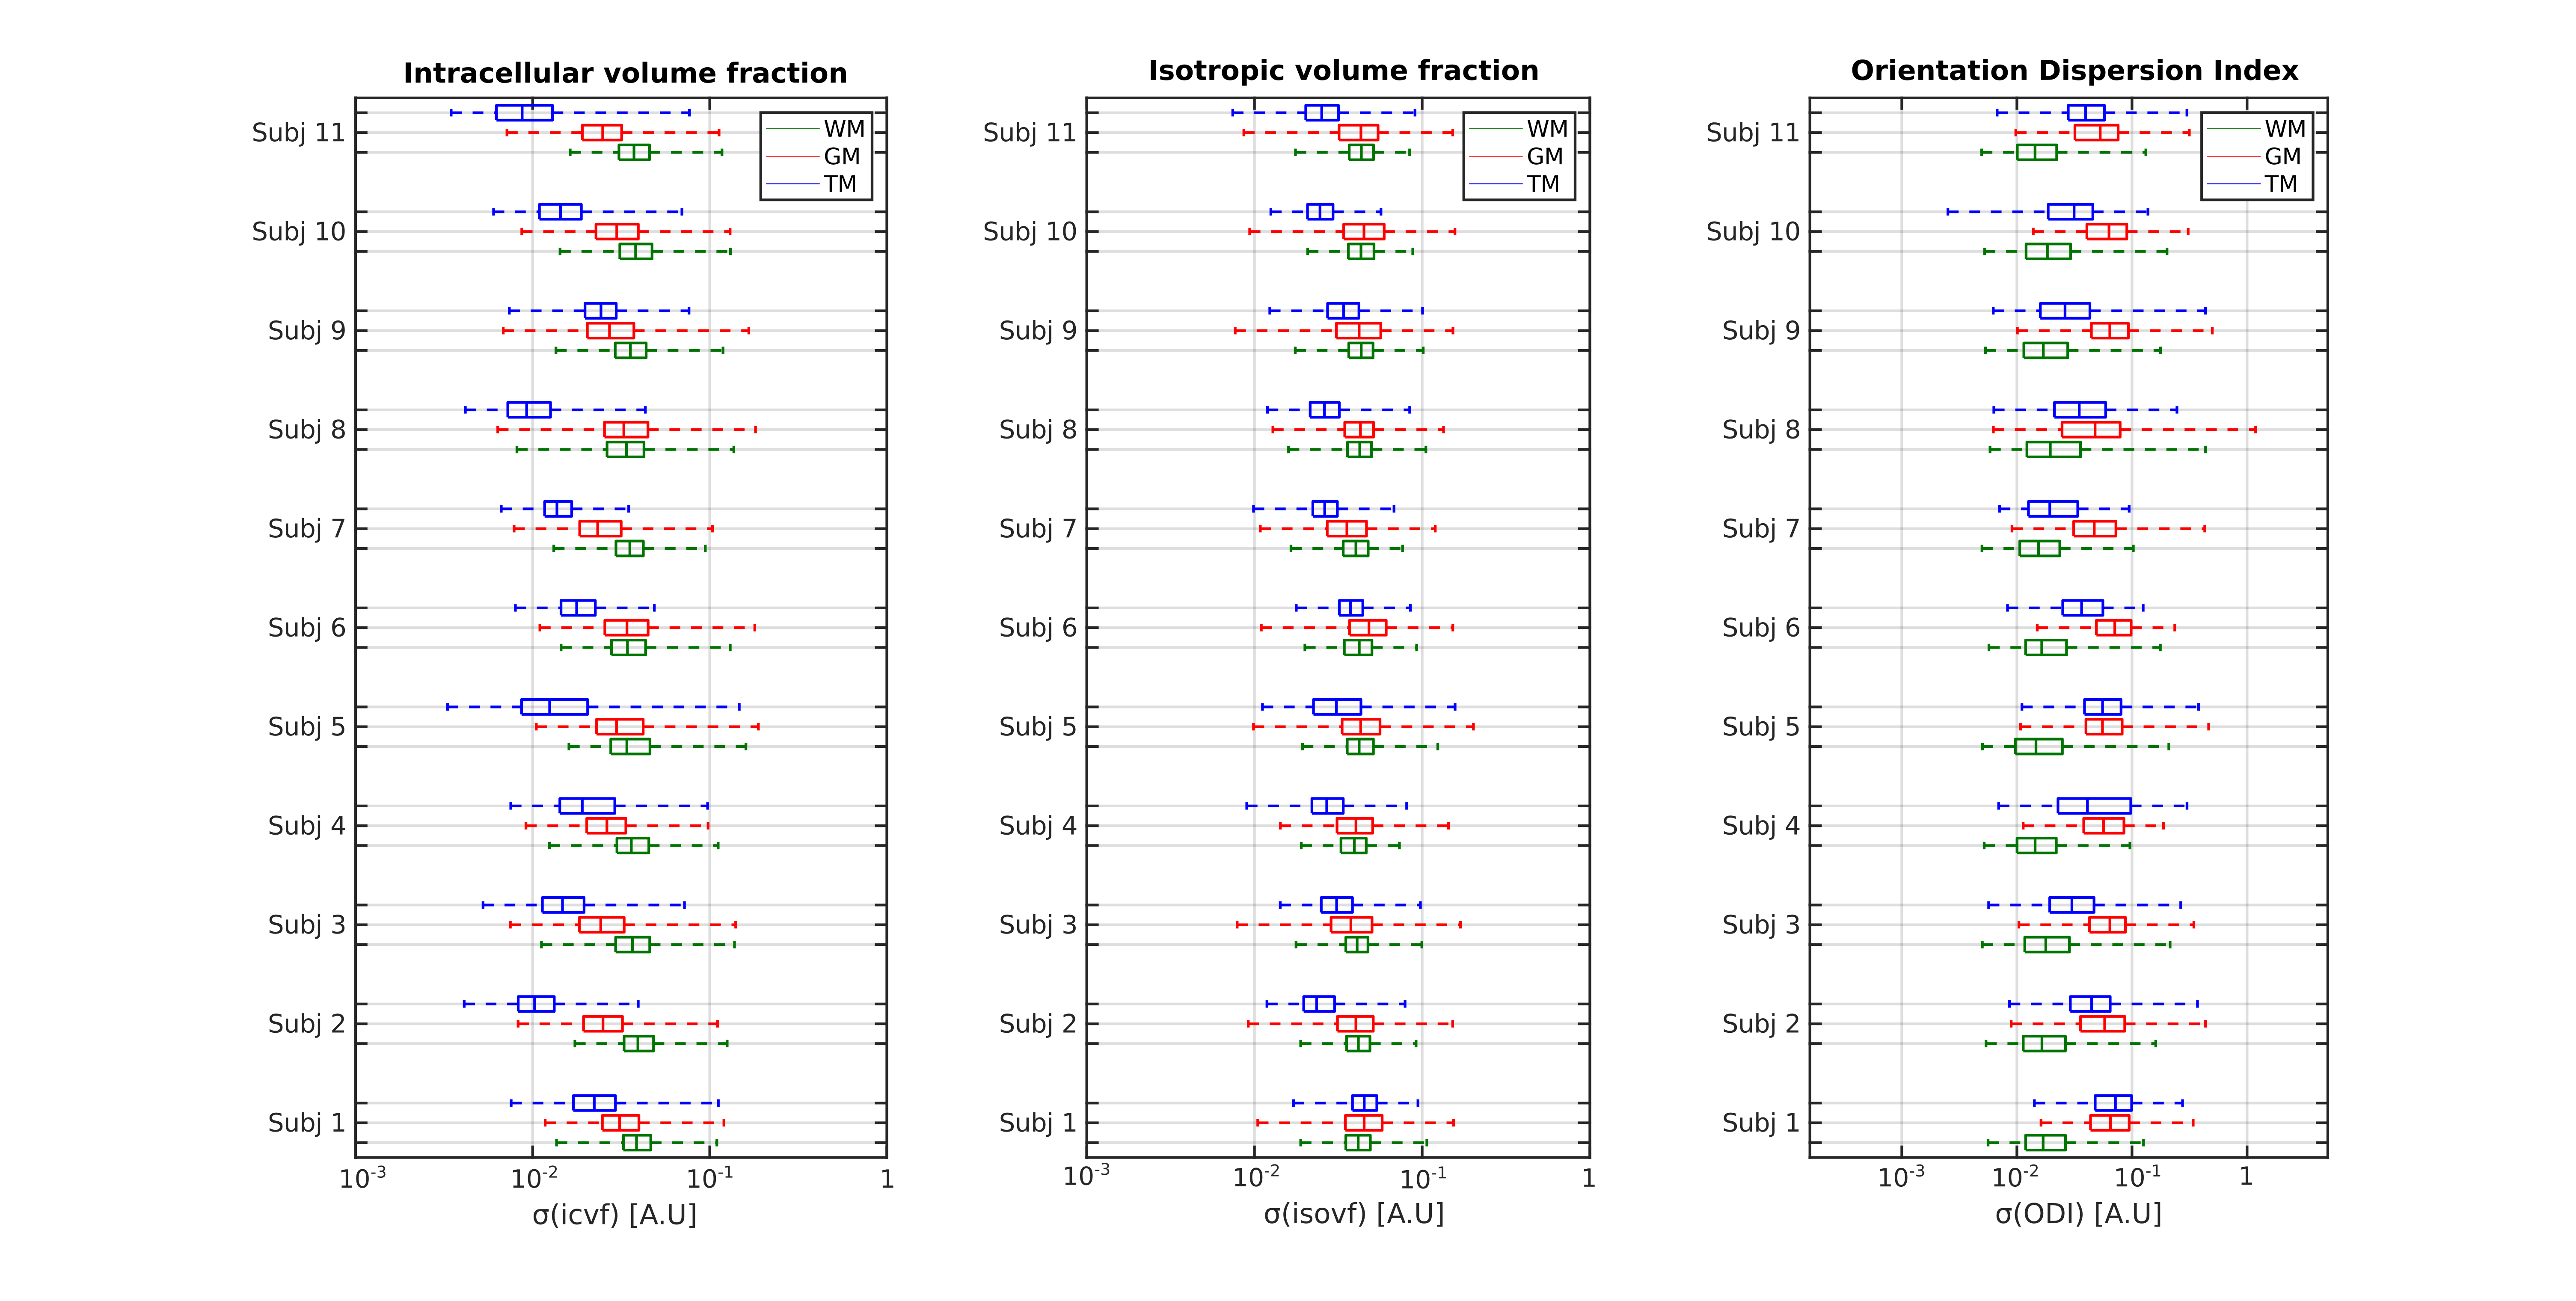
Figure 2: Boxplots showing the tissue-wise distribution of the
parametrical standard deviations of the NODDI model for each subject in the
dataset at hand. Values are shown in the logarithmic scale
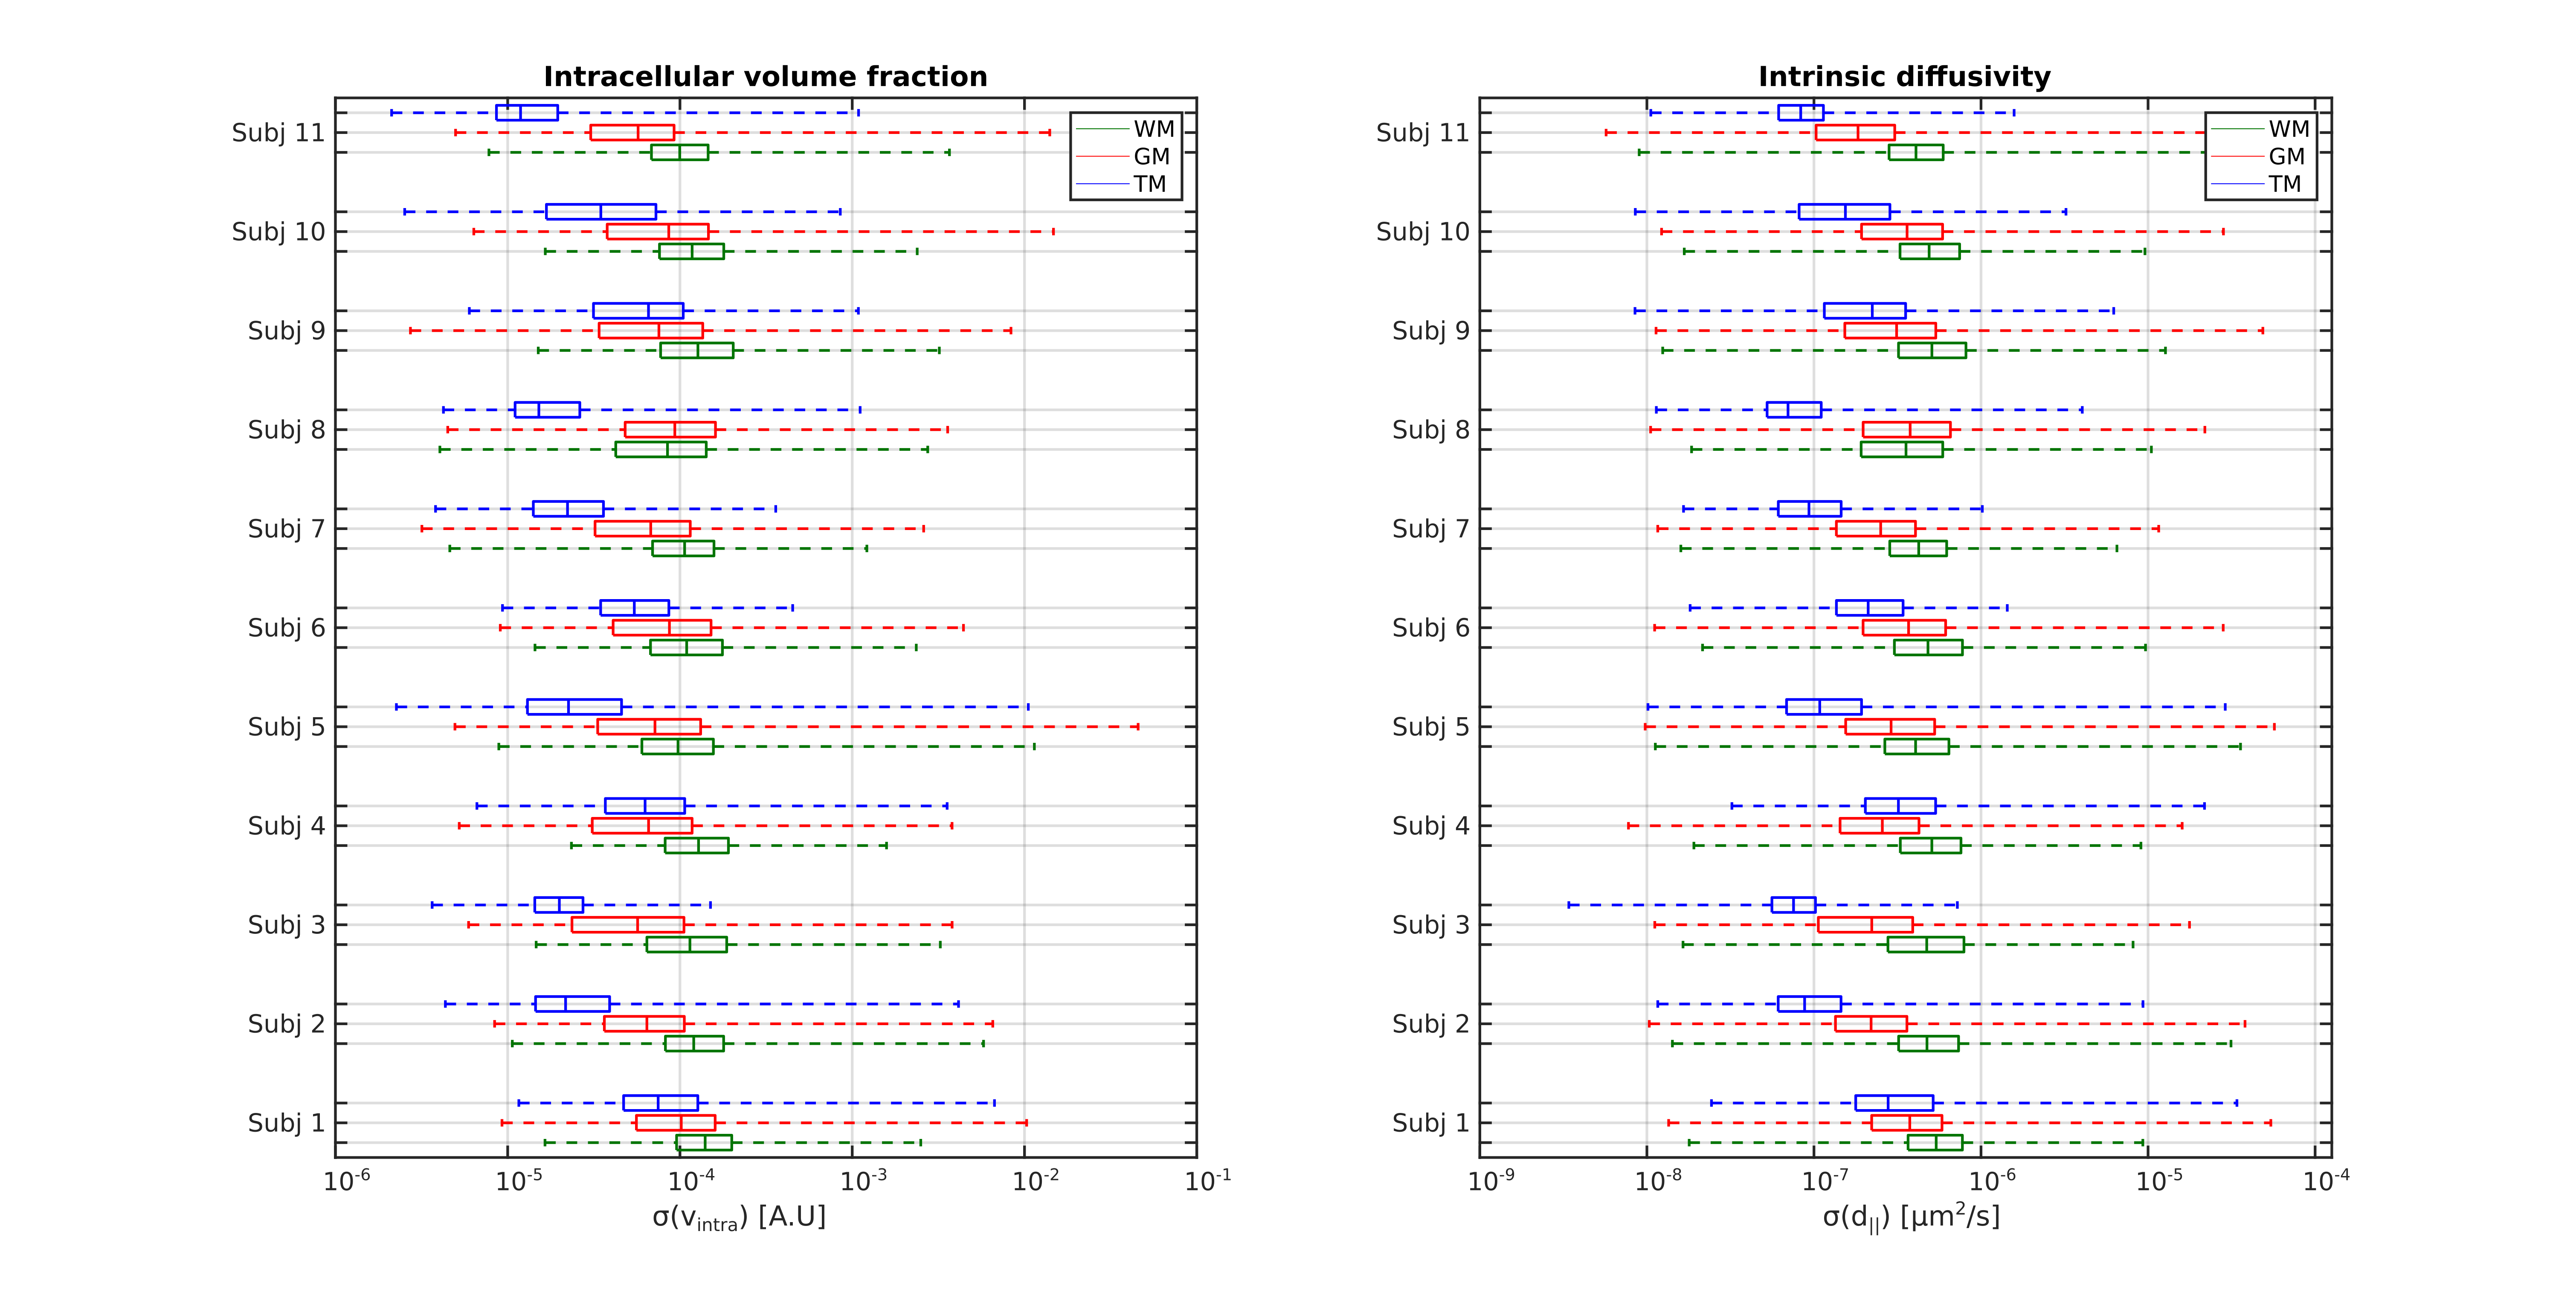
Figure 3: Boxplots showing the tissue-wise distribution of the
parametrical standard deviations of the SMT bi-compartment model for each
subject in the dataset at hand. Values are shown in the logarithmic scale
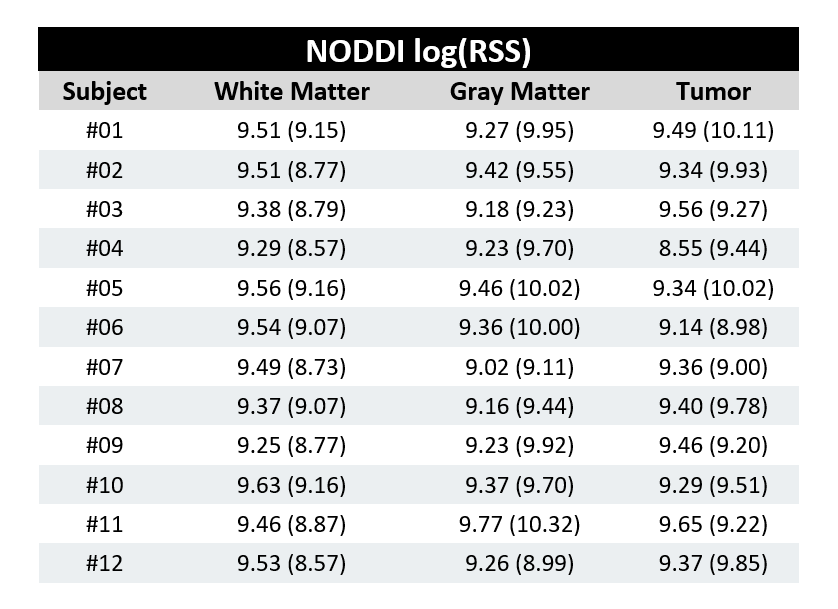
Table 1: Mean RSS values inside the tissues for the NODDI model, along
with their expected values between parenthesis, given the noise model of the
employed estimator. Values are shown in the logarithmic scale.
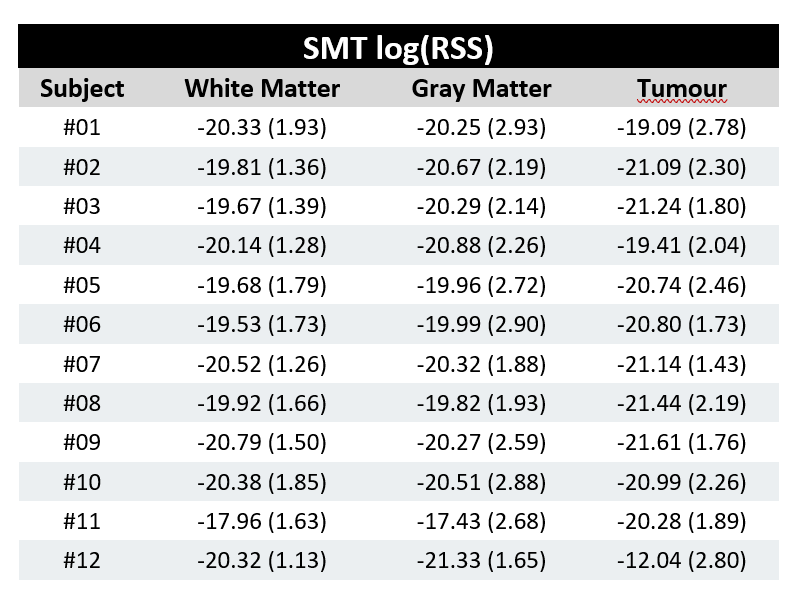
Table 2: Mean RSS values inside the tissues for the SMT bi-compartment
model, along with their expected values between parenthesis given the noise
model of the employed estimator. Values are shown in logarithmic scale.