4461
Preliminary study of diffusion encoding scheme for double diffusion encoding in clinical application on 3T.1Research and Development Center, Canon Medical Systems Corporation, Kanagawa, Japan, 2Advanced MRI development PJ Team, Canon Medical Systems Corporation, Kanagawa, Japan, 3Department of Radiology, Toho University Omori Medical Center, Tokyo, Japan, 4Department of Radiology, Juntendo University School of Medicine, Tokyo, Japan
Synopsis
Double diffusion encoding (DDE) can measure the microscopic anisotropy (μFA), however one of problems for clinical application is that the acquisition time is prolonged due to the many diffusion encoding patterns necessary. Recently, DDE with a reduced number of acquisitions has been proposed as a solution and been validated as a solution at 9.4T. The aim of this study is to validate the proposed solution for clinical application on 3T clinical scanners. Our results show that our proposed solution can obtain more accurate μFA than previous reported solutions on 3T clinical scanners.
Introduction:
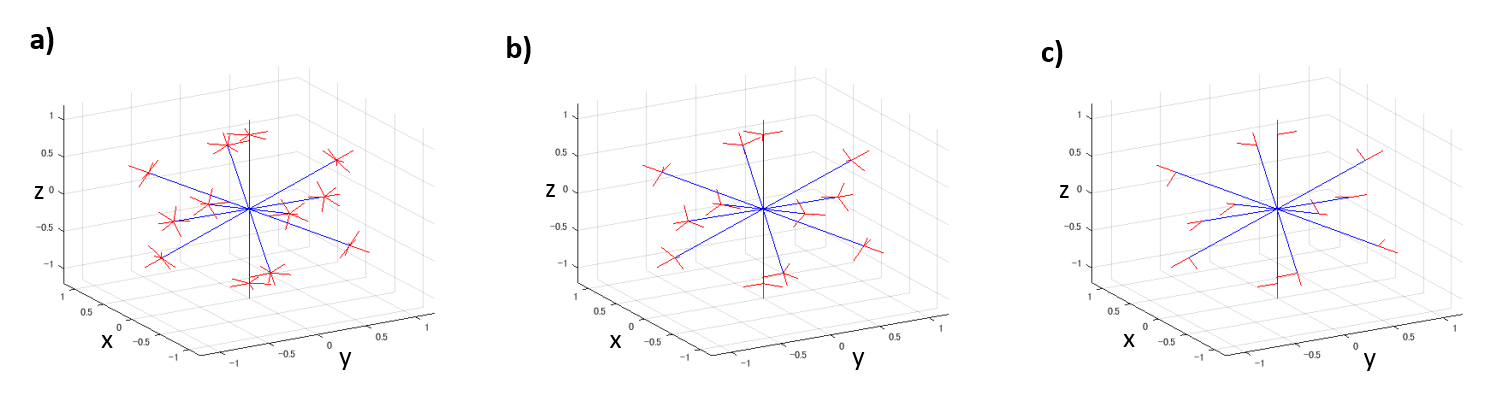
Double diffusion encoding (DDE) can quantify microscopic fractional anisotropy (μFA) without modelling restrictions1. The 5-design applies 12 parallel and 60 orthogonal diffusion encoding pairs for rotationally-invariant powder-averaging the data with 72 diffusion encodings. (Figure 1a), however 72 may result in too much acquisition time for clinical usage. Recently, Yang et al. proposed that as few as 12 measurements could suffice to quantify μFA if the diffusion appears to follow a Gaussian distribution2. Also, Kerkelä et al. compared Yang's approach with the 5-design and they indicated Yang's proposed scheme was comparable to that of the 5-design, if given enough SNR, and can reduce to 24 diffusion encodings from the 72 diffusion encodings for the 5-design3. However, they were verifying with a 9.4T ultra-high field scanner, and it is important to make sure that the same results can be obtained with practical acquisition time using a clinical 3T MR scanner for clinical application. Furthermore, when a number of signal averages greater than 1 would be required to keep enough SNR for accuracy of μFA calculation, it can be applied by increasing the number of orthogonal diffusion encoding pairs instead of increasing the number of signal averages. The aim of this study is to directly compare Yang's proposed scheme and our proposed diffusion encoding scheme with the 5-design, using a clinical 3T MR scanner.Theory:
DDE sequence applies the diffusion encoding twice along two orientations before data acquisition. The μFA can be calculated as$$μFA=\sqrt{{\frac{3}{2}}\frac{μA}{μA+\frac{3}{5}\text{MD}^2}}\,\,\,\,\,\,\,\,\,\,(1)$$
Where MD stands for mean diffusivity and μA2 and ε are the following,
$$μA^2=\frac{ε}{∆}\,\,\,\,\,\,\,\,\,\,(2)$$
$$ϵ = \frac{\left[\log\left( \frac{1}{N_{para}} ∑S_∥ \right)-\log\left( \frac{1}{N_{ortho}} ∑S_⊥ \right) \right]}{ q^4}\,\,\,\,\,\,\,\,\,\,(3)$$
where $$$S_∥$$$ is signal with parallel diffusion encoding, $$$S_⊥$$$ is signal with orthogonal diffusion encoding, $$$N_{para}$$$ is Number of parallel diffusion encoding, $$$N_{ortho}$$$ is Number of orthogonal diffusion encoding and q is q-value.
Methods:
This study was approved by our institutional review board and informed consent was obtained. Head axial scans through the whole brain were acquired on a Vantage Galan 3T / ZGO (Canon Medical Systems Corp.) using a single-shot SEEPI2D sequence. Acquisition parameters were TR/TE = 5000ms/101ms, FOV = 24cm x 24cm, Matrix = 80x80, slice thickness/gap = 3mm/0mm, number of slices = 42, in-plane parallel imaging reduction factor = 2.0, multiband factor = 2.0, and b-value = 0 and 2000s/mm2 (for the entire of DDE). Parameters of diffusion times were δ = 16ms, Δ = 18ms and mixing time = 27ms. We compared the 5-design, our proposed scheme and the minimal scheme proposed by Yang which are shown in figure 1. Our proposed scheme reduced the orthogonal diffusion encoding from five with the 5-design to three (Figure 1b). We used 12 symmetric acquisition for the proposed pattern B similar to the concept as Kerkelä (Figure 1c). Acquisition times (the 5-design with 1 average, our proposed scheme with 1 average and minimal scheme with 1 average) were 6:20, 4:20 and 2:20, respectively. Also, to evaluate μFA with similar SNR among each diffusion scheme, we matched total number of acquisition time for the 5-design, our proposed scheme and minimal scheme as following, acquisitions with the 5-design were averaged 2 times, acquisitions in our proposed scheme were averaged 3 times and acquisitions with the minimal scheme were averaged 6 times, totaling 144 acquisitions. Diffusion data were pre-processed using FSL[https://fsl.fmrib.ox.ac.uk/fsl/fslwiki/] to correct for susceptibility-induced distortions, and eddy currents. The region extraction of cortical, subcortical and white-matter used three atlases, the “Desikan-Killiany atlas” from FreeSurfer, the “JHU ICBM-DTI-81 white-matter labels atlas” and the “JHU white-matter tractography atlas”. FA and μFA were calculated for each diffusion encoding patterns. Regions of interest were drawn on each region as described above.Results:
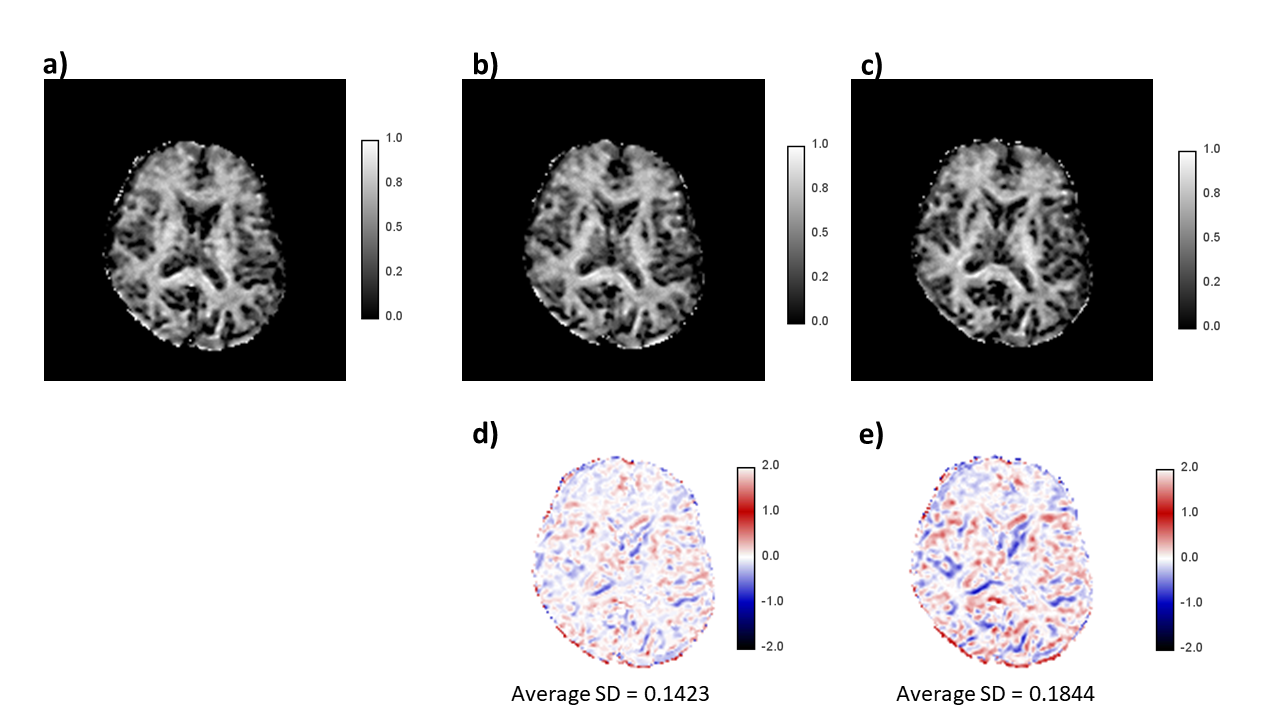
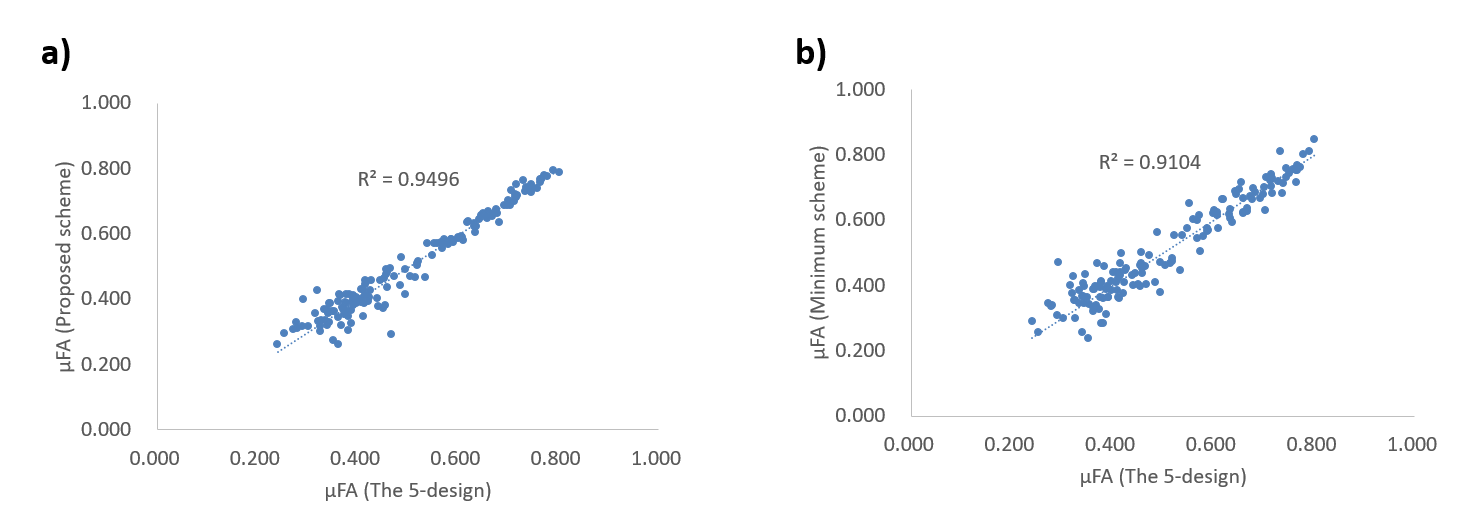
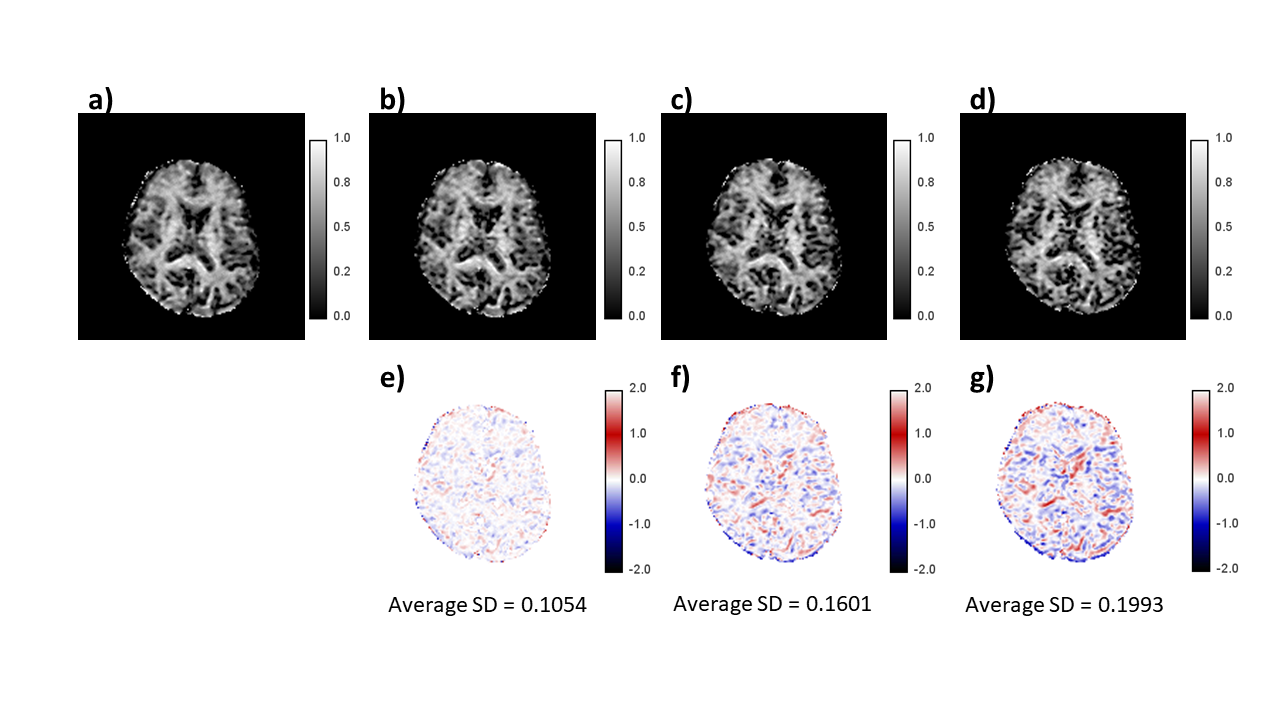
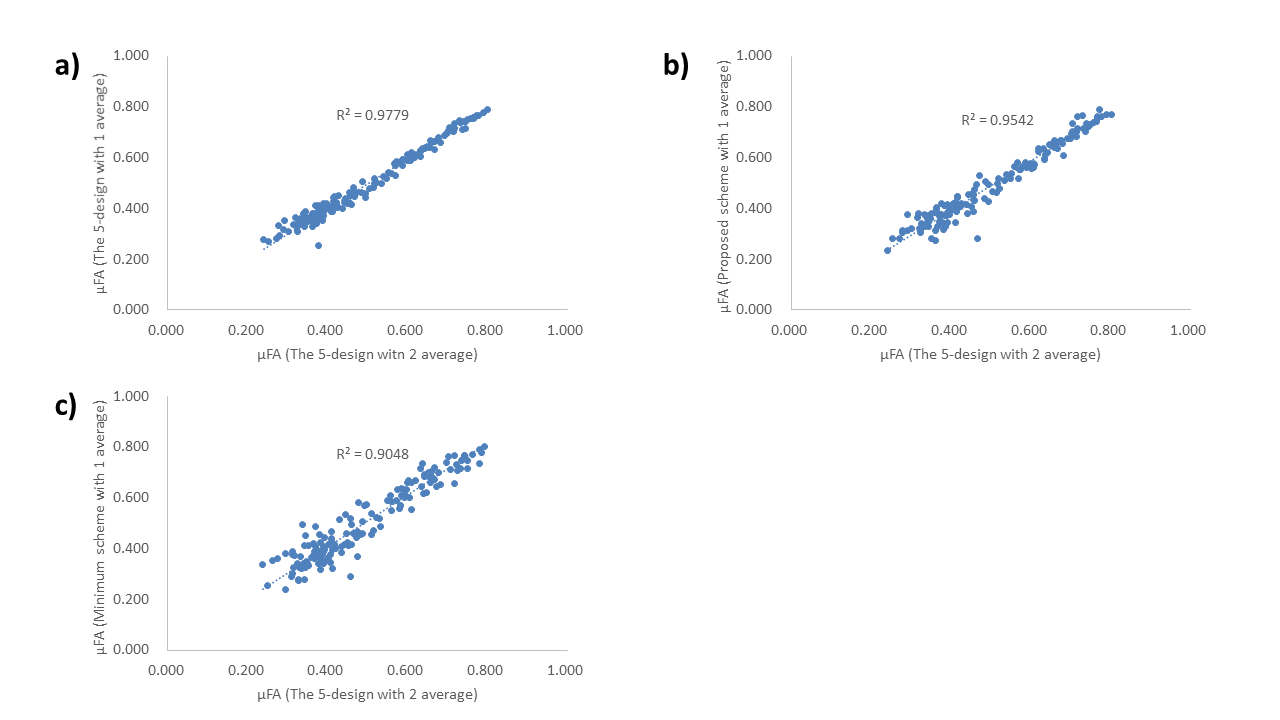
Brain segment-wise comparison of µFA value revealed excellent agreement between our proposed scheme and the 5-design, also between the minimal scheme and the 5-design, regardless of the total number of acquisitions. Furthermore, our proposed scheme got slightly better agreement of μFA values compared to the minimal scheme. However, these correlation coefficients became slightly worse than it between the 5-design with 2 averages and the 5-design with 1 average (Our proposed scheme and the 5-design gave R2=0.9496, and R2=0.9542. The minimal scheme and the 5-design gave R2=0.9104, and R2=0.9048. The 5-design with 2 averages and the 5-design with 1 average gave R2=0.9779). The average SD of the difference image increased corresponding to decreasing the total numbers of acquisitions.Discussion and Conclusion:
In clinical usage with clinical 3T system, the minimal scheme with 1 average might have not enough SNR to give accurate μFA. Using more than 1 average with the minimal scheme may reduce the average SD of difference image between the minimal scheme and the 5-design. However, it may not improve the agreement of μFA between the minimal scheme and the 5-design and as the acquisition time of the minimal scheme becomes closer to that of our proposed scheme. Our proposed scheme used less than 5 minutes of acquisition time with 1 signal average and has the possibility to obtain μFA maps closer to the 5-design than the minimal scheme in clinical usage using a clinical 3T scanner.Acknowledgements
No acknowledgement found.References
1. Jespersen, Sune Nørhøj, et al. "Orientationally invariant metrics of apparent compartment eccentricity from double pulsed field gradient diffusion experiments." NMR in Biomedicine 26.12 (2013): 1647-1662.
2. Yang, Grant, et al. "Double diffusion encoding MRI for the clinic." Magnetic resonance in medicine 80.2 (2018): 507-520.
3. Leevi Kerkelä, et al. “Experimental validation and SNR analysis of a clinical double diffusion encoding sequence” Proc. Intl. Soc. Mag. Reson. Med. 27 (2019) 3557
Figures