4460
Influence of WM fibre orientation on gradient-echo derived tissue parameters1University of Queensland, Brisbane, Australia, 2Eindhoven University of Technology, Eindhoven, Netherlands, 3The University of Queensland, University of Queensland, Brisbane, Australia, 4The ARC Training Centre for Innovation in Biomedical Imaging Technology, University of Queensland, Brisbane, Australia
Synopsis
This study investigates the effect of white matter fibre orientation with respect to main magnetic field on gradient-echo (GRE) derived tissue phase, susceptibility, magnetization transfer ratio, R2* and water fraction of myelin water compartments. Spherical deconvolution is used to identify multiple fibre bundles within each imaging voxel. We observed that these GRE derived parameters show moderate sensitivity towards the changes in fibre orientations. Using bi- instead of mono-exponential fitting, it additionally showed that myelin R2* seems more sensitive to the fibre orientation than previously anticipated.
Introduction
Gradient-echo (GRE) based myelin quantification relies on the magnitude and phase data obtained from the relaxation decays of the myelinated, axonal and extracellular water compartments of white matter fibres (WMF)1,2. Several studies have suggested that GRE-derived measures may be biased by the orientational distribution of WMF with respect to the main magnetic field3–7. However, few studies have also reported that R2* of WMF is not sensitive to the WMF orientation8,9. This exploratory study evaluates the influence of WMF orientations on a comprehensive list of parameters commonly used for myelin assessment: tissue phase, susceptibility, Magnetization Transfer Ratio (MTR), R2* and water fraction (WF) of the myelin water compartment. In addition to the conventional use of diffusion tensor imaging (DTI) for determining the orientational distribution of WMF in brain, we used constrained spherical deconvolution10–12 , which allows the detection of multiple fibre bundles (‘fixels’) within one voxel to solve for the crossing fibre problem13.Methods
MRI data was obtained from one healthy volunteer (age 24 years) using a 3T MRI scanner (Prisma, Siemens Healthcare, Erlangen, Germany) and a 64-channel head coil. DWI data was acquired using NODDI protocol14,15 with the following parameters: b-value 0 (8 averages)/1000 (27 directions)/2500 (62 directions) smm-2, 2 mm3 isotropic resolution, 75 ms TE and 4.1 s TR. 3D GRE data was obtained at the same imaging session with the following parameters: 20° flip angle, 20 echoes with 2.37 – 70.58 ms TE and 3.59 ms echo spacing, 74 ms TR and 1.25 mm3 isotropic resolution, MT ON and MT OFF. The study was approved by the university human ethics committee and written informed consent was obtained from the participant. DWI data were processed using Mrtrix (www.mrtrix.org) for the entire brain by tensor fitting as well as calculating fibre orientation distribution (FOD) > fixel maps > apparent fibre density (AFD) maps > angle maps for each fixel with respect to B0. 3D WM masks were computed from the angle maps. The 3D GRE data sets were first realigned and resliced using SPM12 (https://www.fil.ion.ucl.ac.uk/spm/) to match the orientation and resolution of DWI dataset. Tissue phase and susceptibility maps were computed using STI Suite16 with Laplacian-based phase unwrapping and V-SHARP17 based background phase removal techniques. The magnitude GRE data was fitted to mono- and bi-exponential relaxation decay models using the “Trust-region” algorithm18. MTR was computed using a Matlab (Mathworks, Natick, MA) implementation based on reference19.Results
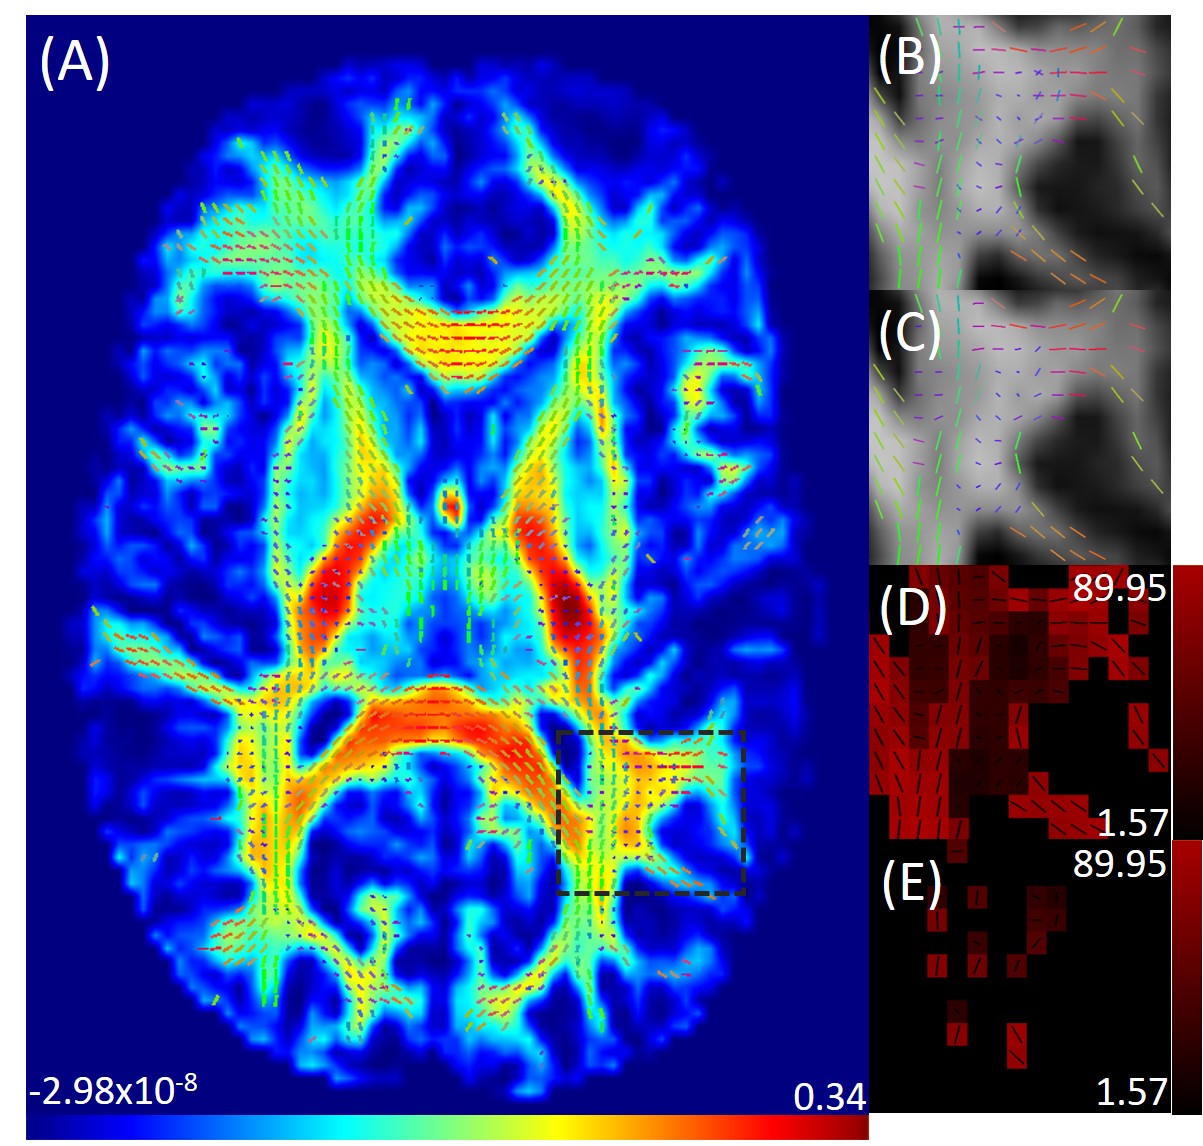
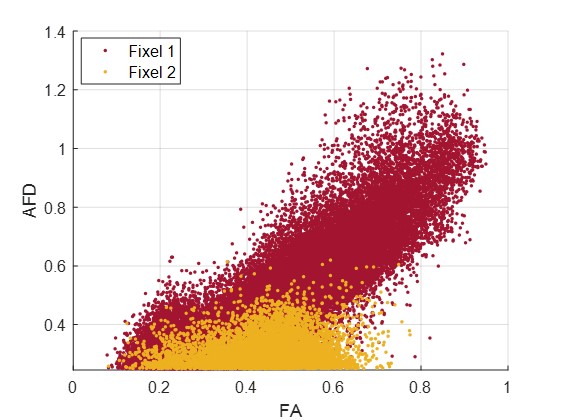
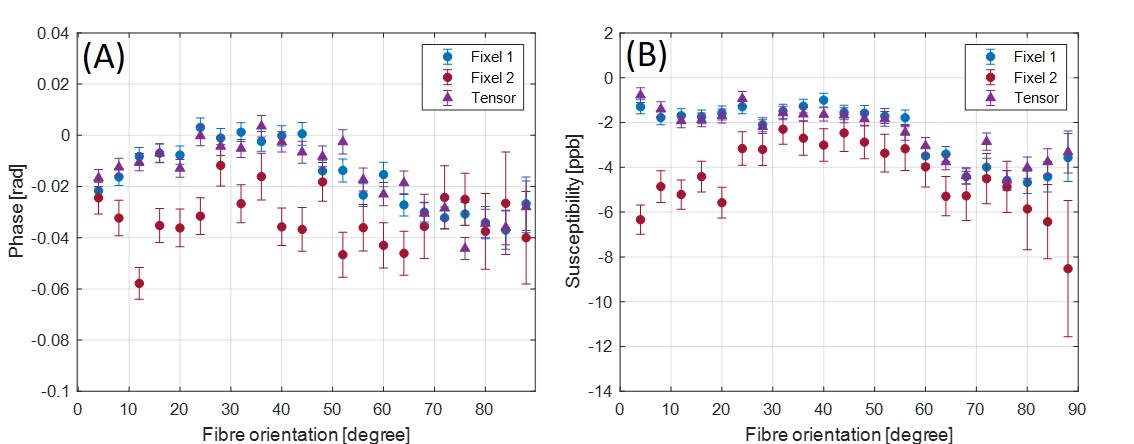
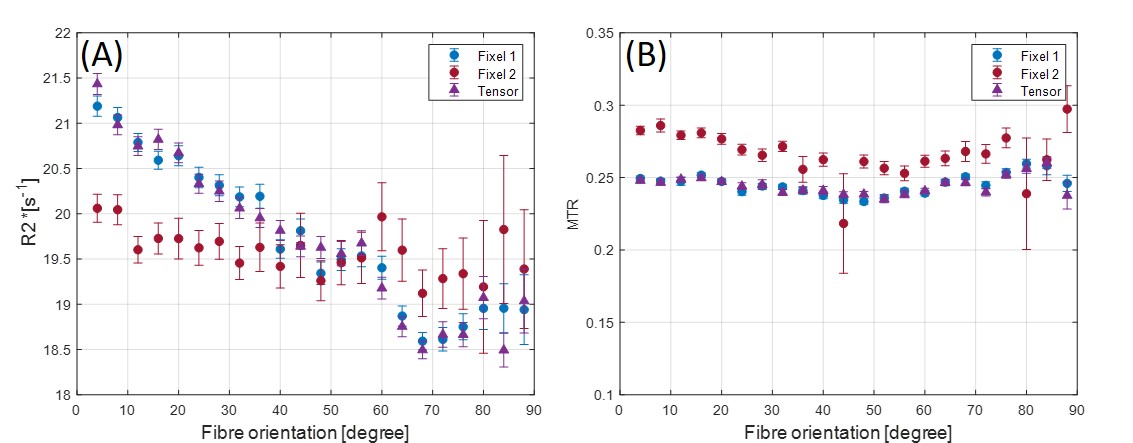
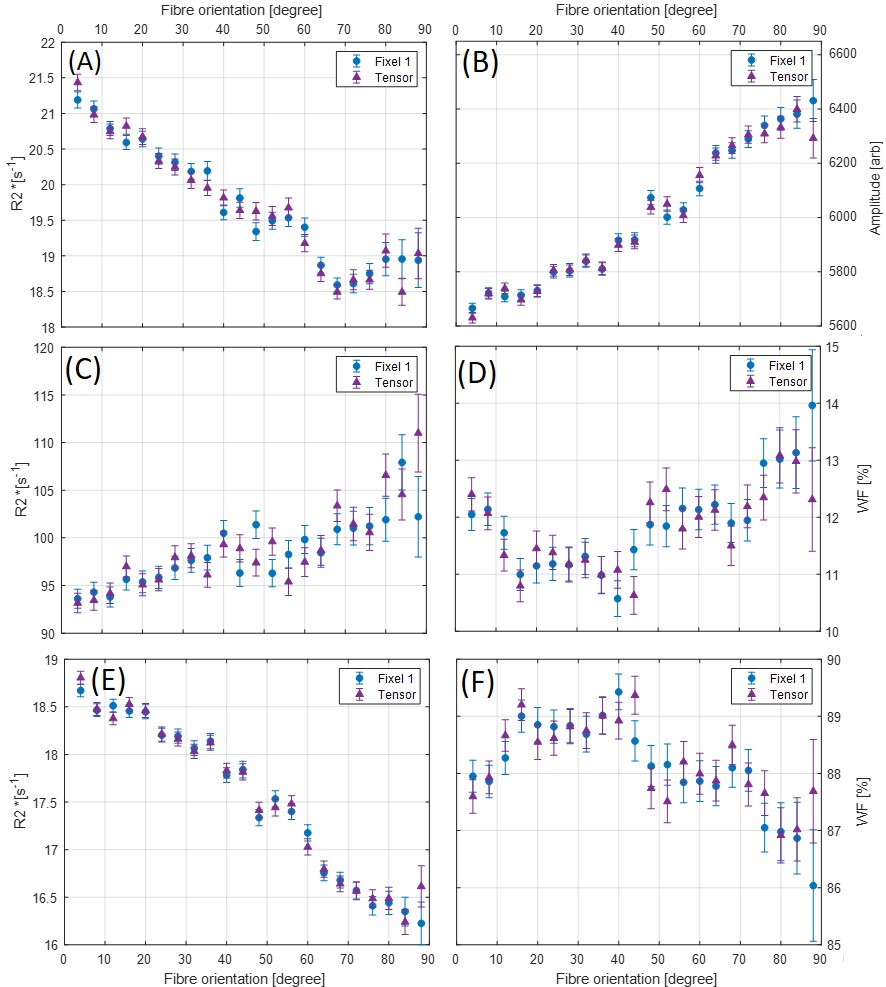
Figure 1 shows an axial cross section of the brain with the two major fixels (fixel 1 and fixel 2) within each voxel and the corresponding angle maps. When plotted against the conventional measure of fractional anisotropy (FA) of the same voxels (Fig. 2), the AFD of the primary fixel was found to be significantly correlated to FA (Pearson’s correlation coefficient of 0.87) while no significant correlation was found for the secondary fixel. WM fibre orientations of the primary fixel demonstrated more consistent influence on tissue phase, susceptibility, R2* and MTR compared to the secondary fixel (Fig. 3 and Fig. 4). The fibre orientation denoted by fixel 1 and tensor fitting were nearly identical as was shown by the changes in these parameters as a function of fibre orientation with respect to main magnetic field. Figure 5 shows that the R2* measured by mono-exponential fitting was moderately influenced by the orientation of the primary fibres (fixels) within voxels whereas bi-exponential fitting suggested that the orientation of the primary fibres had a larger effect on the myelin R2* than on the axonal/extracellular R2*.Discussion
The fibre orientation distribution measured from primary fibre bundles (fixel 1) were similar to the results obtained from conventional tensor fitting method for all tissue parameters measured. The dependence of tissue phase and susceptibility with respect to the WMF orientation is in agreement with previously reported values in literature3. The changes observed in susceptibility as well as MTR were also supported by the results of previous studies5,7. It is worth noting that the results obtained by previous studies only estimated the relation between the orientations of the primary fibre bundles and did not account for the secondary fibre bundles and their influences as demonstrated by this study. In line with literature3,5, the R2* estimated here using mono-exponential fitting was influenced by the WMF orientations, based on the assumption that the water pool of white matter is homogeneous within each voxel. From our results using bi-exponential fitting R2* of myelin seems quite sensitive to fibre orientation with less bias for axonal R2*, potentially explaining previously reported R2* variations obtained from data using TEs of 10 – 30 ms3. MWF values were relatively stable with fibre orientations suggesting a minor influence for myelin quantification in bi-exponential fitting.Conclusion
Advanced spherical deconvolution techniques seem to indicate a small influence of secondary fibre bundle on GRE derived parameters. The use of bi-exponential fitting revealed that R2* of myelin seems more sensitive to the fibre orientation than originally anticipated.Acknowledgements
The authors acknowledge the facilities and scientific and technical assistance of the National Imaging Facility, a National Collaborative Research Infrastructure Strategy (NCRIS) capability, at the Centre for Advanced Imaging, The University of Queensland. We also acknowledge Tom Shaw for helping out with the image registration.References
1 K. Thapaliya, V. Vegh, S. Bollmann and M. Barth, Neuroimage, 2018, 182, 407–416.
2 Y. P. Du, R. Chu, D. Hwang, M. S. Brown, B. K. Kleinschmidt-DeMasters, D. Singel and J. H. Simon, Magn. Reson. Med., 2007, 58, 865–870.
3 C. Denk, E. H. Torres, A. Mackay and A. Rauscher, NMR Biomed., 2011, 24, 246–252.
4 B. Bender and U. Klose, NMR Biomed., 2010, 23, 1071–1076.
5 J. Lee, P. van Gelderen, L. W. Kuo, H. Merkle, A. C. Silva and J. H. Duyn, Neuroimage, 2011, 57, 225–234.
6 D. J. West, R. P. A. G. Teixeira, T. C. Wood, J. V. Hajnal, J.-D. Tournier and S. J. Malik, Neuroimage, 2019, 195, 78–88.
7 A. Pampel, D. K. Müller, A. Anwander, H. Marschner and H. E. Möller, Neuroimage, 2015, 114, 136–146.
8 R. M. Henkelman, G. J. Stanisz, J. K. Kim and M. J. Bronskill, Magn. Reson. Med., 1994, 32, 592–601.
9 T. Li, F. Masaki, S. Dodd, P. van Gelderen, M. Hellmut and J. Duyn, Proc. 17th Sci. Meet. Int. Soc. Magn. Reson. Med., 2009, Honolulu, 957.
10 J. D. Tournier, F. Calamante, D. G. Gadian and A. Connelly, Neuroimage, 2004, 23, 1176–1185. 11 B. Jeurissen, J. D. Tournier, T. Dhollander, A. Connelly and J. Sijbers, Neuroimage, 2014, 103, 411–426.
12 J. D. Tournier, F. Calamante and A. Connelly, Neuroimage, 2007, 35, 1459–1472.
13 D. C. Alexander, G. J. Barker and S. R. Arridge, Magn. Reson. Med., 2002, 48, 331–340. 14 H. Zhang, T. Schneider, C. A. Wheeler-Kingshott and D. C. Alexander, Neuroimage, 2012, 61, 1000–1016.
15 F. Sepehrband, K. O’Brien and M. Barth, Magn. Reson. Med., 2017, 78, 2170–2184.
16 W. Li, A. V. Avram, B. Wu, X. Xiao and C. Liu, NMR Biomed., 2014, 27, 219–227.
17 P. S. Özbay, A. Deistung, X. Feng, D. Nanz, J. R. Reichenbach and F. Schweser, NMR Biomed., , DOI:10.1002/nbm.3550.
18 T. S. Ali, I. Prasadam, Y. Xiao and K. I. Momot, Sci. Rep., 2018, 8, 1–15.
19 M. Ganzetti, N. Wenderoth and D. Mantini, Front. Hum. Neurosci., 2014, 8, 1–14.
Figures