4459
Exploring the vascular and neurodegenerative origin of increased interstitial fluid diffusion in intravoxel incoherent motion1Department of Radiology and Nuclear Medicine, Maastricht University Medical Center, Maastricht, Netherlands, 2Department of Psychiatry and Neuropsychology, Maastricht University, Maastricht, Netherlands, 3School for Mental Health and Neuroscience, Alzheimer Center Limburg, Maastricht, Netherlands, 4Department of Radiology, Leiden University Medical Center, Leiden, Netherlands
Synopsis
Spectral analysis using non-negative least squares in intravoxel incoherent motion enables estimation of an intermediate component in the diffusion spectrum between parenchymal diffusion and microvascular pseudodiffusion. However, the precise source of the intermediate component remains unknown. By studying the relation of the intermediate component with vascular (i.e. WMH volume) and neurodegenerative (i.e. hippocampal atrophy) biomarkers, the current study aimed to gain more knowledge about the interpretation of the intermediate peak in relation to cognitive status and its underlying pathology. The intermediate peak seems to be a promising imaging biomarker for microvascular and neurodegenerative pathology in Alzheimer’s disease and its prestages.
Introduction
Intravoxel incoherent motion (IVIM) has the ability to separate parenchymal diffusion from microvascular pseudo-diffusion1. IVIM can quantify exactly two or three components when using bi- or tri-exponential models1,2, respectively. In contrast, the spectral analysis method using the non-negative least squares (NNLS) method lays no constraints on the number of estimated components3. Spectral analysis has been used to identify an intermediate peak between two classical components, which is argued to represent increased interstitial fluid within enlarged perivascular spaces (ePVS)3. Wong et al.3 showed that the amplitude of the intermediate peak relates to the number of ePVS and the volume of white matter hyperintensities (WMH). An increased amplitude of this peak has been suggested to be related to an impaired glymphatic system4, but the precise source of this diffusion signal still remains unknown. In addition, no studies have looked at the role of the intermediate component in memory clinic patients, who are expected to have an impaired glymphatic system. The current study aims to investigate the intermediate peak in a population of individuals from a memory clinic with a range of cognitive abilities and a variation in neurovascular and neurodegenerative pathology. By studying the relation of the intermediate diffusion component with vascular (i.e. WMH volume) and neurodegenerative (i.e. hippocampal atrophy) biomarkers, the current study aims to gain more knowledge about the interpretation of the intermediate peak in relation to cognitive status and its underlying pathology.Methods
Subjects: Eighty-five patients (17 Alzheimer’s disease (AD), 19 mild cognitive impairment (MCI) and 9 vascular cognitive impairment (VCI) patients) and 39 healthy controls were included in this study.MRI acquisition: All subjects underwent an MRI protocol (Philips 3.0 Tesla) with a 32-channel head coil, as previously described in more detail5. Diffusion MR images were acquired using single-shot spin-echo echo planar imaging (EPI) sequence in orthogonal 3 directions (TR/TE = 6800/84ms; matrix = 112x112x58; pixel size = 2.4mm, transverse slice thickness = 2.4mm), after cerebrospinal fluid suppression (TI = 2230ms). Fifteen diffusion sensitive b-values were employed (b = 0,5,7,10,15,20,30,40,50,60,100,200,400,700 and 1000 s/mm2).
Image analysis: Trace images were calculated and corrected for head displacements, eddy current and EPI distortions (ExploreDTI version 4.8.4)6 and smoothed with a 3mm FWHM Gaussian kernel (FSL version 6.0.1)7. Freesurfer version 5.1.0 was implemented to automatically segment anatomical T1 images, with manual inspection8. WMH were identified, as previously described5,9. White matter (WM) was separated into WMH and normal appearing WM (NAWM). The following regions of interest (ROIs) were coregistered to native IVIM space via the T1 anatomical images (FLIRT, FSL)10: cortical gray matter (GM), subcortical GM, WMH and NAWM. WMH and hippocampal volume were corrected for total intracranial volume.
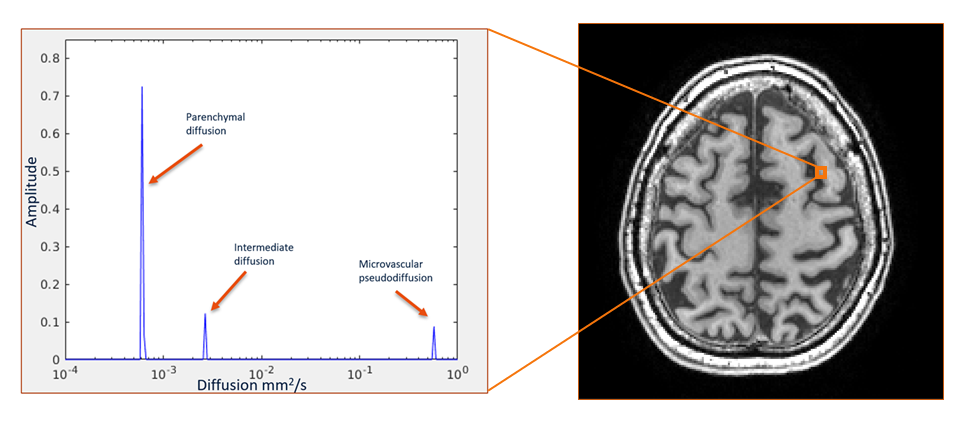
ePVS were rated in the basal ganglia (BG) and centrum semiovale (CSO) as follows: 0=<10 ePVS, 1=10-20 ePVS, 2=>20 ePVS (see Figure 1). Spectral analysis using NNLS was conducted to analyze the IVIM data in a voxel-based manner3. The intermediate diffusion component was identified as 1.5<D<4.0*10-3 mm2/s, and the contribution of the intermediate component to the signal was determined by quantifying fint, while correcting for T1 and T2 relaxation effects3. The median value of the fraction and diffusivity values were extracted for each individual ROI. Spearman’s rho correlations adjusted for age and gender were computed between variables of interest (i.e. hippocampal atrophy, WMH volume, BG ePVS and CSO ePVS) and fint for each ROI (IBM SPSS statistics version 25).
Results
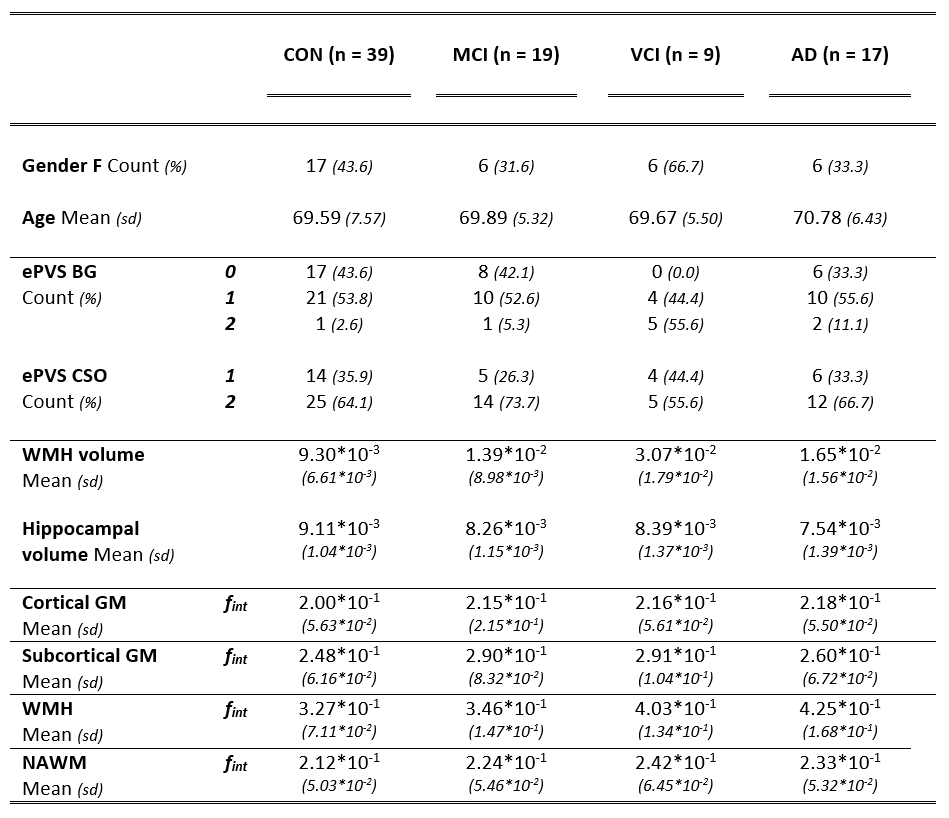
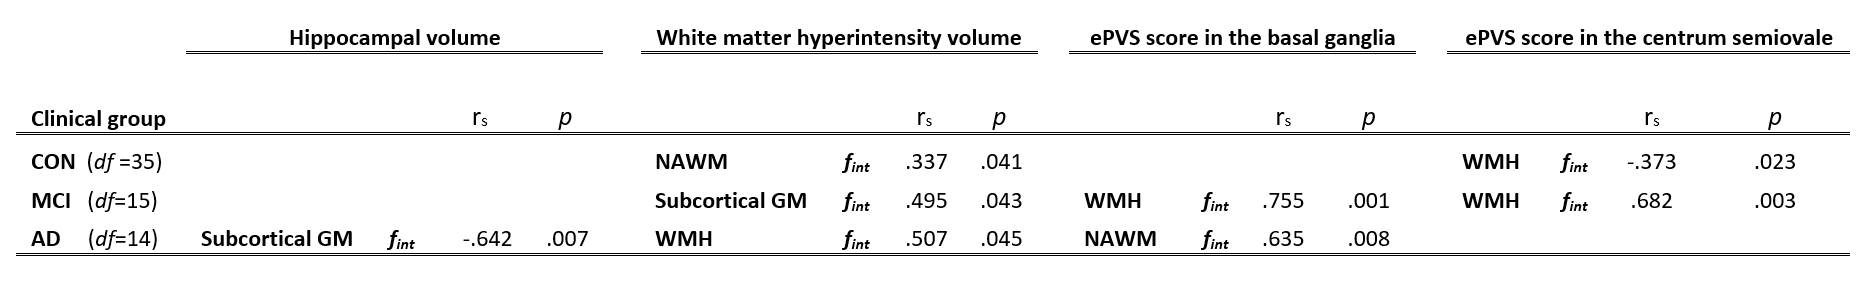
Table 1 provides information on the demographics, vascular and neurodegenerative markers and fint for each ROI. An example of a diffusion spectrum in the GM of an AD patient including the parenchymal, intermediate and microvascular peak is displayed in Figure 2. Table 2 contains all significant Spearman’s rho correlations of fint with vascular and neurodegenerative markers, adjusted for age and sex. For example, a negative association can be observed between hippocampal volume and fint in the subcortical GM in the AD group, while this relationship was absent within the other clinical groups (see Figure 3). In contrast, a positive correlation can be found within the MCI group, where increased WMH volume is associated with a higher fint in subcortical GM (see Table 2). Additionally, significant correlations have been identified between CSO ePVS and fint in WMH in both controls and MCIs, between BG ePVS and WMH fint in MCI, and between BG ePVS and NAWM fint in AD.Discussion
In this explorative study, we found multiple associations between the IVIM intermediate volume fraction and WMH volume, hippocampal atrophy, and ePVS score in the BG and CSO in a sample of memory clinic patients and controls with various degrees of vascular and degenerative pathology. We thereby identify fint as a promising imaging biomarker for microvascular and neurodegenerative pathology in AD and its prestages. Additionally, the findings of this study suggest that both vascular and neurodegenerative processes are associated with variation in intermediate peak fraction in memory clinic patients and cognitively normal individuals. Future longitudinal life-span studies may be able to reveal the mechanistic temporal relation between changes in fint, vascular pathology, neurodegeneration and cognitive decline.Conclusion
fint is a promising imaging biomarker for microvascular and neurodegenerative pathology in AD and its prestages.Acknowledgements
This research was supported by Alzheimer Nederland (research grant WE.03-2018-02).References
1. Le Bihan D, Breton E, Lallemand D, Aubin M, Vignaud J, Laval-Jeantet M. Separation of diffusion and perfusion in intravoxel incoherent motion MR imaging. Radiology. 1988;168(2):497-505.2. Zeng Q, Shi F, Zhang J, Ling C, Dong F, Jiang B. A modified tri-exponential model for multi-b-value diffusion-weighted imaging: A method to detect the strictly diffusion-limited compartment in brain. Frontiers in neuroscience. 2018;12:102.
3. Wong SM, Backes WH, Drenthen GS, Zhang CE, Voorter PH, Staals J, et al. Spectral diffusion analysis of intravoxel incoherent motion MRI in Cerebral small vessel disease. Journal of Magnetic Resonance Imaging. 2019.
4. Mestre H, Kostrikov S, Mehta Rupal I, Nedergaard M. Perivascular spaces, glymphatic dysfunction, and small vessel disease. Clinical Science. 2017;131(17):2257-74.
5. Freeze WM, Jacobs HI, de Jong JJ, Verheggen IC, Gronenschild H, Palm WM, et al. White matter hyperintensities mediate the association between blood-brain barrier leakage and information processing speed. Neurobiology of Aging. 2019.
6. Leemans A, Jeurissen B, Sijbers J, Jones D, editors. ExploreDTI: a graphical toolbox for processing, analyzing, and visualizing diffusion MR data. The Proceedings of the International Society of Magnetic Resonance in Medicine. 2009.
7. Jenkinson M, Beckmann CF, Behrens TE, Woolrich MW, Smith SM. FSL. Neuroimage. 2012;62(2):782-90.
8. Fischl B. FreeSurfer. Neuroimage. 2012;62(2):774-81.
9. Jacobs HI, Clerx L, Gronenschild EH, Aalten P, Verhey FR. White matter hyperintensities are positively associated with cortical thickness in Alzheimer's disease. Journal of Alzheimer's Disease. 2014;39(2):409-22.
10. Jenkinson M, Bannister P, Brady M, Smith S. Improved optimization for the robust and accurate linear registration and motion correction of brain images. Neuroimage. 2002;17(2):825-41.
11. Arba F, Quinn TJ, Hankey GJ, Lees KR, Wardlaw JM, Ali M, et al. Enlarged perivascular spaces and cognitive impairment after stroke and transient ischemic attack. International journal of stroke: official journal of the International Stroke Society. 2018;13(1):47-56.
12. Huijts M, Duits A, Staals J, Kroon AA, de Leeuw PW, van Oostenbrugge RJ. Basal ganglia enlarged perivascular spaces are linked to cognitive function in patients with cerebral small vessel disease. Current neurovascular research. 2014;11(2):136-41.
Figures