4457
Neuroanatomical underpinning of cerebral cortical mean kurtosis from diffusion MRI1Radiology, Children's Hospital of Philadelphia, Philadelphia, PA, United States, 2Bioengineering, University of Pennsylvania, Philadelphia, PA, United States, 3Radiology, University of Pennsylvania, Philadelphia, PA, United States
Synopsis
Cortical mean kurtosis (MK) of diffusion MRI characterizes microstructural complexity in the cerebral cortex. In this study, we tested a linear model that soma and neurite densities jointly contributed to MK with different weights. The actual soma and neurite densities were quantified from digitization of macaque brain histological images of Nissl and neurofilament staining. DKI was acquired from 6 postmortem macaque brains. We found actual MK measurement was accurately predicted by a weighted linear combination of soma and neurite densities from histological images with higher neurite density weight.
Purpose
Cortical mean kurtosis (MK) [1] of diffusion MRI characterizes microstructural complexity in the cerebral cortex. In another study, we have quantified using simulations the contribution of somas and neurites to cortical MK and built up a kurtosis based model for estimating soma density and diameter KINDS (Kurtosis-based ImagiNg of Density of Somas in the cerebral cortex). In this study, we tested the model that soma and neurite densities jointly contributed to MK with different weights in a linear model. The actual soma and neurite densities were quantified from digitization of macaque brain histological images of Nissl and neurofilament staining. DKI was acquired from 6 postmortem macaque brains. We found actual MK measurement was accurately predicted by weighted linear combination of soma and neurite densities from histological images with higher neurite density weight.Methods
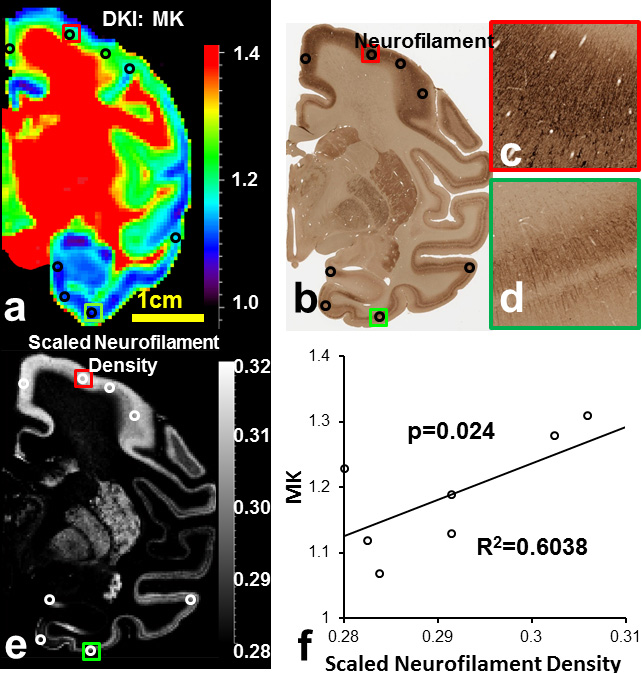
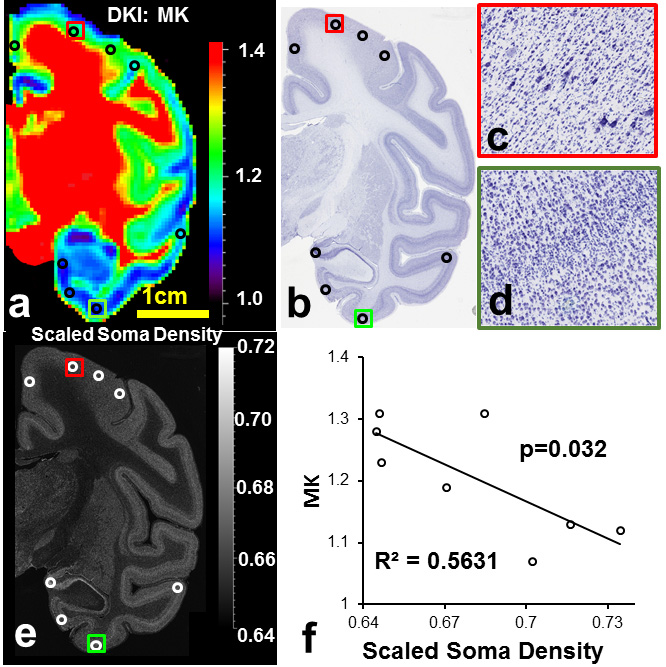
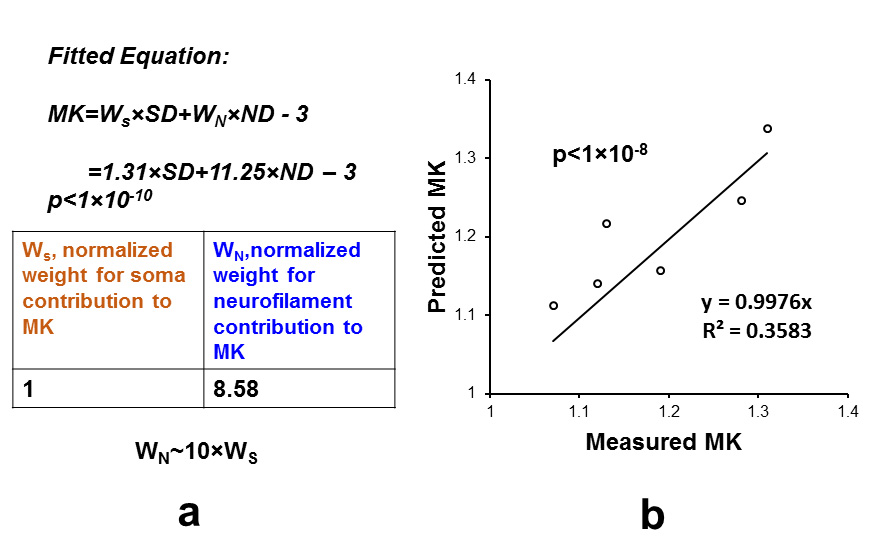
Diffusion MRI: DKI acquisitions with two b-values (b=1000mm2/s, b=4500mm2/s) and 30 independent gradient directions were performed on a normal postmortem Rhesus macaque brain. Coronal slice acquisitions were obtained using a single-shot EPI sequence with SENSE parallel imaging scheme (R=2) for comparison with coronal orientated slices in histology found on braimaps.org [2]. DWI parameters: FOV=130×130×72mm, in plane imaging matrix=144×142, slice thickness=2mm, TR/TE=2100/77.8ms, NSA=24). Two repetitions were performed for each b-value acquisition to further increase the signal to noise ratio resulting in a total acquisition time of 17hours. DKI fitting: After correction of eddy current distortion, DKI fitting was performed with in-house Matlab code using DKI constrained linear least squares fits, and mean kurtosis(MK) maps were obtained. Digitization and quantification of soma and neurite densities from histological images of Nissl and neurofilament staining: Neurofilament stained and Nissl stained histology image slices were selected based on their similarity to the chosen MK slice. Neurofilament density were computed by digitizing neurofilament stained histology image and inverting the intensity, segmenting the image into 946×946 pixels ROIs equivalent to 0.94×0.94mm (similar to the DKI image acquisition resolution) and calculating the percentage of pixels with intensity higher than a threshold. Similarly, soma density (SD) were computed by digitizing and intensity-inverting the image, segmenting to DKI resolution, and computing the percentage of pixels above threshold. To normalize the ND and SD values, theoretical ND and SD values corresponding to the experimental MK values were obtained from simulations results in Camino [3], and ND and SD values are scaled to the theoretical range. Correlation and prediction of MK with SD and ND: Eight regions of interest (ROIs) with prominent regional cortical MK differences were selected, and their average MK values were recorded. Scaled ND and SD in the ROIs were correlated with average MK values in the ROIs to study the dependence of MK on neurofilament density and soma density. Further, as part of KINDS (Kurtosis-based ImagiNg of Density of Somas in the cerebral cortex) framework, we fitted a linear model $$$MK=w_S\times SD+w_N\times ND-3$$$ to the data, and obtained the weight of soma contribution and the weight of neurofilament contribution. KINDS predicts that both soma and neurites contribute to kurtosis with different weights.Results/Discussion
MK values in the prefrontal cortex (Fig. 1 red arrows) were found to be consistently higher than the MK values in the temporal regions (Fig. 1 yellow arrows) across six subjects. MK is significantly correlated to both ND (Fig. 2) and SD (Fig. 3). We have proved that both soma and neurofilaments contribute to MK with different weights in another simulation study. We hypothesize that soma contributes to MK with a smaller weight than neurofilaments. When SD (equivalently soma volume fraction) increases, ND (equivalently neurite volume fraction) decreases, resulting in a drop in the MK. The fitted linear model is $$$MK=w_S\times SD+w_N\times ND-3$$$ shown in Fig. 4, with the weight for neurofilament contribution to MK,$$$w_N$$$ ~10 times larger than the weight for soma contribution to MK , $$$w_S$$$(Fig.4a), and the predicted MK from the model equation significantly correlated with experimental MK (Fig.4b). The distinct weights for soma/neurite contributions are expected due to the nature of the diffusion environments in soma and neurofilaments. Soma has average diameter 10-20$$$\mu m$$$ , much larger than the average neurofilament diameter 1-2$$$\mu m$$$. At the diffusion time$$$\Delta =37ms$$$ spins in the neurofilament intracellular diffusion environment would have sensed more barriers than spins in the soma intracellular diffusion environment, resulting in a higher weight for contribution to total MK. In fact, for a fixed volume, a sphere is the geometrical object with the smallest surface area, hence the spherical soma will present the least diffusion barriers for a certain intracellular volume.Conclusion
We proved using experimental data and simulation results that both somas and neurites contribute to MK. MK was accurately predicted by weighted linear combination of soma and neurite density from histological image with neurites contributing at a much higher weight (×10) than somas. Our result is the first experimental evidence for KINDS (Kurtosis-based ImagiNg of Density of Somas in the cerebral cortex), a model for kurtosis-based estimation of soma density and diameter tailored for the cerebral cortex. Acquisition of experimental data at multiple diffusion times for validating the estimated soma density and diameter from KINDS is under way.Acknowledgements
This study is funded by NIH MH092535, MH092535-S1 and HD086984.References
[1]. Jensen, J. H., Helpern, J. A., Ramani, A., Lu, H., & Kaczynski, K. (2005). Diffusional kurtosis imaging: the quantification of non‐gaussian water diffusion by means of magnetic resonance imaging. Magnetic Resonance in Medicine: An Official Journal of the International Society for Magnetic Resonance in Medicine, 53(6), 1432-1440.
[2]. Mikula, S., Trotts, I., Stone, J., and Jones, E.G. 2007. Internet-Enabled High-Resolution Brain Mapping and Virtual Microscopy. NeuroImage. 35(1):9-15
[3]. Hall, M. G., & Alexander, D. C. (2009). Convergence and parameter choice for Monte-Carlo simulations of diffusion MRI. IEEE transactions on medical imaging, 28(9), 1354-1364.
Figures