4456
Scan-Rescan Reliability of Microstructural Imaging Metrics Derived from High-Gradient Diffusion MRI
Maya Polackal1, Qiyuan Tian1,2, Chanon Ngamsombat1,2,3, Aapo Nummenmaa1,2, Thomas Witzel1,2, Eric C. Klawiter2,4, Susie Y. Huang1,2,5, and Qiuyun Fan1,2
1Department of Radiology, Athinoula A. Martinos Center for Biomedical Imaging, Massachusetts General Hospital, Charlestown, MA, United States, 2Harvard Medical School, Boston, MA, United States, 3Department of Radiology, Faculty of Medicine, Siriraj Hospital, Mahidol University, Thailand, 4Department of Neurology, Massachusetts General Hospital, Boston, MA, United States, 5Harvard-MIT Division of Health Sciences and Technology, Massachusetts Institute of Technology, Cambridge, MA, United States
1Department of Radiology, Athinoula A. Martinos Center for Biomedical Imaging, Massachusetts General Hospital, Charlestown, MA, United States, 2Harvard Medical School, Boston, MA, United States, 3Department of Radiology, Faculty of Medicine, Siriraj Hospital, Mahidol University, Thailand, 4Department of Neurology, Massachusetts General Hospital, Boston, MA, United States, 5Harvard-MIT Division of Health Sciences and Technology, Massachusetts Institute of Technology, Cambridge, MA, United States
Synopsis
Scan-rescan reliability of axon diameter index, restricted volume fraction, and DTI metrics derived from high-gradient diffusion MRI was assessed in seven healthy volunteers. Maps of all three metrics were visually comparable from scan/rescan sessions, and moderate to high voxel-wise correlation coefficients were obtained for all metrics. Intraclass correlation coefficients were high for well-defined white matter tracts across all subjects. Our preliminary findings support the robustness and reliability of high-gradient diffusion MR metrics for use in clinical research studies.
Introduction
High-gradient diffusion MRI has demonstrated promise for mapping tissue microstructural properties1 in a variety of neurological disorders, including multiple sclerosis2,3 and stroke. Many factors can affect the reliability of these metrics, including motion artifact, gradient nonlinearity, susceptibility, eddy current distortion, and/or patient positioning. Previously, robustness of AxCaliber diffusion measurements has been tested through scan-rescan experiments in the spinal cord4. Recently, we devised a spherical mean technique (SMT) for estimating axon diameter index and restricted volume fraction in white matter independent of the underlying fiber configuration5. In this work, we sought to assess the scan-rescan reliability of quantitative MR metrics provided by SMT-based microstructural imaging.Methods
Data acquisitionIn total, seven healthy, cognitively normal adults (ages 22-72, 4F) participated in this study. Participants were scanned twice in the same day, with a rest period in which they were removed from the scanner for approximately one hour between scans. Imaging data were acquired on the 3T Connectome scanner with a maximum gradient strength of 300mT/m6,7 using a custom-built 64 channel head coil8. Sagittal 2-mm isotropic resolution diffusion-weight spin-echo EPI images were acquired with whole-brain coverage. Other parameters include: TR/TE=4000/77ms, d=8ms, D=19/49ms, 8 diffusion gradient strengths linearly spaced from 30-290mT/m per D, 32-64 diffusion directions, parallel imaging (R=2) and slice acceleration factor of 2.
Image processing
Diffusion data were corrected for susceptibility and eddy current distortions using the EDDY and TOPUP tools in FSL. To achieve voxel-wise correspondence between scan/rescan images and preserve the original 2 mm isotropic voxel size, the average of interleaved b=0 images was registered to the T1w image within each scan session using boundary-based registration (BBR). The T1w images of the two sessions were also registered using BBR. These transformations were then concatenated to obtain a single transformation between the diffusion space of scan/rescan sessions. To ensure that the process of registration exerts identical influences on the two scan sessions, a halfway transformation was calculated using the concatenated transformation obtained in the last step, which was finally applied to the calculated maps in their native space to bring them to the mid-way point between scan/rescan. FreeSurfer reconstruction (version 6.0) was performed to obtain white matter masks in each subject’s native space, which were transformed to the mid-way point between scan/rescan, and voxels within the white matter mask of both scan/rescan sessions were included to report voxel-wise repeatability measures. The JHU probabilistic atlas of white matter tracts9 was used to generate ROIs to report tract-wise repeatability measures, where NiftyReg was used to perform the nonlinear registration between native diffusion space and the template space
Data analysis
Voxel-wise estimates of axon diameter index, restricted water fraction, hindered water fraction and hindered diffusivity were fitted for using Markov Chain Monte Carlo sampling as described before5. In addition, DTI fitting was performed using the b = 950 s/mm2 data. Voxel-wise correlation coefficient and absolute errors were calculated to measure the voxel-wise repeatability. On the tract level, intraclass correlation coefficients (ICC) were calculated to assess the capability of each metric to reveal the between-subject variation given the intra-subject variability. Specifically,
ICC= (σinter2 )/(σinter2 + σintra2)
Where σinter2 = variancei(mi,avg) and σintra2 = mean(1/2((mi,scan-mi,avg)2 + (mi,rescan-mi,avg)2)), mi,scan is the metric value within a particular tract for a subject i. mi,avg is the average value of said metric between scan and rescan sessions10. According to this expression, an ICC close to 1 reveals a much higher between-subject variation than intra-subject scan-rescan error.
Results
Figure 1 shows representative maps of scan and rescan sessions in a healthy subject that demonstrates the visual consistency in diffusion metrics between scan/rescan sessions. Assessment of registration between scan/rescan sessions yielded a high cross-correlation coefficient for all subjects (Fig.2). Voxel-wise estimates yielded a high Pearson’s correlation coefficient and low absolute deviation of error across all subjects (Fig.3). Figure 4 provides mean correlation coefficients and absolute errors across subjects; the correlation coefficient was calculated within white matter voxels per subject, and the average was taken across all subjects for the represented diffusion metrics (same calculation applied for absolute error). Intraclass correlation coefficient was also calculated for selected tracts across all subjects. ICC values for restricted volume fraction were high across the majority of represented tracts. ICC values for axon diameter are higher for well-defined fiber bundles, such as the corticospinal tract (Fig.5).Discussion and Conclusion
We demonstrate scan-rescan reliability across microstructural metrics derived from high-gradient diffusion MRI, including spherical mean estimates of axon diameter index and restricted volume fraction. The correlation coefficients for FA and restricted volume fraction were high and somewhat lower for the axon diameter index, which appeared more susceptible to image noise and artifacts (e.g., eddy current distortions using higher b-value data). Nevertheless, the correlation coefficients and absolute errors were comparable for those reported for scan-rescan repeatability of AxCaliber metrics in the spinal cord obtained with high-gradient diffusion MR and suggest these metrics can be used to glean relative trends in microstructural measures between individuals. Overall, our preliminary findings support the robustness and reliability of high-gradient diffusion MR metrics for use in clinical research studies. Future work will focus on assessing the scan-rescan reliability of these metrics in more subjects and patients.Acknowledgements
This work was supported by NIH K23NS096056 and U01EB026996.References
- Huang, S. Y. et al. High-gradient diffusion MRI reveals distinct estimates of axon diameter index within different white matter tracts in the in vivo human brain. Brain Struct Funct, doi:10.1007/s00429-019-01961-2 (2019).
- Huang, S. Y. et al. Characterization of Axonal Disease in Patients with Multiple Sclerosis Using High-Gradient-Diffusion MR Imaging. Radiology, 151582, doi:10.1148/radiol.2016151582 (2016).
- Huang, S. Y. et al. Corpus callosum axon diameter relates to cognitive impairment in multiple sclerosis. Ann Clin Transl Neurol 6, 882-892, doi:10.1002/acn3.760 (2019).
- Duval, T., Smith, V., Stikov, N., Klawiter, E. C. & Cohen-Adad, J. Scan-rescan of axcaliber, macromolecular tissue volume, and g-ratio in the spinal cord. Magnetic resonance in medicine : official journal of the Society of Magnetic Resonance in Medicine / Society of Magnetic Resonance in Medicine 79, 2759-2765, doi:10.1002/mrm.26945 (2018).
- Fan, Q. et al. in International Society for Magnetic Resonance in Medicine.
- McNab, J. A. et al. The Human Connectome Project and beyond: initial applications of 300 mT/m gradients. NeuroImage 80, 234-245, doi:10.1016/j.neuroimage.2013.05.074 (2013).
- Setsompop, K. et al. Pushing the limits of in vivo diffusion MRI for the Human Connectome Project. NeuroImage 80, 220-233, doi:10.1016/j.neuroimage.2013.05.078 (2013).
- Keil, B. et al. A 64-channel 3T array coil for accelerated brain MRI. Magnetic resonance in medicine : official journal of the Society of Magnetic Resonance in Medicine / Society of Magnetic Resonance in Medicine 70, 248-258, doi:10.1002/mrm.24427 (2013).
- Mori, S. et al. Stereotaxic white matter atlas based on diffusion tensor imaging in an ICBM template. NeuroImage 40, 570-582, doi:10.1016/j.neuroimage.2007.12.035 (2008).
- Duval & T., S., V., Stikov, N., Klawiter, E. C. and Cohen‐Adad, J. Scan–rescan of axcaliber, macromolecular tissue volume, and g‐ratio in the spinal cord. Magn. Reson. Med. 79, 2759-2765 (2018).
Figures

Figure
1. Representative FA, restricted volume fraction, and diameter index maps in a healthy
subject in scan (upper panel) and rescan (lower panel) sessions. The maps were
shown in the mid-way point between the two sessions, such that identical
anatomical regions can be compared. Visual consistency between scan and rescan
can be appreciated from the maps.
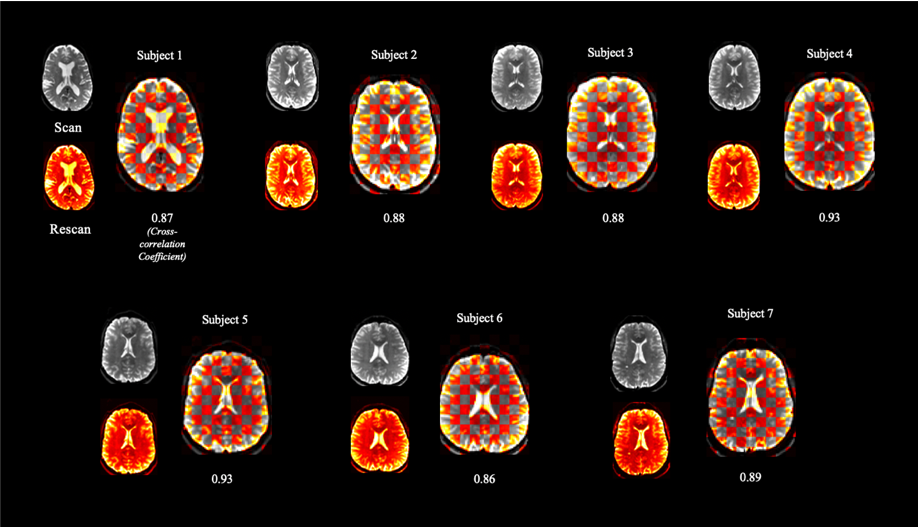
Figure 2. Assessment
of registration between scan and rescan in all individuals. For each
individual, checkerboard plots of averaged interleaved b=0 images are shown. Plots
were created by merging the individual images from scan (top) and rescan (bottom)
sessions.
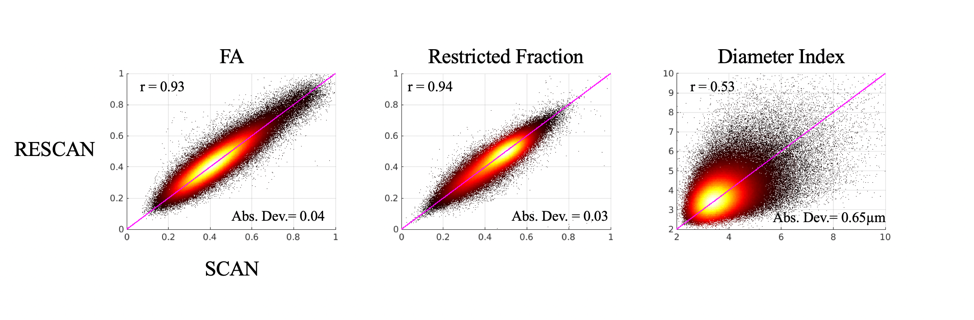
Figure 3. Scatterplot of voxel-wise
estimates of diffusion metrics between scan and rescan. The plots were
generated by pooling together all voxels across all subjects. Pearson’s
correlation coefficient (r) and absolute deviation (Abs.Dev.)
are labeled. The line of unity was marked in pink.
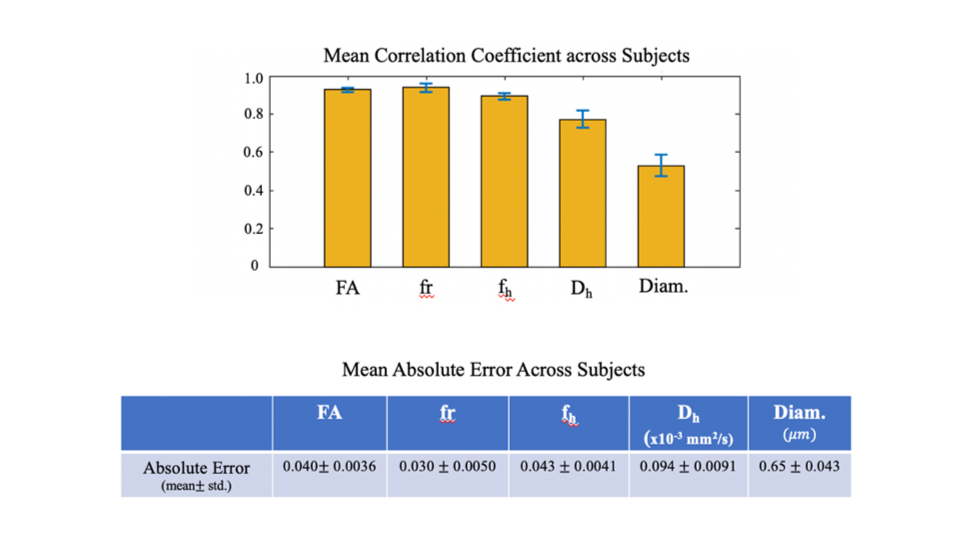
Figure 4 and Table 1.
Mean correlation coefficients and absolute errors across subjects. The
statistics were calculated within all white matter voxels per subject, and the
mean and standard deviation were calculated across all subjects.
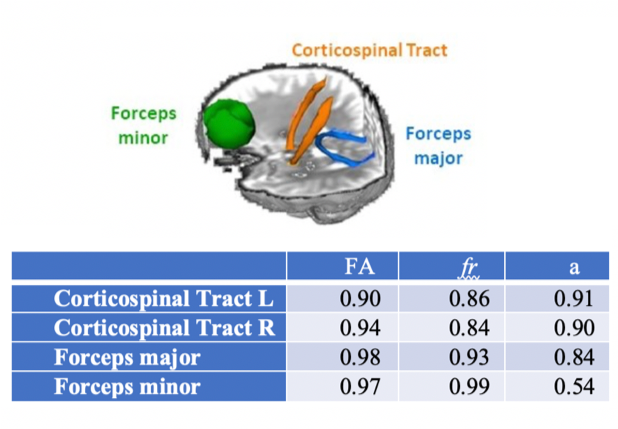
Table
2. Intraclass correlation coefficient (ICC) across all subjects for selected
tracts. Overall restricted volume fraction (fr) ICC values were high across
most tracts. ICC values for axon diameter were highest for the largest, well-defined
fiber bundles.