4455
Parcellation of the human brain cortex using a model free, sparse acquisition diffusion MRI approach («S-index»)1Department of System Neuroscience, National Institute for Physiological Sciences, Okazaki, Japan, 2Human Brain Research Center, Graduate School of Medicine, Kyoto University, Kyoto, Japan, 3NeuroSpin/Joliot, CEA-Saclay Center, Paris-Saclay University, Gif-sur-Yvette, France
Synopsis
We have used a model free diffusion MRI approach (S-index) to classify brain tissue types from the “proximity” or resemblance of their diffusion MRI signal profile at a sparse set of key b values (maximizing sensitivity to tissue microstructure) to a library of “signature” signal profiles (e.g. typical brain grey and white matter). 3D S-index maps have been generated and overlaid on a brain parcellation atlas from the Human Connectome Project showing differences among cortical brain areas.
Introduction
Diffusion MRI (dMRI) provides noninvasively information of tissue microstructure, especially non-Gaussian diffusion observable with high b values1. Models have been developed to analyze dMRI data2,3 and derive some average tissue features (e.g. NODDI3) but often require multiple images with a large range of b values and/or diffusion times, resulting in long acquisition times. Furthermore, a great number of tissue microscopic features are unknown and extremely variable, so that accurate modeling of tissues might be ill-posed and elusive. The “signature index”4 approach enables direct classification of tissue types from a calculated “distance” of the diffusion MRI signal profile of the tissue under consideration (obtained using a sparse set of key b values chosen for the higher sensitivity to underlying tissue microstructure) to a database of “signature” signal profiles acquired or simulated once for all. The distance is transformed to a quantitative, continuous value (S-index) which indicates how similar or different tissues are from the signature tissues. In this study, 3D S-index maps were overlaid on a brain parcellation template (The Human Connectome Project’s multi-modal cortical parcellation, version 1.0, HCP_MMP1.05) and compared with other HCP outputs, such as myelin maps.Methods
The study was carried out with a 7T MRI scanner (MAGNETOM 7T, Siemens Healthinners) using a 32-channel head RF coil. Data were first acquired on 3 subjects with 11 b values [0-4000 s/mm2] to establish typical signature decay signals (S = f(b)) for “typical” grey, SG, and “typical” white matter, SW, and to determine corresponding key b values from a set of differential equations4. dMRI data were then collected on 9 normal subjects with only those 2 key b values (Lb = 200 and Hb = 1800 s/mm2) with the following parameters: 64 directions, 1.2 x 1.2 x 2 mm3 voxels, band of 30 slices centered around the insula, TR/TE = 6000/91 ms, iPAT = 2, AP and PA phase encoding directions with 3 averages each. T1- and T2-weighted images were also acquired (MPRAGE for T1-weighted image: 0.8-mm isotropic voxels, 72 slices covering the whole brain, TR/TE = 2400/2.24 ms, TI = 1060 ms, iPAT = 2, FA = 8 deg; SPACE for T2-weighted image: 0.8-mm isotropic voxels, 72 slices covering the whole brain, TR/TE = 3200/560 ms, iPAT = 2, total turbo factor = 334, echo train length = 1156) for cortical surface reconstruction and myelin mapping with a 3T MRI scanner (MAGNETOM Trio, Siemens Healthinners) using a 32-channel head RF coil. After correction for geometric distortions, eddy currents, and head motion using the Diffusion Preprocessing pipeline (HCP Pipelines6), denoising and averaging, the S-index was calculated from the direction-averaged, normalized signals, SV(b) in each voxel at the key b values, as the algebraic distance between the vector made of these signals and those of the signature tissue signals for each key b value4,7:SI(V) = {max([dSV(Hb) - dSV(Lb)] / [dSW(Hb) - dSW(Lb)], 0) - [max(dSV(Hb) - dSV(Lb)] / [dSG(Hb) - dSG(Lb)], 0)}
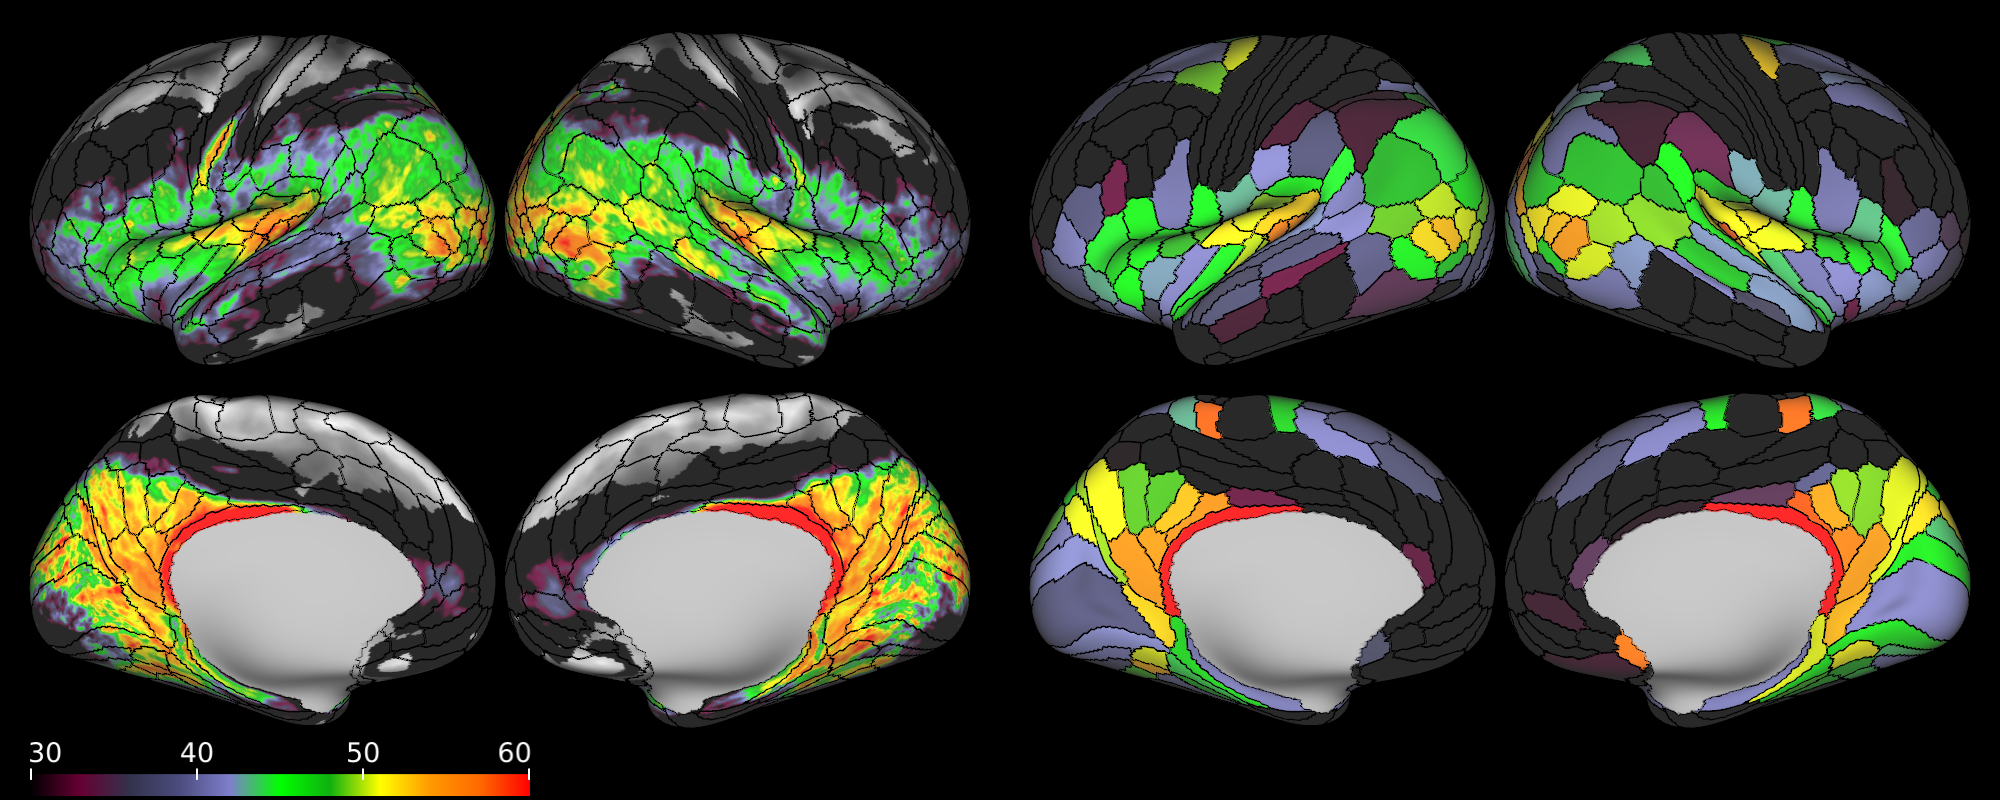
with dSV,W,G(b) = [SV,W,G(b) - SN(b)] / SN(b). SN is taken as an intermediate signal between SW and SG. SI was then further linearly scaled as Sindex = (SI + 1) * 25 + 25 to be centered around 50, so that S-index = 75 for our “typical” white matter tissue and S-index = 25 for our “typical” gray matter tissue. Color-encoded, 3D brain images were generated from voxel-by-voxel S-index obtained for each subject. After resampling each subject S-index maps to the brain cortical surface and registration to the MNI space, the multimodal surface matching algorithm8 was used to minimize inter-subject residual differences in location. Finally, group averaged 3D S-index cortical maps were calculated and overlaid on the HCP_MMP1.0 template.
Results
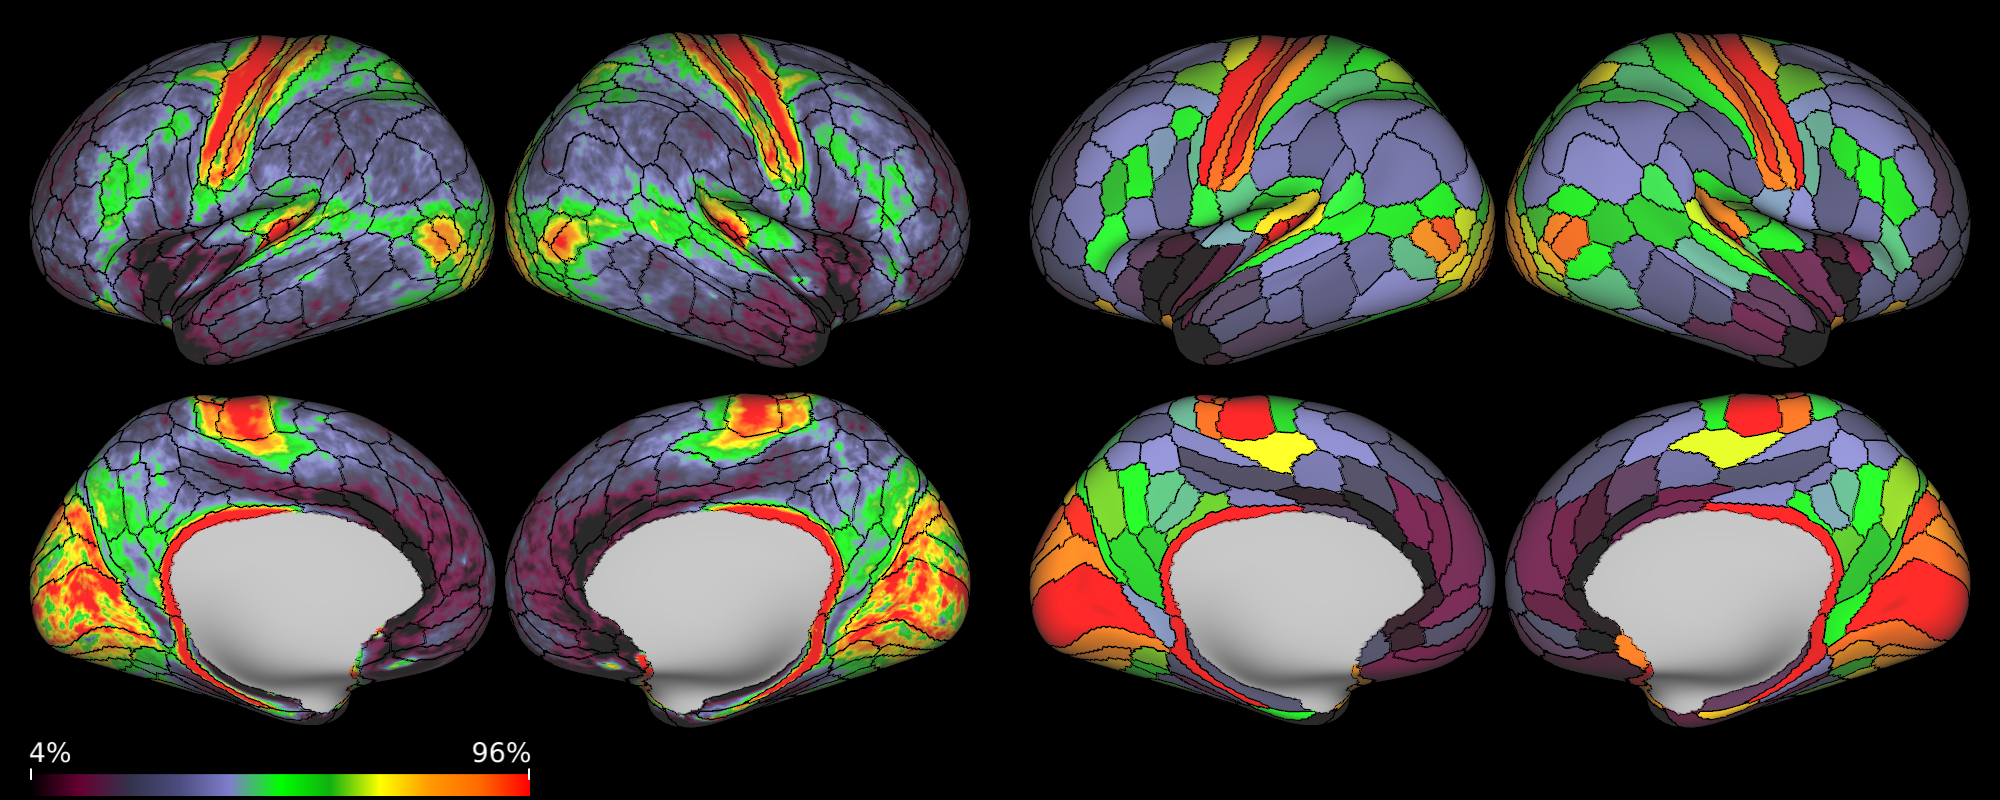
The group averaged S-index cortical maps and parceled maps are shown in Figure 1. Although the S-index maps were only obtained at mid-brain level they reveal striking differences along the brain cortical surface, especially within the insula and the occipital cortex. As the S-index is only a classifier, relationship with underlying tissue features remains to be investigated. However, comparison with the myelin maps (Figure 2) clearly indicates that myelin content is not the sole component responsible for the S-index contrast. For instance, the precuneus and the temporo-parieto-occipital junction exhibit relatively high S-index values, while they are not heavily myelinated (compare Figures 1 and 2). Moreover, dorsal visual areas posterior to the middle temporal complex are mapped as high S-index regions.Discussion and Conclusion
It is well known that the brain is a spatially very inhomogeneous organ. This new and simple S-index approach has the potential to generate in vivo maps reflecting cyto- and myeloarchitecture in the human brain without making assumptions about underlying tissue structure. Further work is obviously necessary, to link the nature of the S-index values with known tissue features, but one may envision that the S-index might reveal differences related to the functional areas along the cortical surface5, of interest to investigate the brain of patients with neurological or psychiatric disorders, potentially revealing possible alterations in local brain tissue microstructure.Acknowledgements
The study was partly supported by grants from AMED Brain/MINDS beyond (JP18dm0307005, JP19dm0307005), JSPS Grants-in-Aid for Scientific Research (KAKENHI; JP16H03305, JP19K22985).References
1. Le Bihan D. EMBO Mol Med. 2014; 6(5):569-73.
2. Assaf Y, et al. MRM. 2008; 59(6):1347-1354.
3. Zhang H et al. Neuroimage. 2012; 61(4):1000-1016.
4. Iima M, Le Bihan D. Radiology. 2016; 278(1):13-32.
5. Glasser MF, et al. Nature. 2016; 536:171-178.
6. Glasser MF, et al. Neuroimage. 2013; 80:105-124.
7. Pérès EA, et al. Int J Radiat Oncol Biol Phys. 2018; pii:S0360-3016(18)30184-6.
8. Robinson EC, et al. Neuroimage. 2017. 167:453-465.
Figures