4453
Imaging meningioma tumor microstructure: a comparison between quantitative histopathology and high-resolution diffusion tensor imaging1Clinical Sciences Lund, Medical Radiation Physics, Lund University, Lund, Sweden, 2Department of Radiology, Brigham and Women's Hospital, Boston, MA, United States, 3Harvard Medical School, Boston, MA, United States, 4Clinical Sciences Lund, Diagnostic Radiology, Lund University, Lund, Sweden, 5Clinical Sciences, Oncology and Pathology, Lund University, Lund, Sweden, 6Clinical Sciences, Neurosurgery, Lund University, Lund, Sweden, 7Russell H. Morgan Department of Radiology and Radiological Science, Johns Hopkins University School of Medicine, Baltimore, MD, United States, 8Lund University Bioimaging Center, Lund University, Lund, Sweden
Synopsis
We explore anisotropy of meningioma tumors by using structure tensor analysis of histological images and high-resolution diffusion MRI scans. We observed a good visual agreement between the structure- and diffusion-based anisotropy measures, but a more modest quantitative agreement. The results highlight the need to image microscopic rather than voxel-level fractional anisotropy in meningioma tumors.
Introduction
Meningiomas are tumors that stem from the membranes of the brain and spinal cord and diffusion MRI (dMRI) is the primary modality for obtaining information on tumor microstructure non-invasively. Previous studies with dMRI have shown conflicting results regarding the ability to distinguish meningioma subtypes and consistency, although anisotropy measured from diffusion tensor imaging (DTI) appears to be more predictive than the apparent diffusion coefficient alone [1-3]. One potential source for errors is the difference between microscopic and macroscopic (voxel-level) anisotropy, with the latter being lower than the former in the presence of orientation dispersion [4]. This has been shown to be important in meningiomas, which tend to have high microscopic anisotropy but low voxel-level anisotropy [4]. In this study, we examined the microscopic anisotropy in detail by comparing the structure anisotropy derived from histological examinations with diffusional anisotropy from high-resolution DTI of tumor specimen performed at a preclinical MR system.Methods
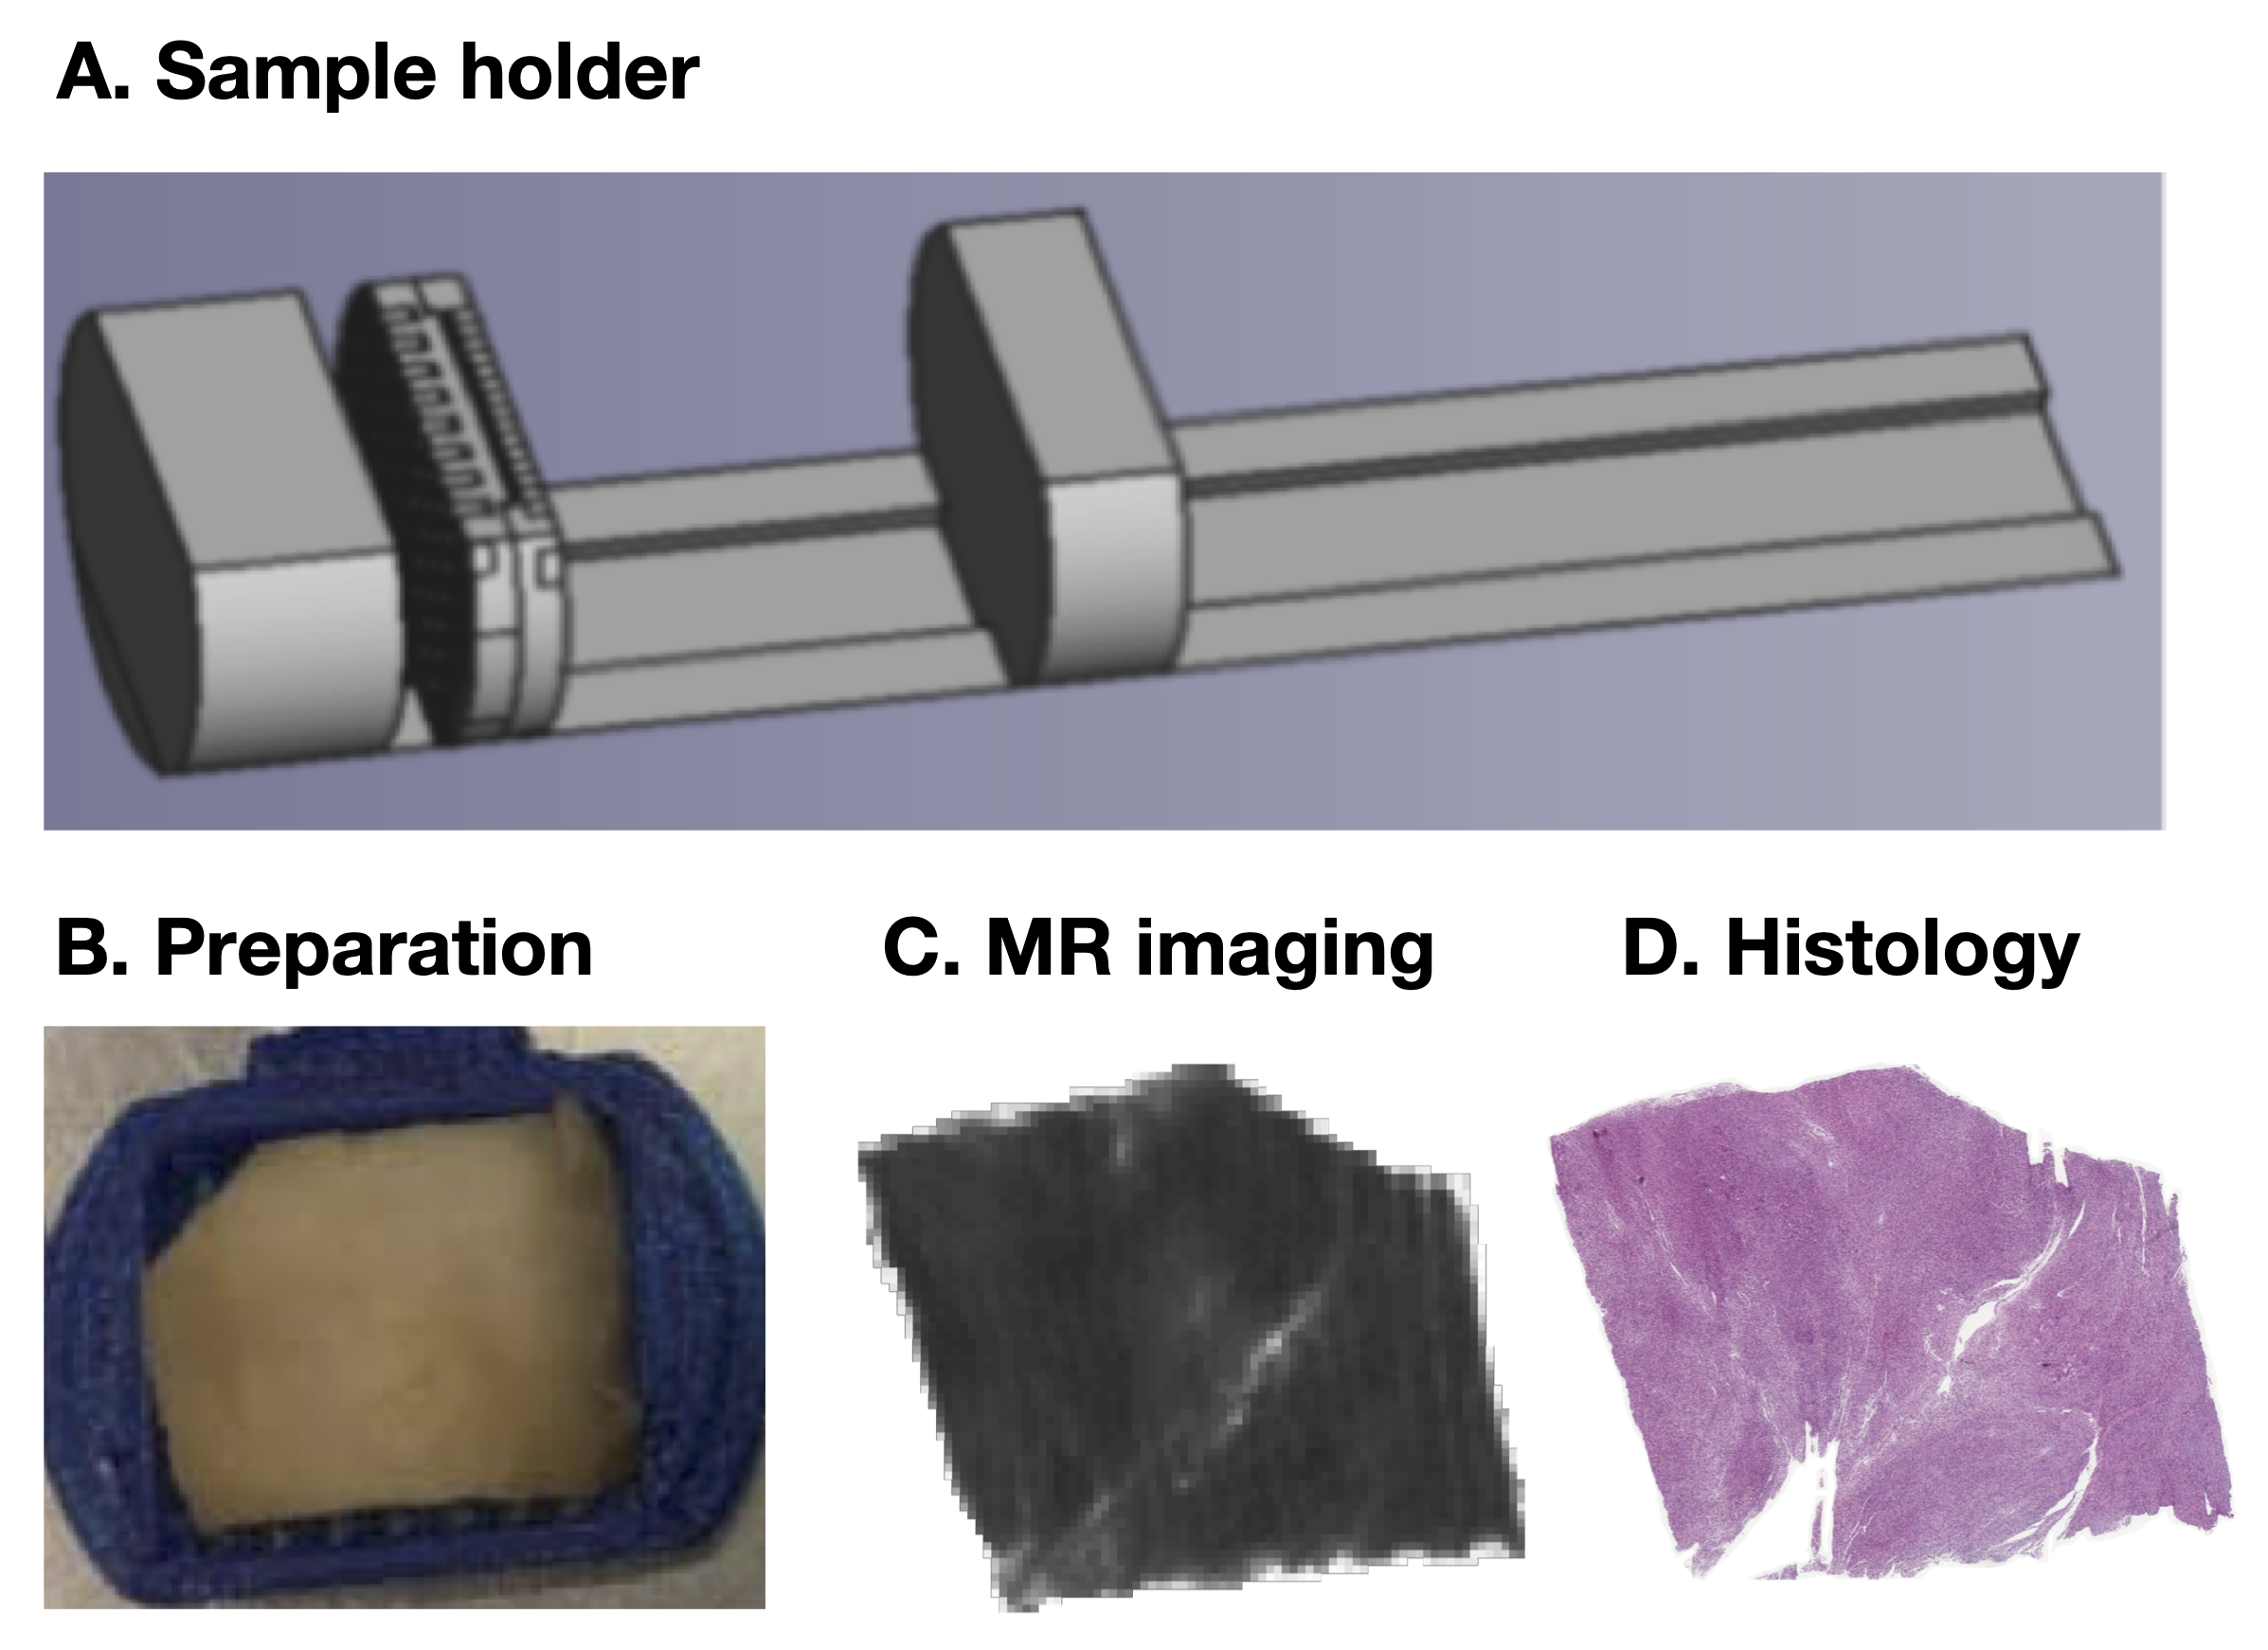
Figure 1 shows an overview of the data acquisition steps. In total, 16 tumor samples were obtained after neurosurgical excision. The tissue was embedded in paraffin and sliced into blocks of approximately 35x20x2 mm3 to fit a 3D printed mold and scanned at a Bruker 9.4 T BioSpec Avance III scanner. Diffusion tensor imaging (DTI) was performed with TR=2.5 s, TE=30 ms, slices=41, averages=10, FOV=200×200 μm2, and with b-values for each direction 100, 1000 and 3000 s/mm2. DTI analysis was performed using the diffusion software package available at https://github.com/markus-nilsson/md-dmri to extract maps of the fractional anisotropy (FA), mean diffusivity (MD), and directionally encoded color maps [6]. In addition, the in-plane fractional anisotropy (FAIP) was calculated by utilizing only the in-plane eigenvalues of the diffusion tensor. The histological images were stained with a H&E and scanned at the resolution of 0.5 µm. These were processed with structure tensor analysis, which provided measures of the image anisotropy (IA) [5]. The IA maps were downsampled to the resolution of the MR images, after which the FAIP maps were coregistered by a in-house non-linear registration tool and compared both visually and quantitatively.Results
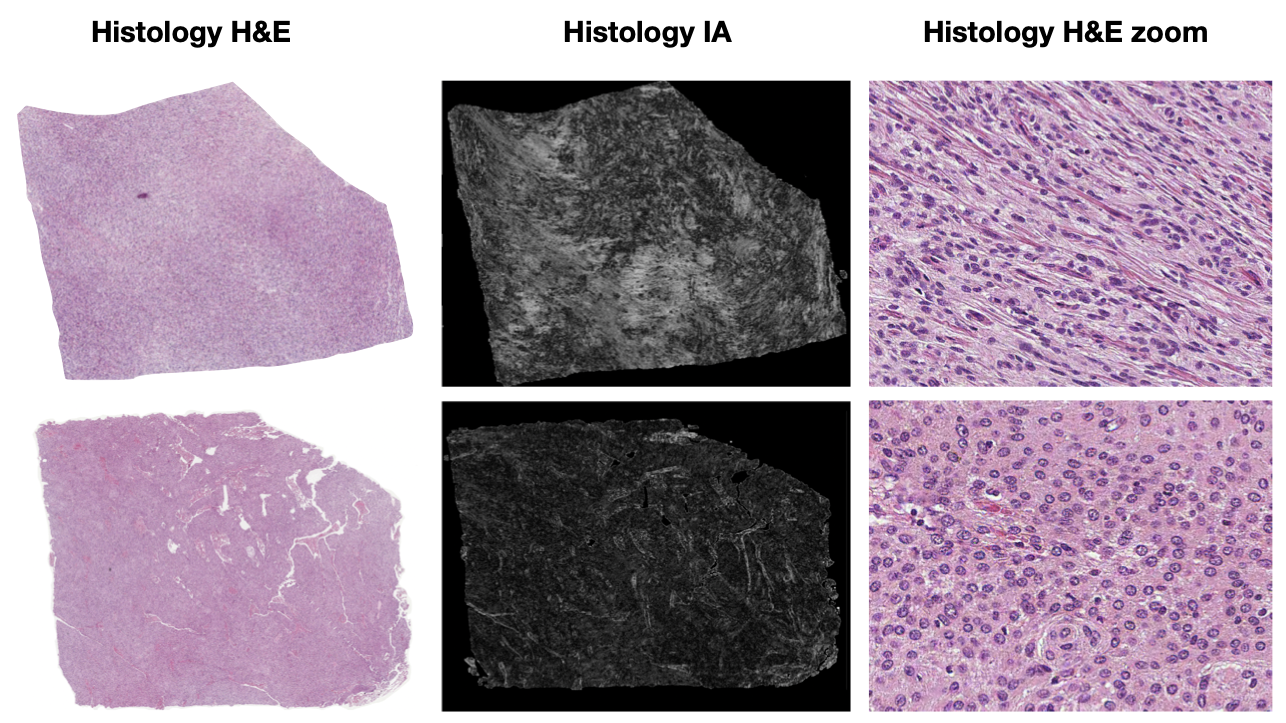
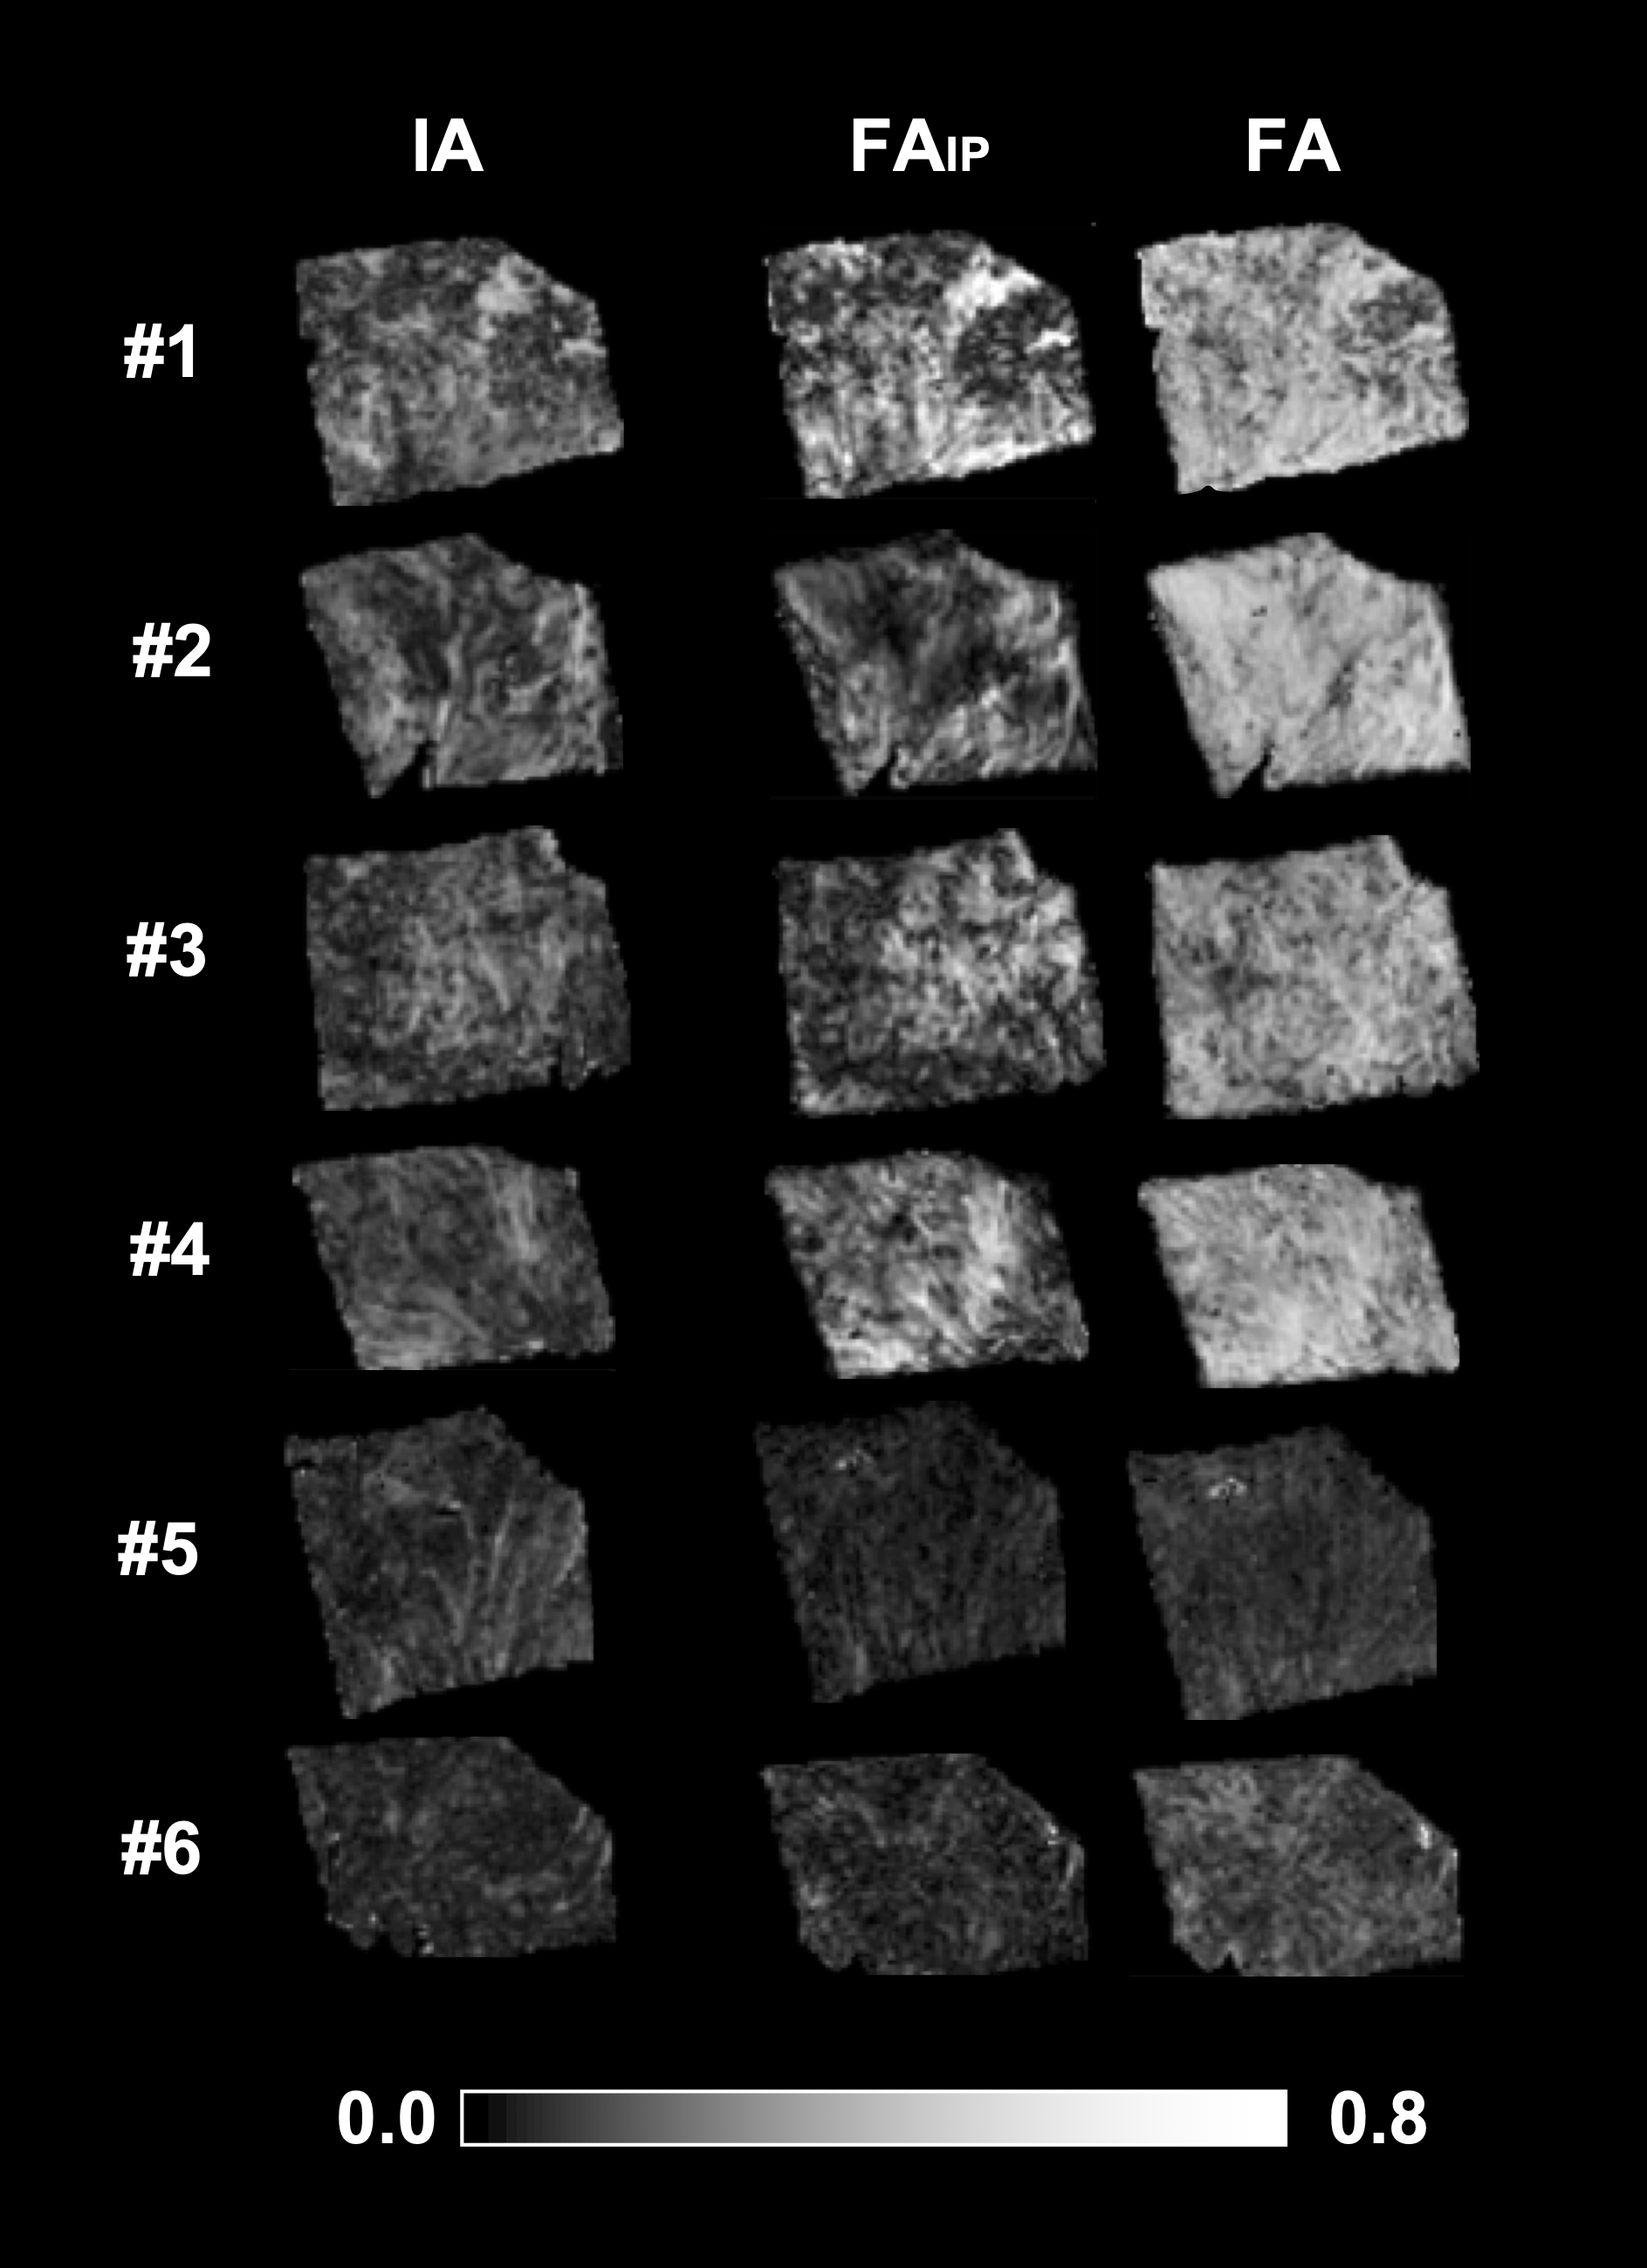
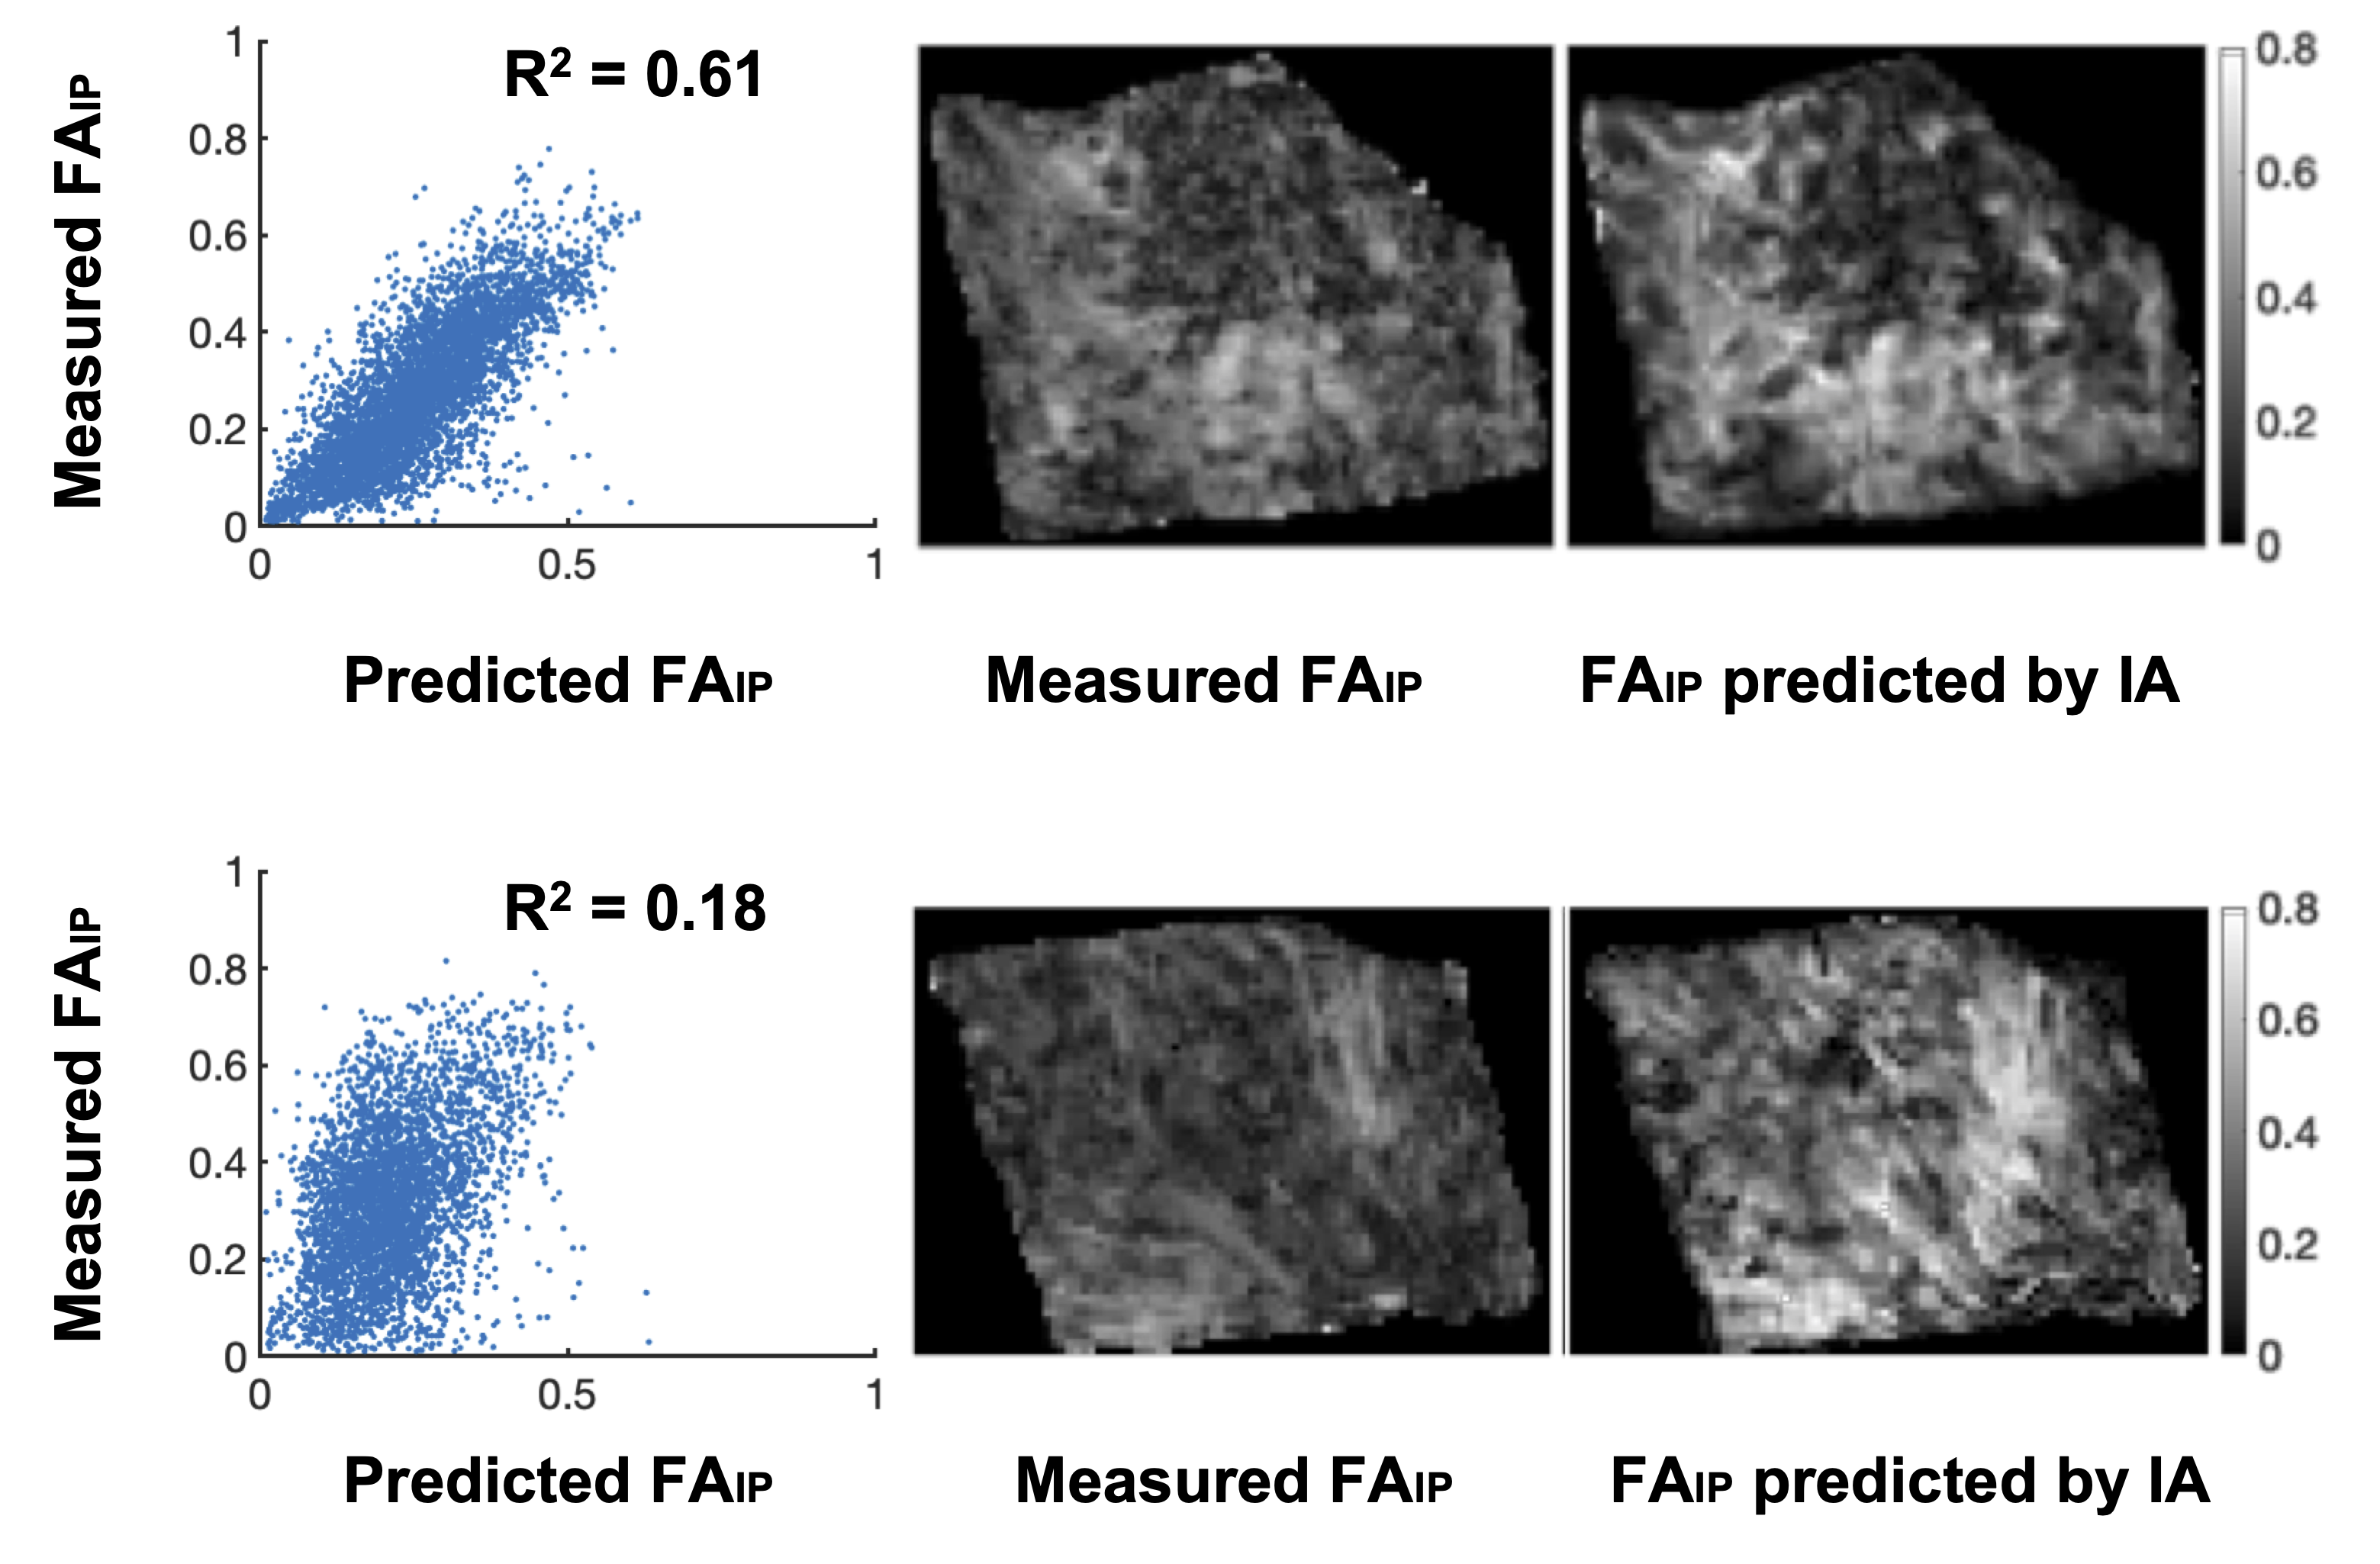
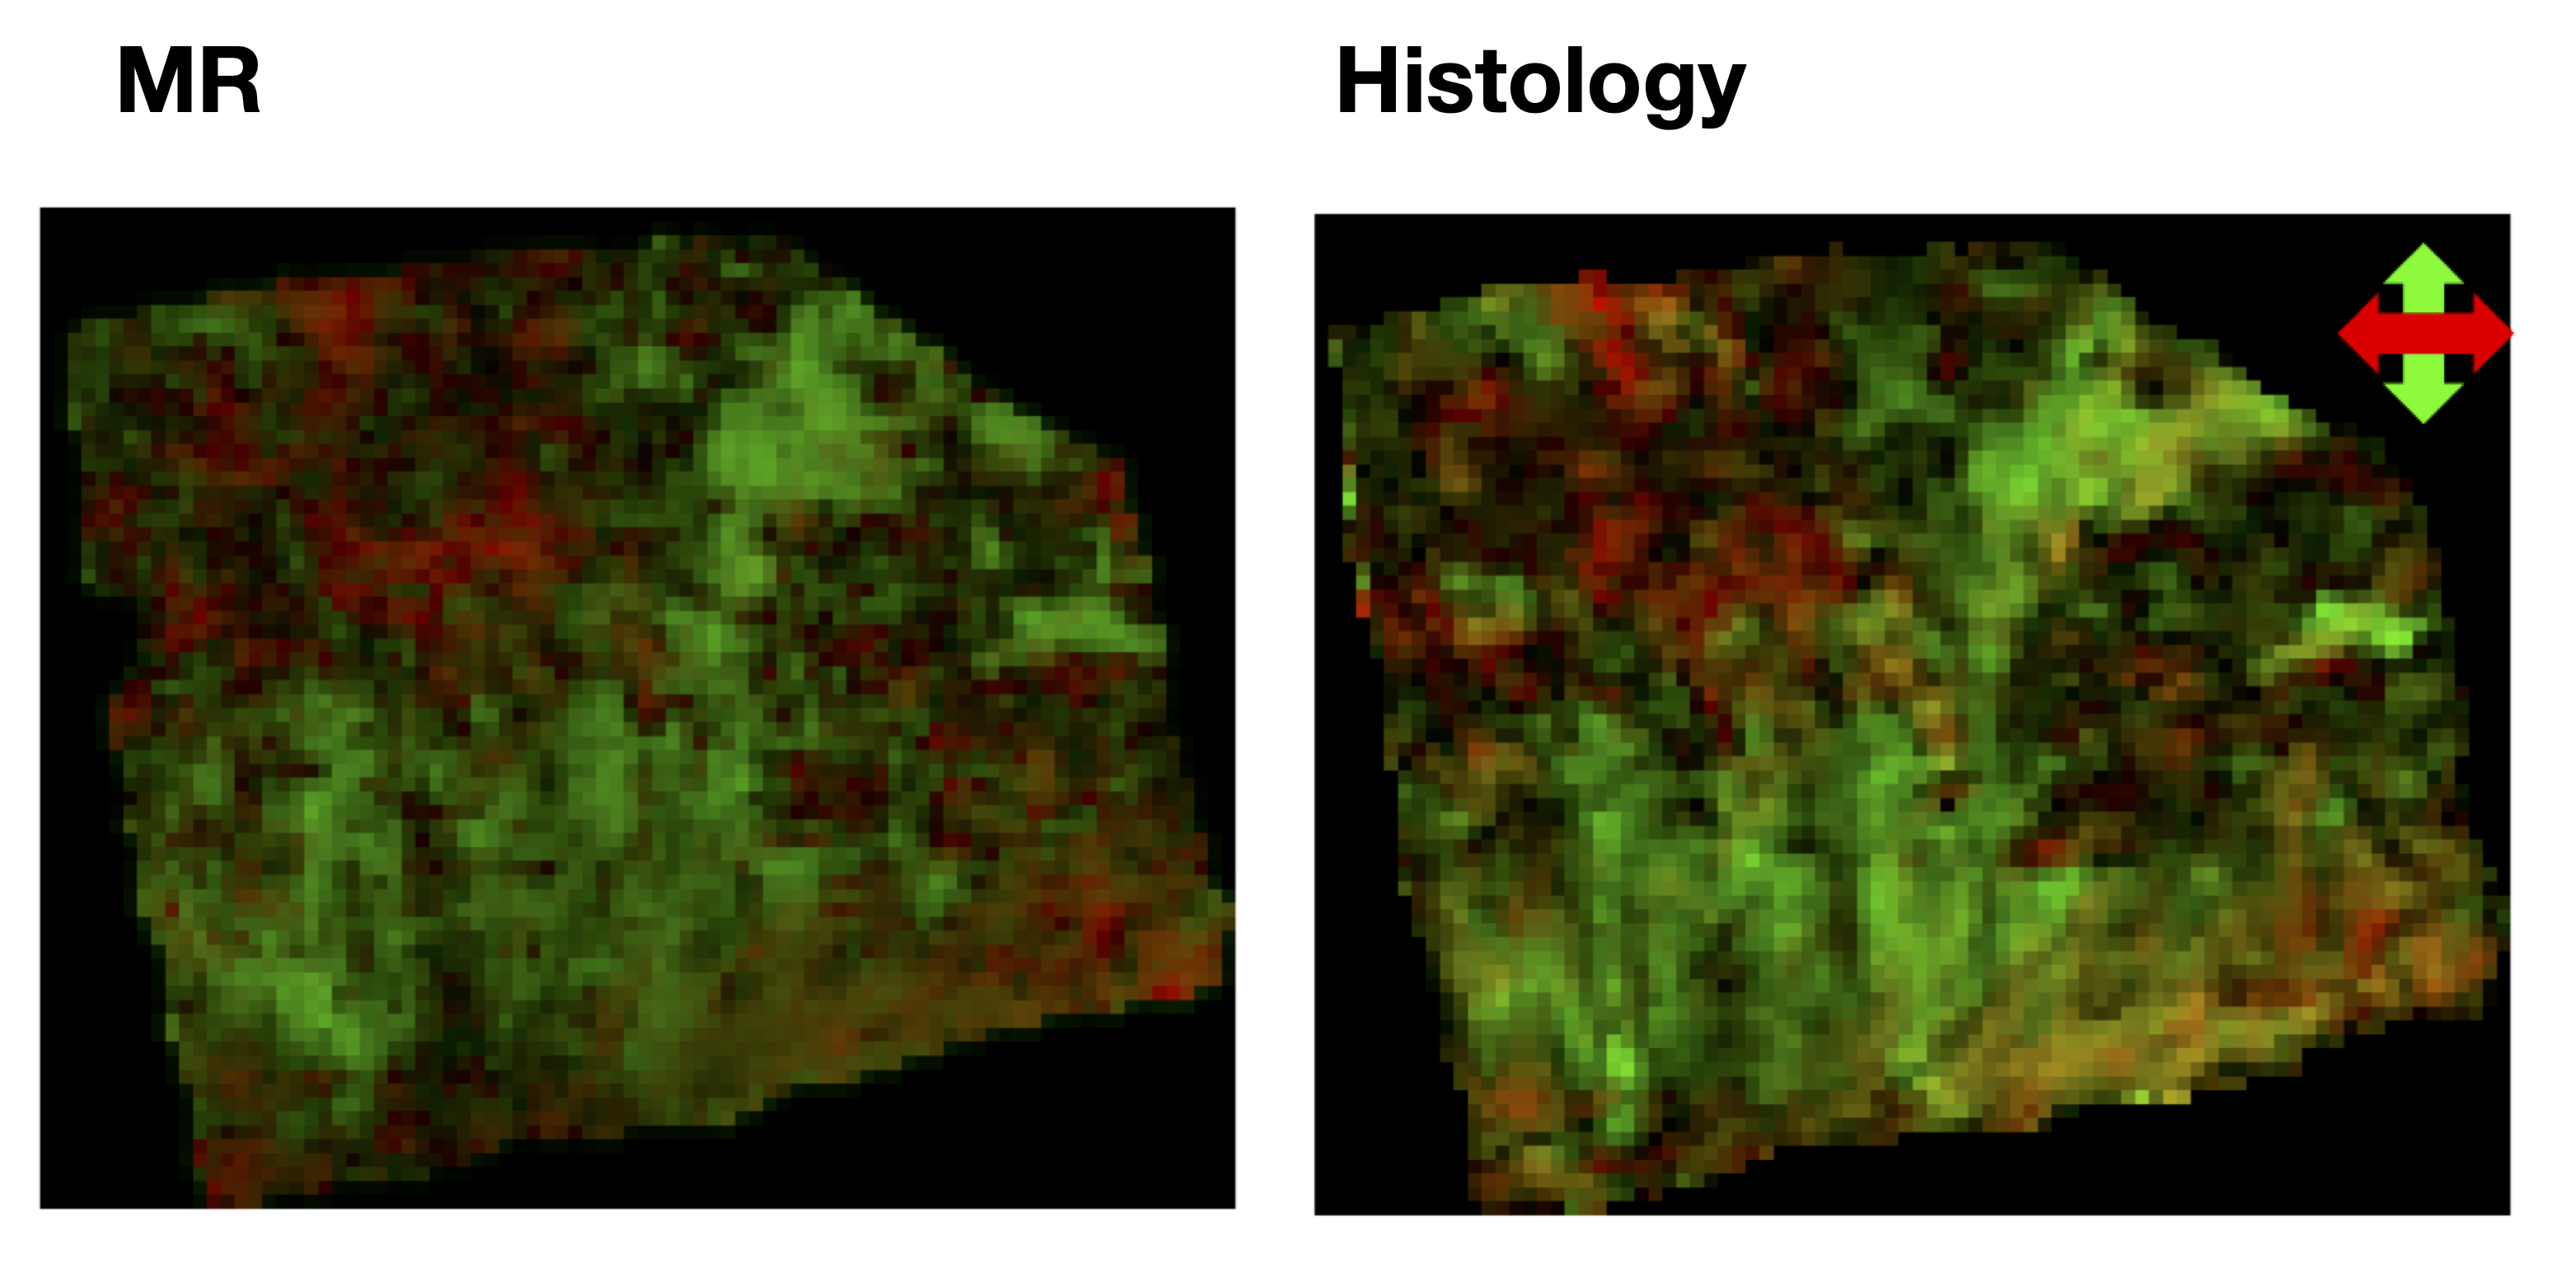
Figure 2 shows two histology specimen that, although they appear to be similar on the overview H&E stain, differ in their corresponding computed image anisotropy maps. Figure 3 shows an overview of IA maps, downsampled to the resolution of the diffusion experiment (200 µm) and compared with corresponding maps of the FA and FAIP from DTI. Overall, the histology and diffusion based anisotropy maps were visually similar, with the best similarity being found between IA and FAIP. A quantitative analysis showed that R2 varied from 0.1 to 0.6 with a median of 0.2. Figure 4 shows the best example and an example that shows worse result.Discussion
Diffusion tensor imaging at high resolution revealed a diffusion anisotropy in overall good visual agreement with the image anisotropy obtained from histology. However, the quantitative agreement was high only in samples with strong overall anisotropy. Future work will incorporate digital stains other than the image anisotropy in order to better understand what microstructure features that can best explain variations in the fractional anisotropy as well as in the mean diffusivity. We plan to openly release the imaging data.Acknowledgements
Michael Gottschalk, René In 'T Zandt and Lund University Bioimaging Center (LBIC), Lund University are gratefully acknowledged for providing experimental resources.References
[1] Jolapara, M., et al. "Role of diffusion tensor imaging in differentiating subtypes of meningiomas." Journal of Neuroradiology 37.5 (2010): 277-283.
[2] Toh, C-H., et al. "Differentiation between classic and atypical meningiomas with use of diffusion tensor imaging." American Journal of Neuroradiology 29.9 (2008): 1630-1635.
[3] Zikou, Anastasia, et al. "The role of diffusion tensor imaging and dynamic susceptibility perfusion MRI in the evaluation of meningioma grade and subtype." Clinical neurology and neurosurgery 146 (2016): 109-115.
[4] Szczepankiewicz, Filip, et al. "The link between diffusion MRI and tumor heterogeneity: Mapping cell eccentricity and density by diffusional variance decomposition (DIVIDE)." NeuroImage 142 (2016): 522-532.
[5] Budde, Matthew D., and Joseph A. Frank. "Examining brain microstructure using structure tensor analysis of histological sections." Neuroimage 63.1 (2012): 1-10.
[6] Nilsson, Markus, et al. "An open-source framework for analysis of multidimensional diffusion MRI data implemented in MATLAB." Proc Intl Soc Mag Reson Med. Vol. 26. 2018.
Figures