4451
Time-dependent diffusion in healthy human calf muscle in a clinically feasible acquisition time1GOS UCL Institute of Child Health, London, United Kingdom, 2Medical Radiation Physics, National Physical Laboratory, London, United Kingdom, 3Siemens Healthcare GmbH, Erlangen, Germany
Synopsis
Muscle fibres have a complex hierarchical internal structure which leads to a marked decrease in the observed MR diffusion coefficient with diffusion time. We expect the form of this diffusion time dependence to be highly sensitive to changes in this internal structure. However, characterising the diffusion time dependence in tissue can be highly demanding of total acquisition time. We examine the time-dependence of diffusion indices in human calf muscle in healthy volunteers in a clinically feasible scan time. We find significant time dependence and diffusion restriction in all directions, including longitudinally, due to the internal structure of muscle fibres.
Introduction
Muscle fibres are much larger than white matter axons, a more common area of application of diffusion imaging, and have a complex hierarchical internal structure1. This is unlike axons which are usually modelled as empty cylinders. The presence of a hierarchical structure in muscle leads to a marked decrease in the observed diffusion coefficient with diffusion time, which has been demonstrated in mice2. From previous investigations3, we expect the form of this diffusion time dependence to be highly sensitive to changes in this internal structure and therefore a good candidate for a probe of microstructural change due to the action of pathology. However, characterising the diffusion time dependence in tissue can be highly demanding for total acquisition time. Using a highly optimised diffusion acquisition protocol, we examine the time-dependence D(t) of diffusion indices in human calf muscle in healthy volunteers in a clinically feasible scan time.Methods
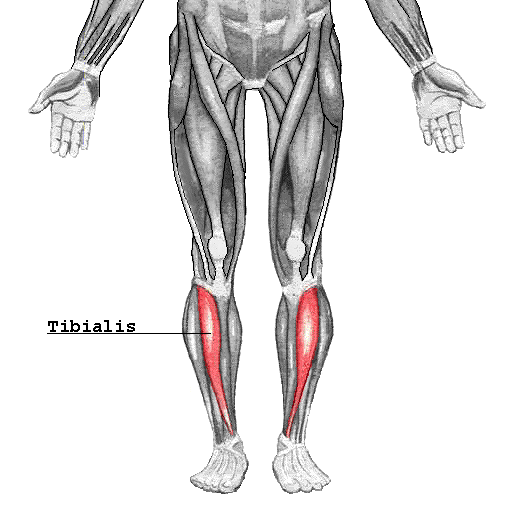
Five volunteers were imaged on a 3T MAGNETOM Prisma scanner (Siemens Healthcare, Erlangen, Germany) using a 15-channel knee coil. Volunteers were positioned with their right calf in the centre of the coil. Diffusion data were acquired with a prototype sequence using echo-planar imaging and a stimulated-echo (STEAM) preparation with pulse duration (δ) 10ms at 5 different diffusion times (Δ) of 70, 130, 190, 250, 330ms each acquiring 6 directions (orthogonal x, y, and z and diagonal xy, xz, and yz) at b-values of 0, 200, 400, 600, and 800 s/mm2. Acquisition time per Δ value was 7:03 mins with a total acquisition time of 35:15mins. Voxel size was 2x2 mm2 with a slice thickness of 3 mm, and a TE and TR of 50ms and 2800ms, respectively, with Spectral Attenuated Inversion Recovery (SPAIR) fat suppression. Data were pre-processed using Tractor [http://www tractor-mri.org.uk/] and tensor fitting was performed at each diffusion time using FSL [https://fsl.fmrib.ox.ac.uk/fsl/fslwiki/] using a weighted least-squares fit. Regions of interest in the tibialis anterior (Figure 1) were drawn on the MD images reconstructed at the shortest diffusion time. MD, FA and principle eigenvectors were analysed in each voxel of interest. Angular dispersion of eigenvectors was calculated relative to the spherical mean of all directions in the ROI using the dot product. Statistical analysis was performed using two-tailed unpaired t-tests. A two-point Dixon sequence (TE 73ms, TR 3500ms, voxel size 0.36x0.36mm2 with slice thickness of 3mm) was also acquired to provide anatomical images.Results
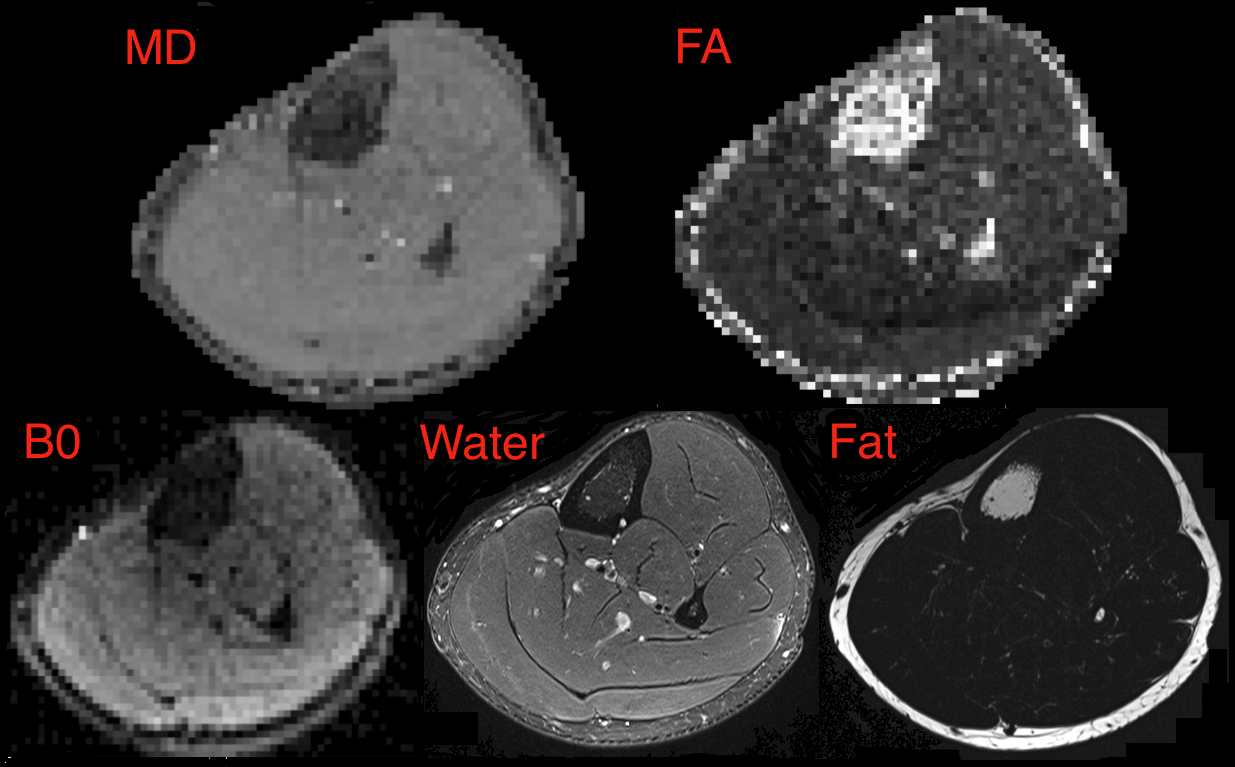
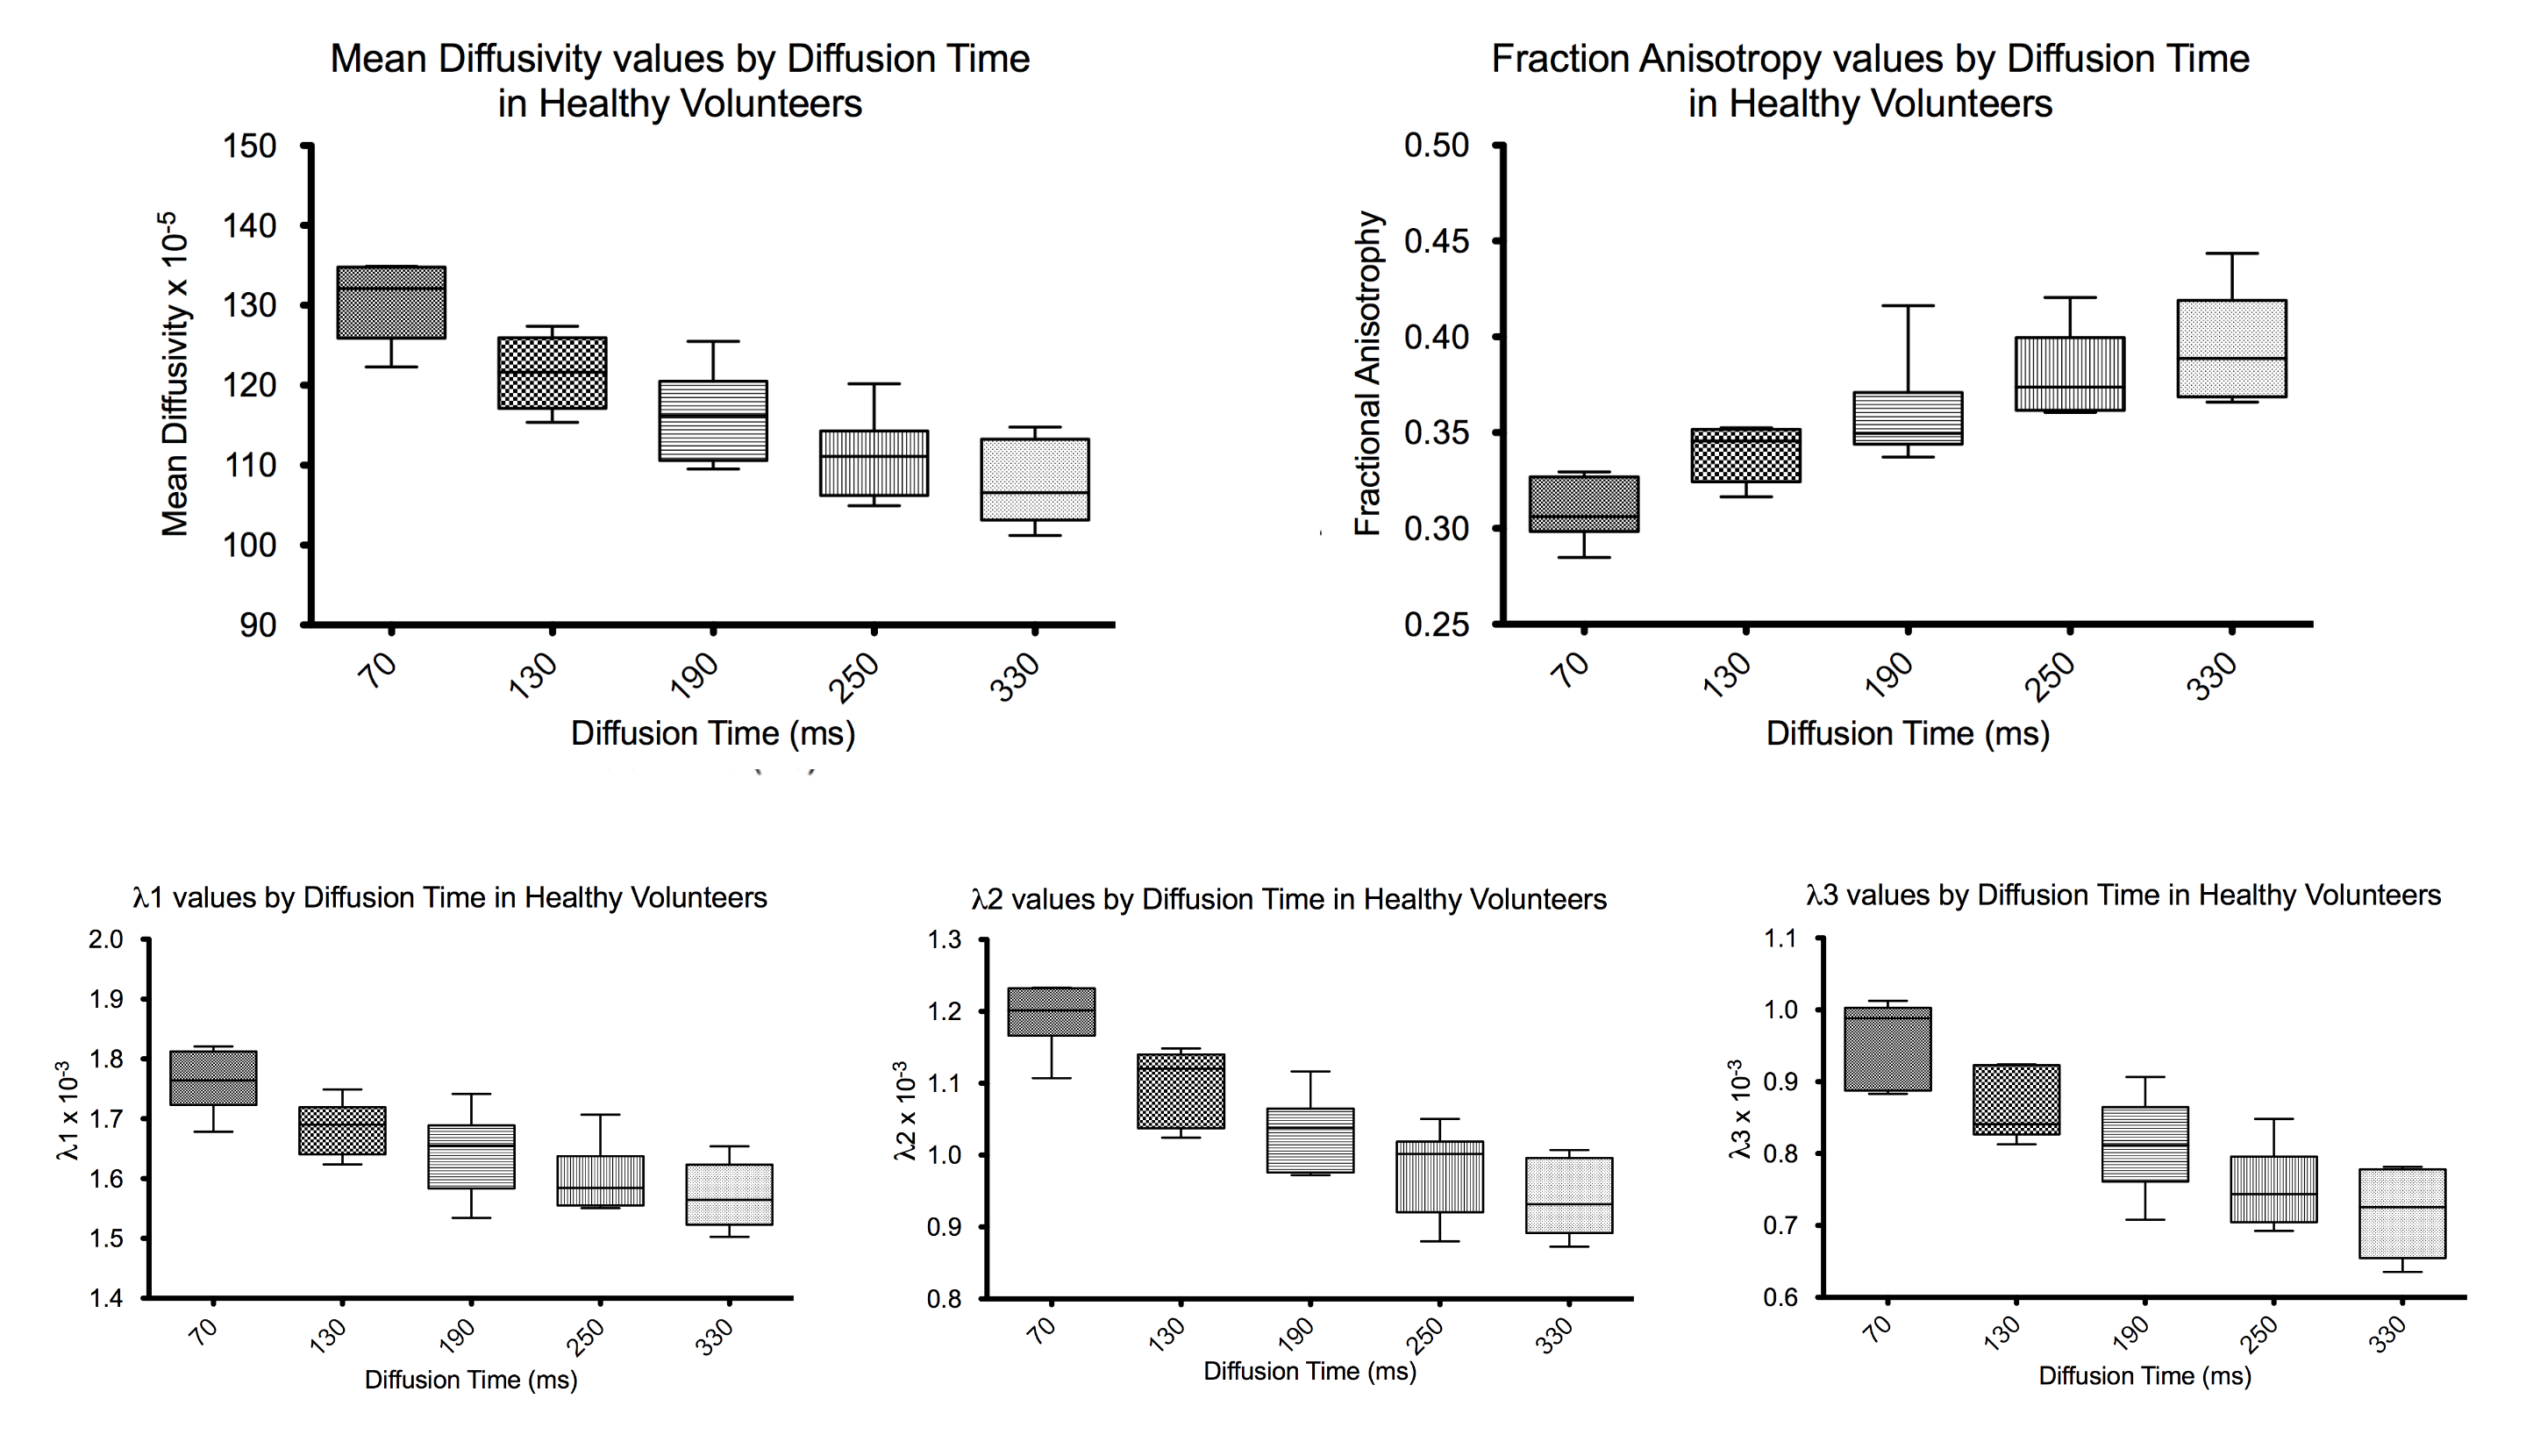
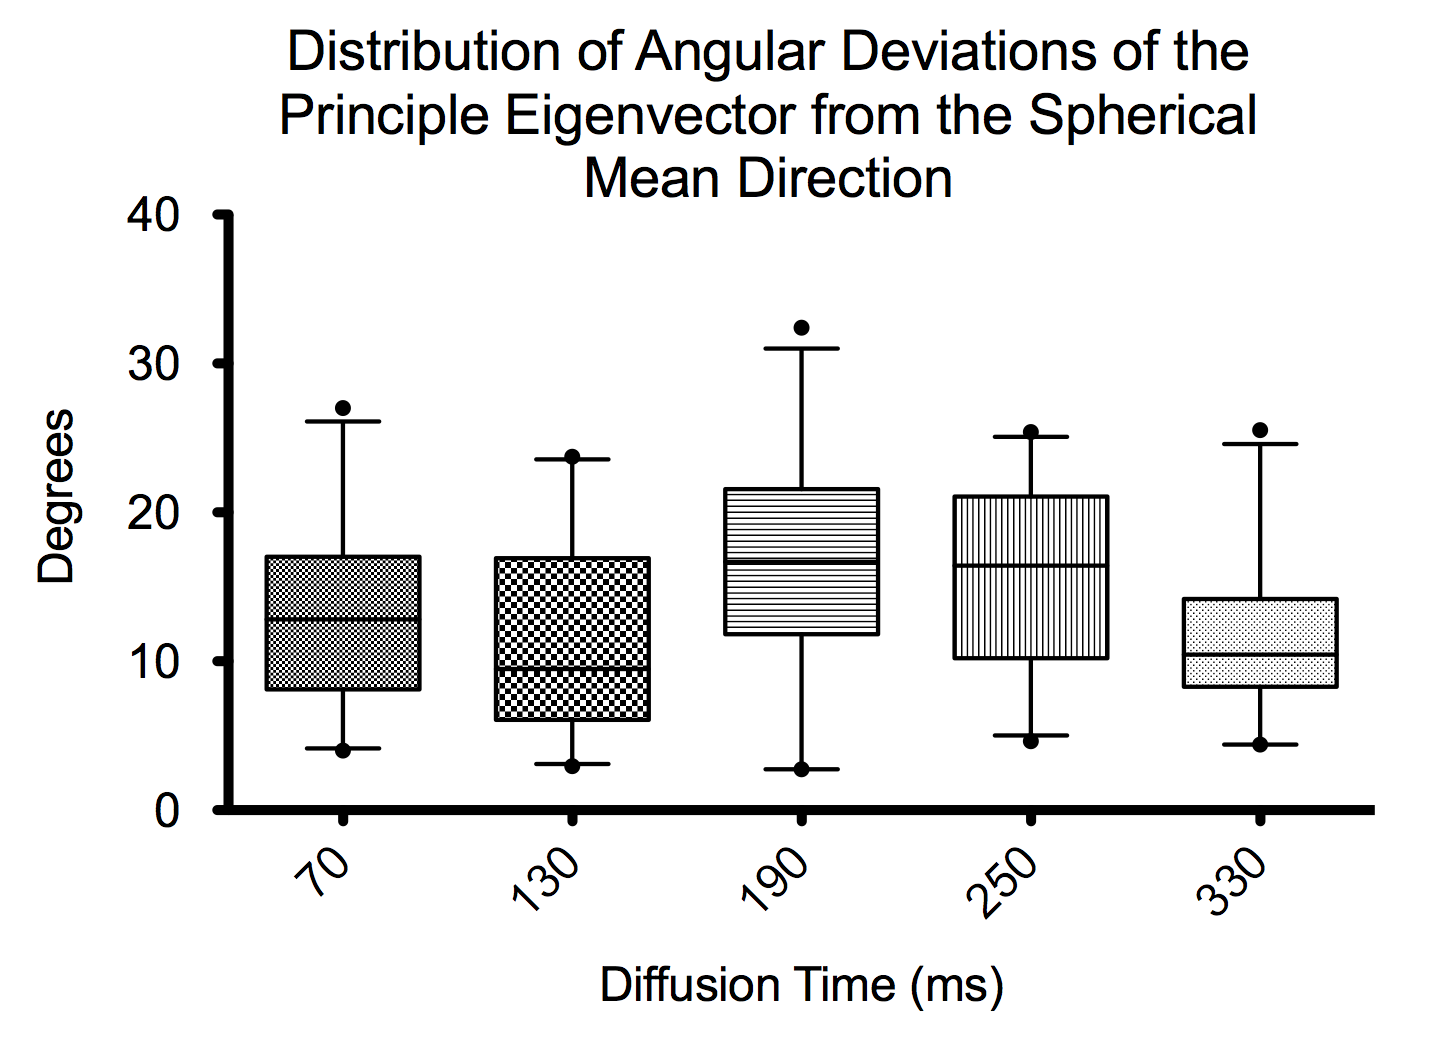
Example fat, water, B0, MD and FA images from one volunteer are shown in Figure 2. The B0 image shows good delineation of the muscle groups with acceptable distortion, though incomplete fat suppression. Quantitative results are shown in Figure 3. The mean MD decreases from 130.5 x 10⁻⁵mm2/s at Δ=70ms to 107.6 x 10⁻⁵mm2/s at Δ=330 ms. Mean FA increases from 0.31 at Δ=70 ms to 0.40 at Δ=330ms. Significance between the minimum and maximum diffusion times was P<0.0001 for MD and P<0.0004 for FA. Angular dispersion of eigenvectors was calculated relative to the spherical mean of all directions in the ROI using the dot product and is shown in Figure 4. We observe a mean angular deviation of 13.3 degrees (standard deviation (SD) 6.31 degrees) at Δ=70 ms and of 12.32 degrees (SD 5.34 degrees) at Δ=330 ms. There was no significant difference in angular dispersion between these two diffusion times (P=0.62).Discussion/Conclusion
We have acquired time-dependent diffusion in muscle in a clinically feasible scan time. Mean diffusivity shows a strong time dependence, decreasing with diffusion time, which is in agreement with the results found by Porcari et al2 in mice. Results show restriction in all three directions, including longitudinally which is due to the hierarchical internal structure of muscle fibres. Fractional anisotropy also shows a distinct increase with diffusion time, which follows from the differing rates of reduction in λ1, λ2, and λ3.We expect this protocol to be a useful marker of microstructural change and pathology in such diseases as muscular dystrophy which can affect size, packing fraction and permeability of muscle fibres.
Acknowledgements
MGH and AM are supported in part by a grant from Great Ormond St Hospital’s Biomedical Research Centre. AM is also supported by a grant from theNational Physical Laboratory.References
1. Feher J. Contractile Mechanisms in Skeletal Muscle. 2nd Edition Elsevier; 2017.
2. Porcari P, Hall MG, Clark CA, Greally E, Straub V, Blamire AM. The effects of ageing on mouse muscle microstructure: a comparative study of time-dependent diffusion MRI and histological assessment. NMR in biomedicine 2018; 31(3).
3. Marschar AM, Kuder TA, Stieltjes B, Nagel AM, Bachert P, Laun FB. In vivo imaging of the time-dependent apparent diffusional kurtosis in the human calf muscle. Journal of magnetic resonance imaging : JMRI 2015; 41(6): 1581-90.
Figures