4450
Automated segmentation of human axon and myelin from electron microscopy data using deep learning for microstructural validation and simulation1Martinos Center for Biomedical Imaging, Massachusetts General Hospital, Charlestown, MA, United States, 2Department of Radiology, Harvard Medical School, Boston, MA, United States, 3Department of Radiology, Center for Biomedical Imaging, New York University School of Medicine, New York, NY, United States, 4Center for Advanced Imaging Innovation and Research (CAI2R), New York University School of Medicine, New York, NY, United States, 5Department of Molecular and Cellular Biology, Harvard University, Cambridge, MA, United States
Synopsis
Diffusion microstructural metrics represent inferences of axonal size and morphology rather than directly imaged quantities, validation of these metrics is essential. With novelty of multibeam-serial electron microscopy, high-resolution images of human white matter can be acquired at nanometer resolution over volumes of tissue large enough to capture the diffusion-MRI dynamics extending over length scales comparable to MRI voxel size. This work presents automated segmentation of serial EM of a sub-volume of human white matter using a 3D convolutional neural network studying variations in axonal diameter over the longest axons within the volume of tissue.
Introduction
Diffusion MRI offers a noninvasive probe of tissue microstructural properties such as axonal size, shape and dispersion. As diffusion microstructural metrics represent inferences of axonal size and morphology rather than directly imaged quantities, validation of these metrics is essential. With the development of multibeam serial electron microscopy1, high-resolution images of human white matter now can be acquired at nanometer resolution over volumes of tissue large enough to capture the diffusion MRI dynamics extending over length scales comparable to the MRI voxel size (~mm). Here, we segmented myelinated axons and intra-axonal space in a sub-volume of human white matter measuring up to ~100-200 um in length using supervised deep learning with 3D convolutional neural networks (CNNs) and transfer learning. The goal was to estimate histology-based axonal measures in human white matter, including inner and outer diameters and the myelin g-ratio, that would serve as ground-truth validation of axonal structure and geometry and aid in the interpretation of biophysical parameters estimated by diffusion MRI.Methods
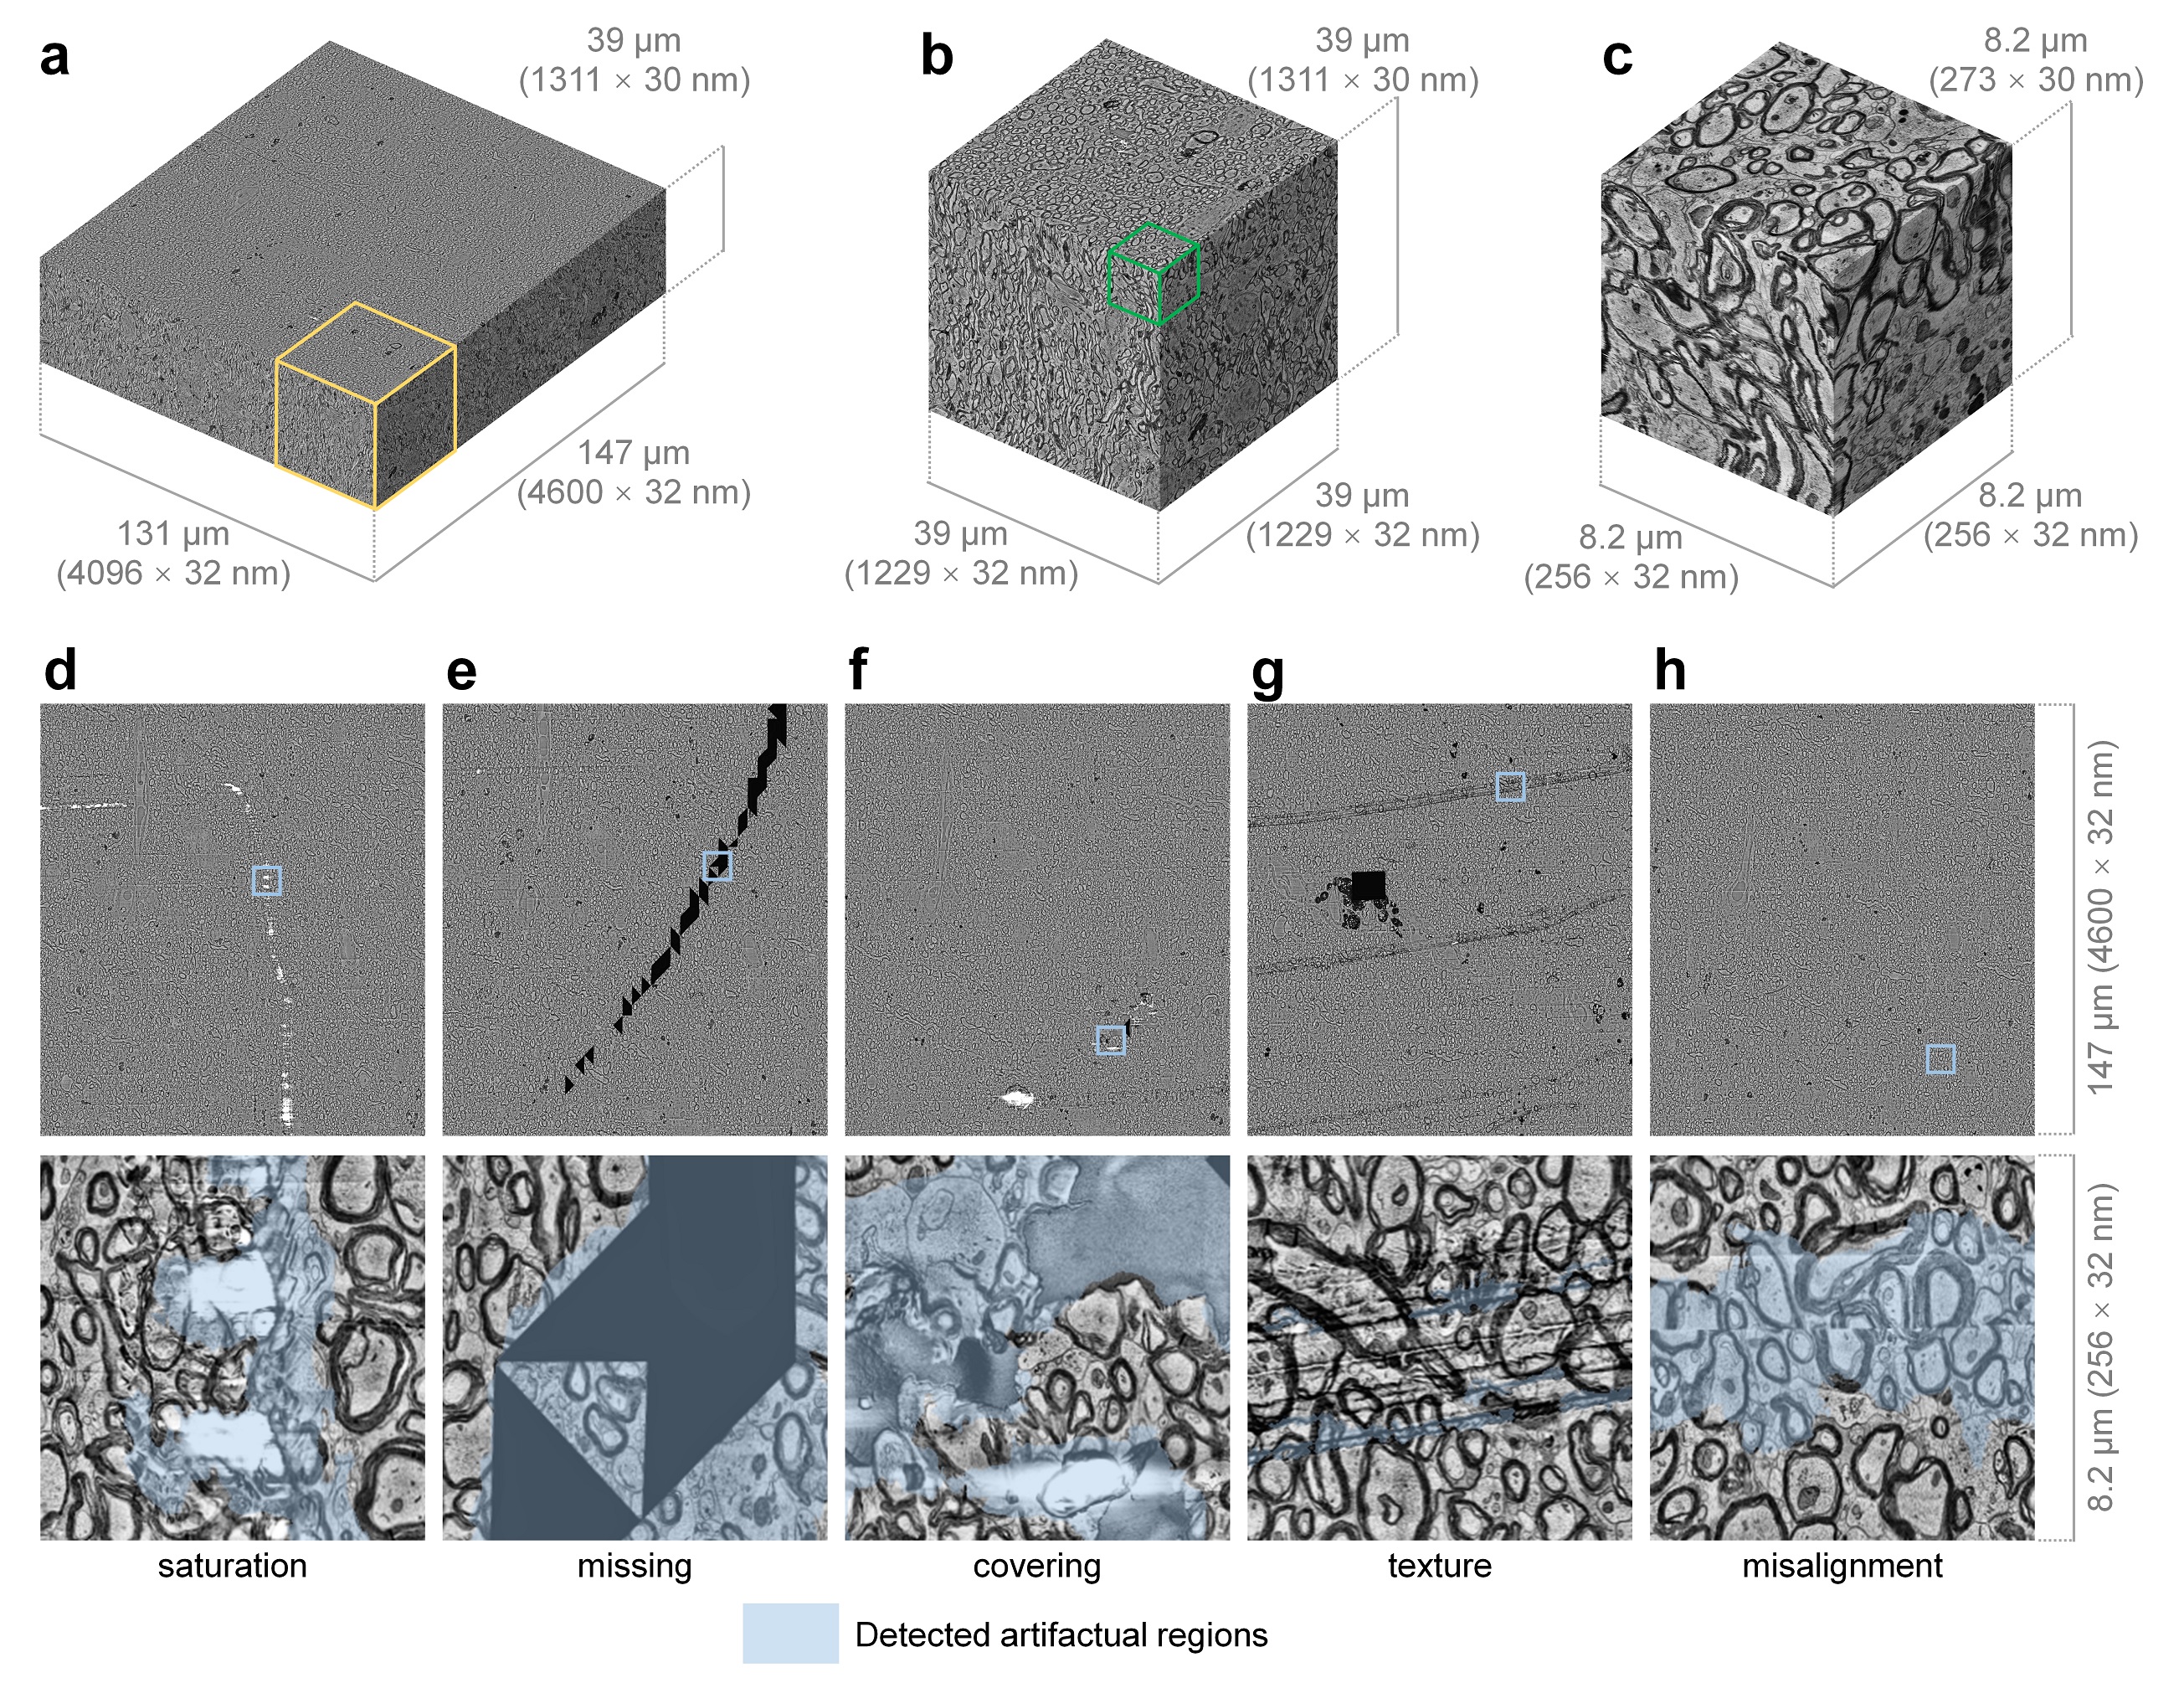
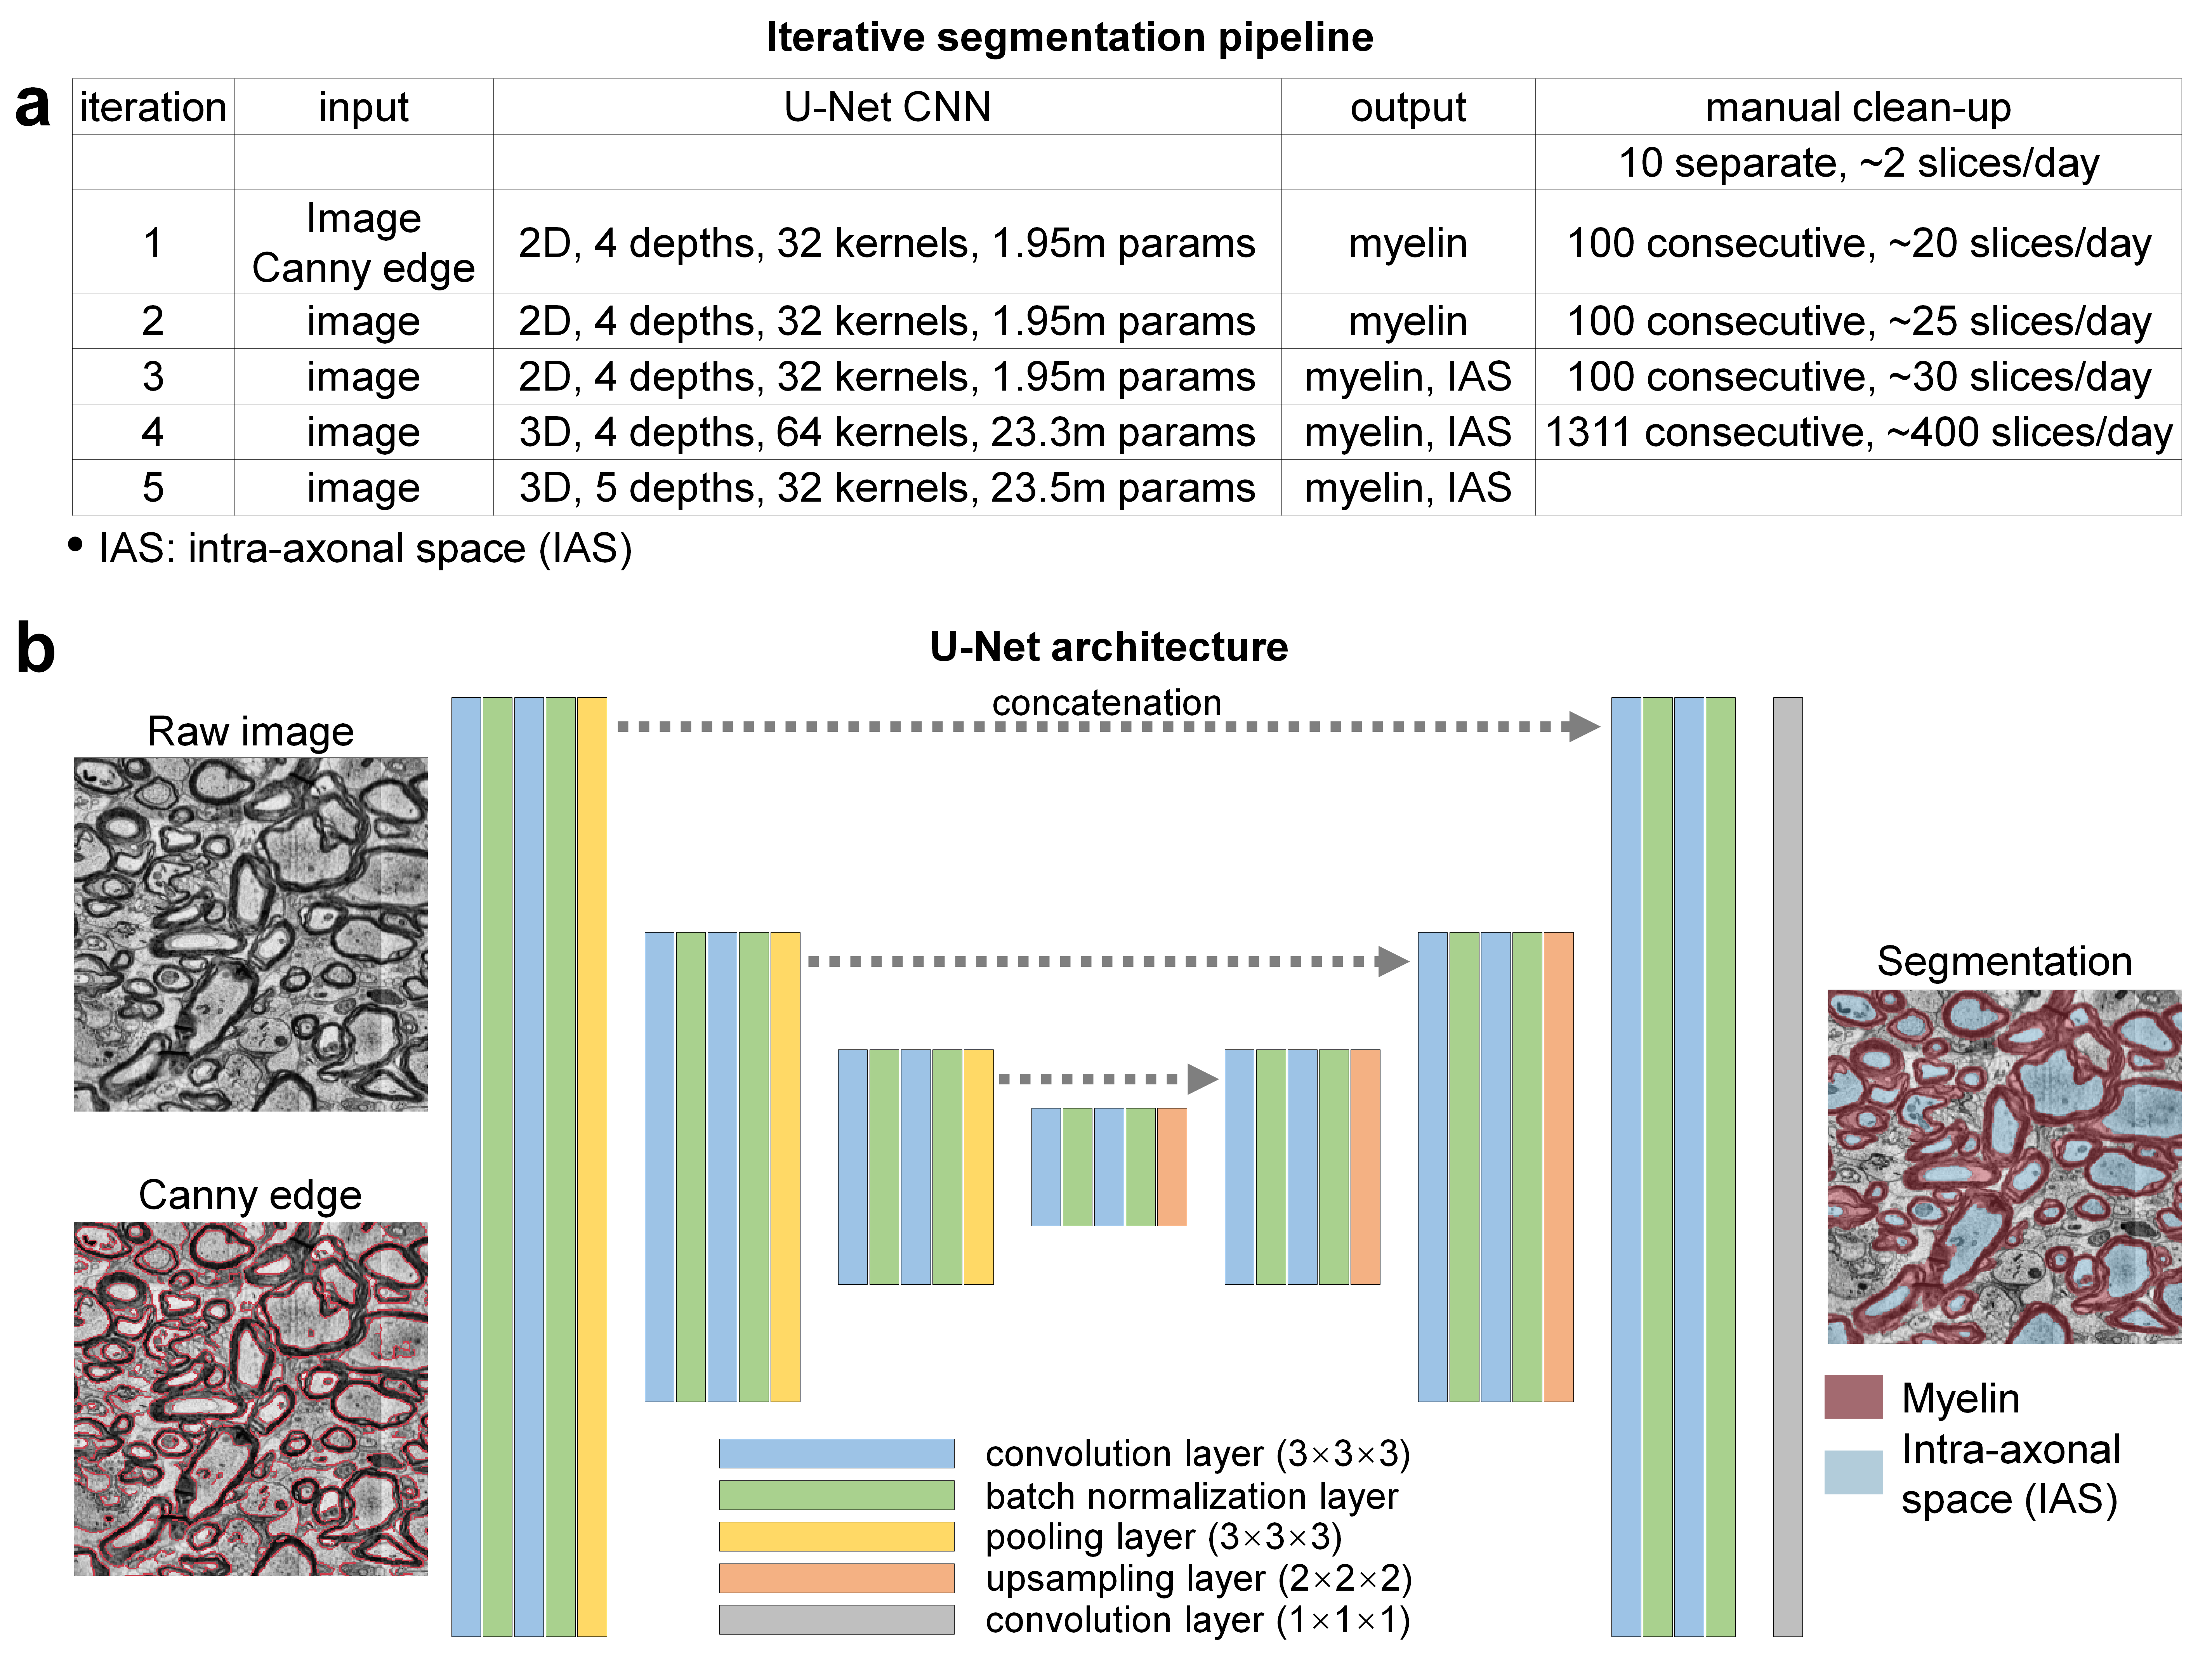
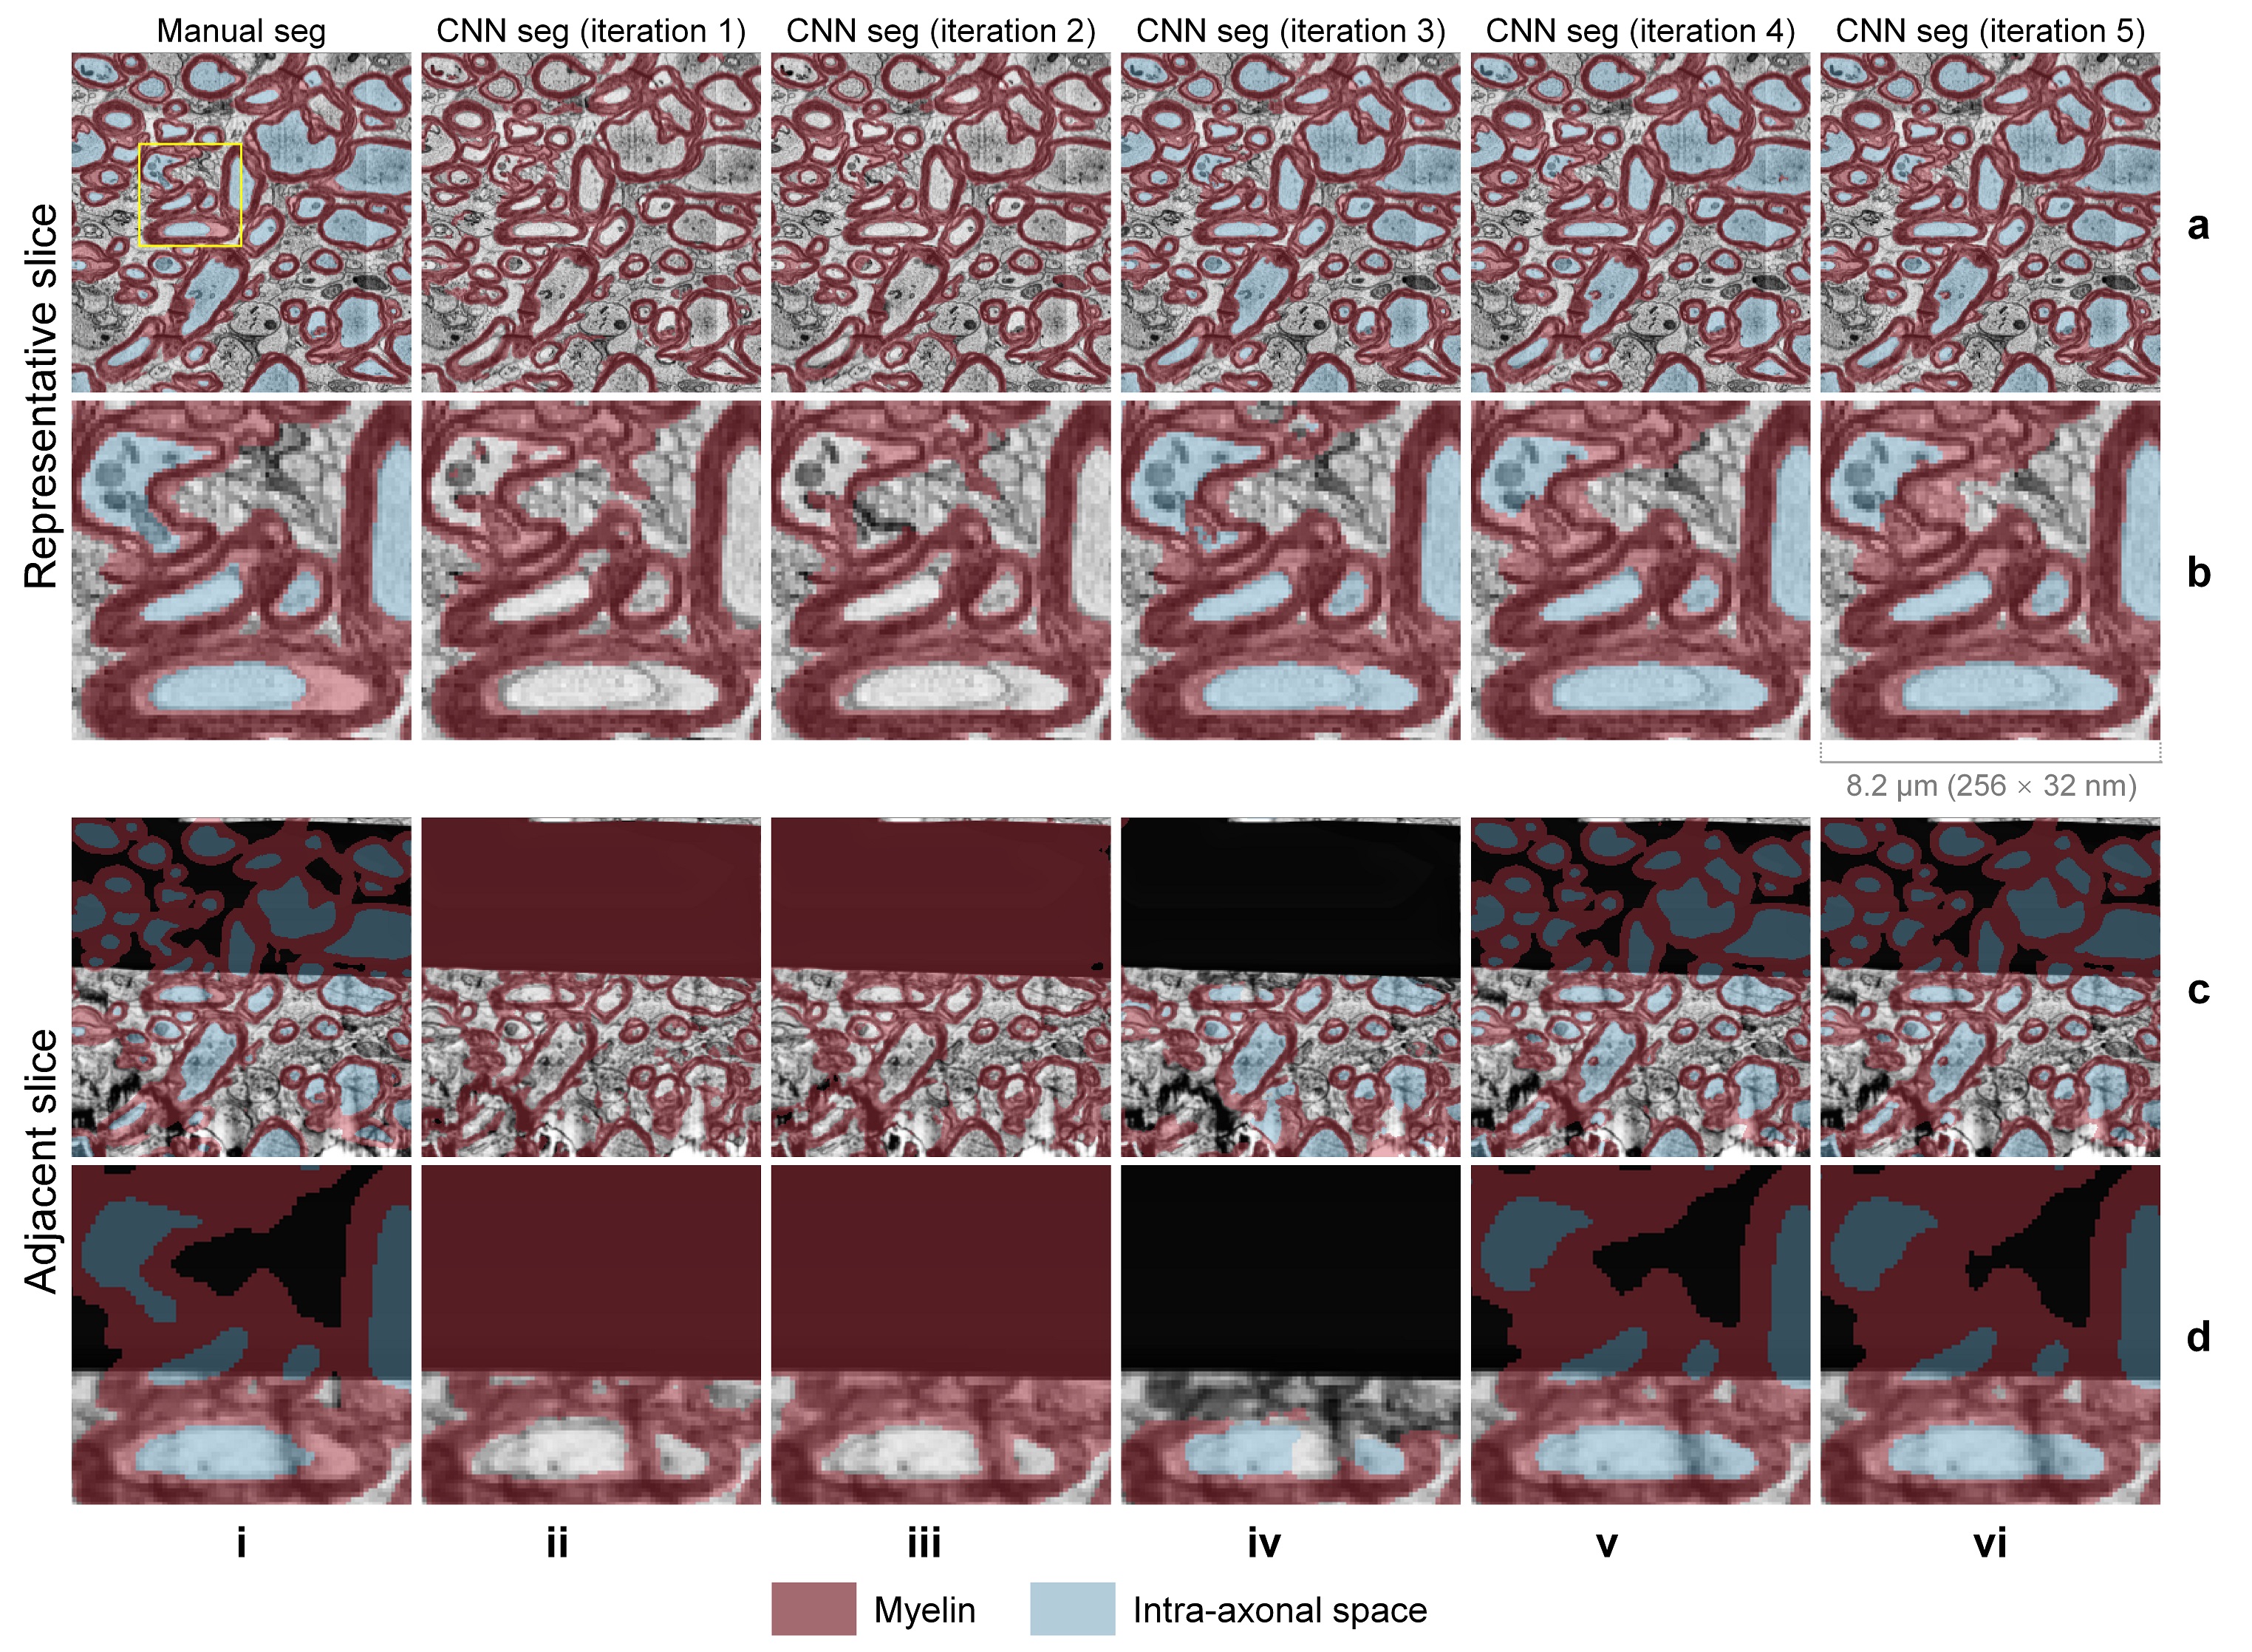
Data acquisition. A sample of human brain tissue was obtained intraoperatively from the posterior left middle temporal gyrus of a 47-year-old female who underwent surgery for removal of an epileptogenic focus in the left hippocampus. Immediately following excision, the tissue sample was placed in glutaraldehyde/paraformaldehyde fixative, stained with reduced osmium tetroxide and embedded in Epon resin2. The cured block containing full-thickness cerebral cortex and subcortical white matter was trimmed to a 2×3 mm rectangle and a depth of 200 um and imaged using serial-section scanning EM (Sigma, Carl Zeiss) with a custom-built automated tape-collecting ultramicrotome3. The subset of images within subcortical white matter (volume of 131×147×39 um3) was extracted from the entire dataset. Each image was acquired at 8×8×30 nm3 resolution with a data size approximating 375 GB per section. To reduce the data size and computational load, the data were down-sampled to 32×32×30 nm3.Segmentation pipeline. An iterative training/fine-tuning strategy incorporating transfer learning was adopted to reduce the volume of ground-truth, manually segmented images required for training the CNNs (Fig.2). A 2D/3D U-Net4 was initially trained on an existing mouse corpus callosum EM dataset that included ground-truth segmentation of myelin and IAS5 (http://cai2r.net/resources/software/intra-axonal-space-segmented-3d-scanning-electron-microscopy-mouse-brain-genu). The U-Net was then applied to the human EM data and fine-tuned using ground-truth manual segmentation delineated by an experienced neuroradiologist (C.N.) in an iterative fashion. For each iteration, the myelin and IAS were manually cleaned up on consecutive slices based on the U-Net segmentation results from the previous iteration. Image artifacts such as image saturation and missing image content (Fig.1 d-h) were automatically detected and were blacked out, i.e., set to an image intensity of 0. 3D U-Nets were adopted to utilize the across-slice smoothness/redundancy to synthesize the segmentation of the blacked-out regions.
Network deployment. The U-Net was implemented using the Keras API (https://keras.io/) with a Tensorflow (https://www.tensorflow.org/) backend, 4/5 levels, 32/64 kernels at the highest level and 2× kernels for each lower level, 3×3×3 kernels with “ReLU” activation. The output layer uses 1×1×1 kernels with “sigmoid” activation and “binary_crossentropy” loss for myelin only segmentation, with “softmax” activation and “categorical_crossentropy” loss for simultaneous myelin and IAS segmentation. The training was performed using an NVidia V100 GPU.
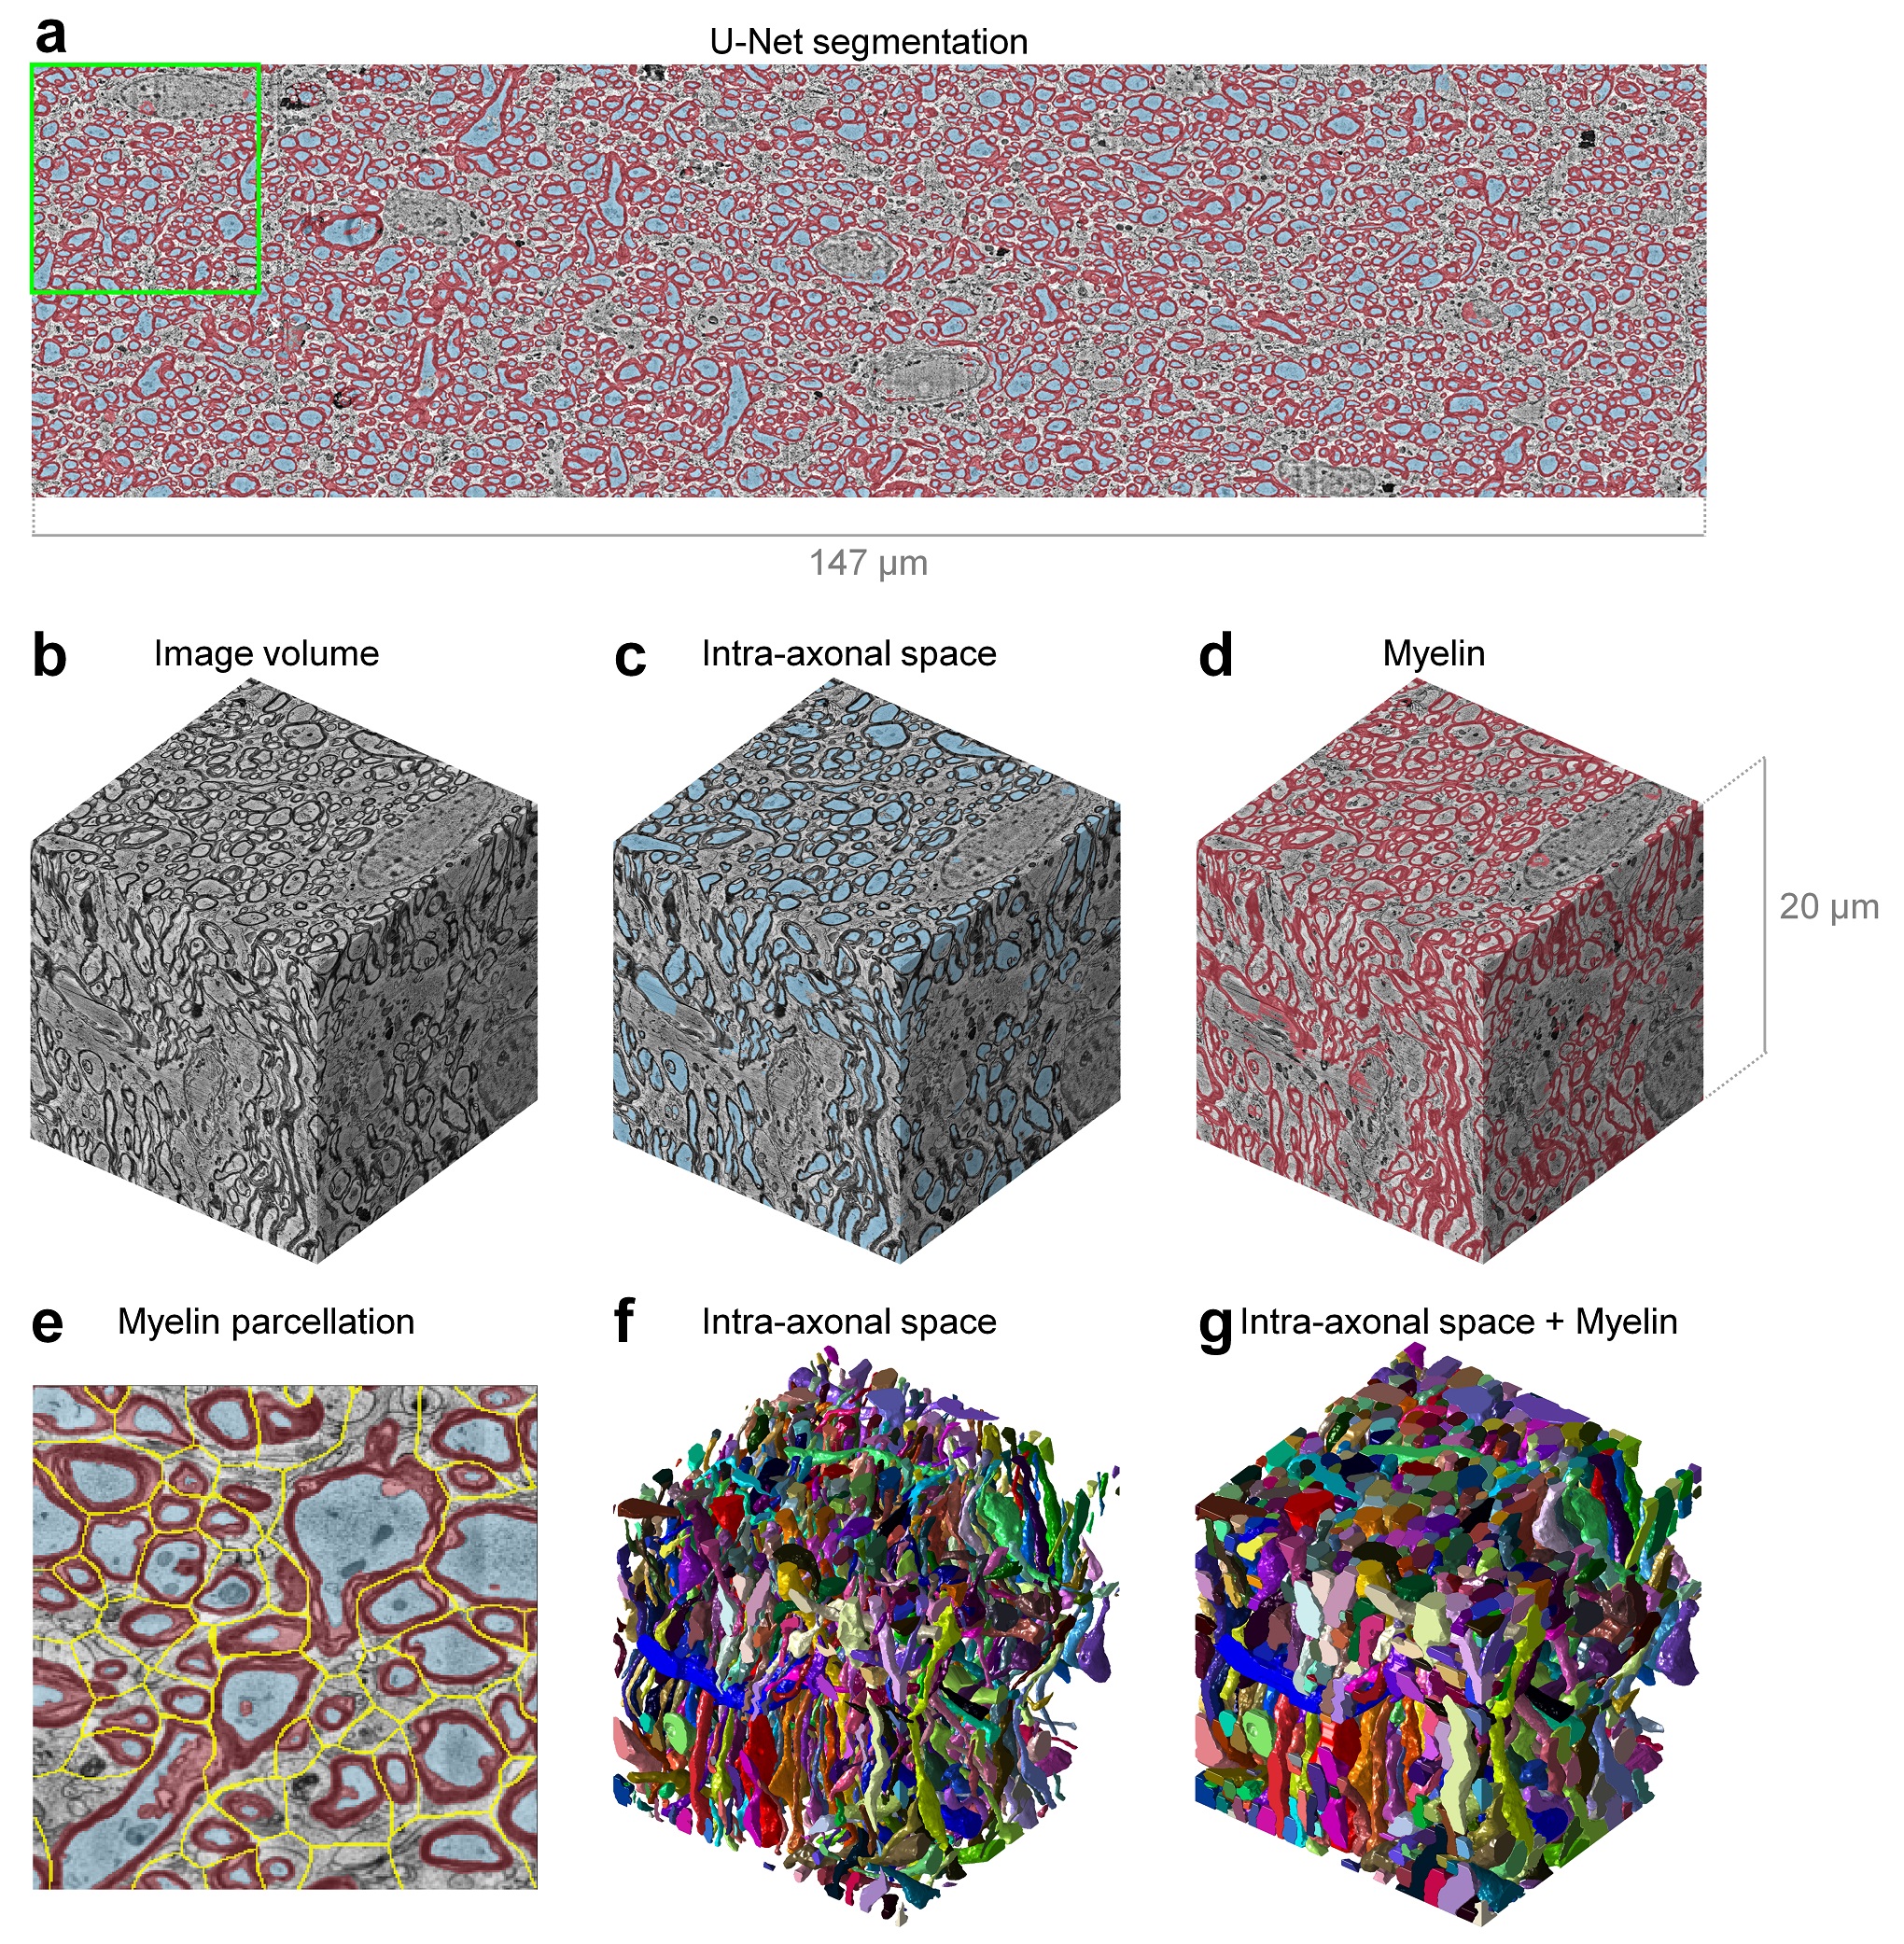
Axonal quantification. Analysis tools in the Random Walker (RaW) segmentation software5 (https://github.com/NYU-DiffusionMRI/RaW-seg) were used to quantify the axonal parameters. Briefly, adjacent axons with contact of their myelin sheaths were segmented using a non-weighted distance transform and watershed algorithm on the CNN-segmented IAS masks (Fig. 4e). For each axon, the cross-sectional areas (Ω) of the segmented IAS and IAS+myelin masks perpendicular to the axonal skeleton (i.e., a line connecting the center of mass of each slice) were calculated to quantify the inner and outer axon diameters. The axon diameter was calculated as the diameter of a circle with the same area (2*sqrt(Ω/pi)). The g-ratio was computed as the ratio between the inner and outer axon diameters.
Results
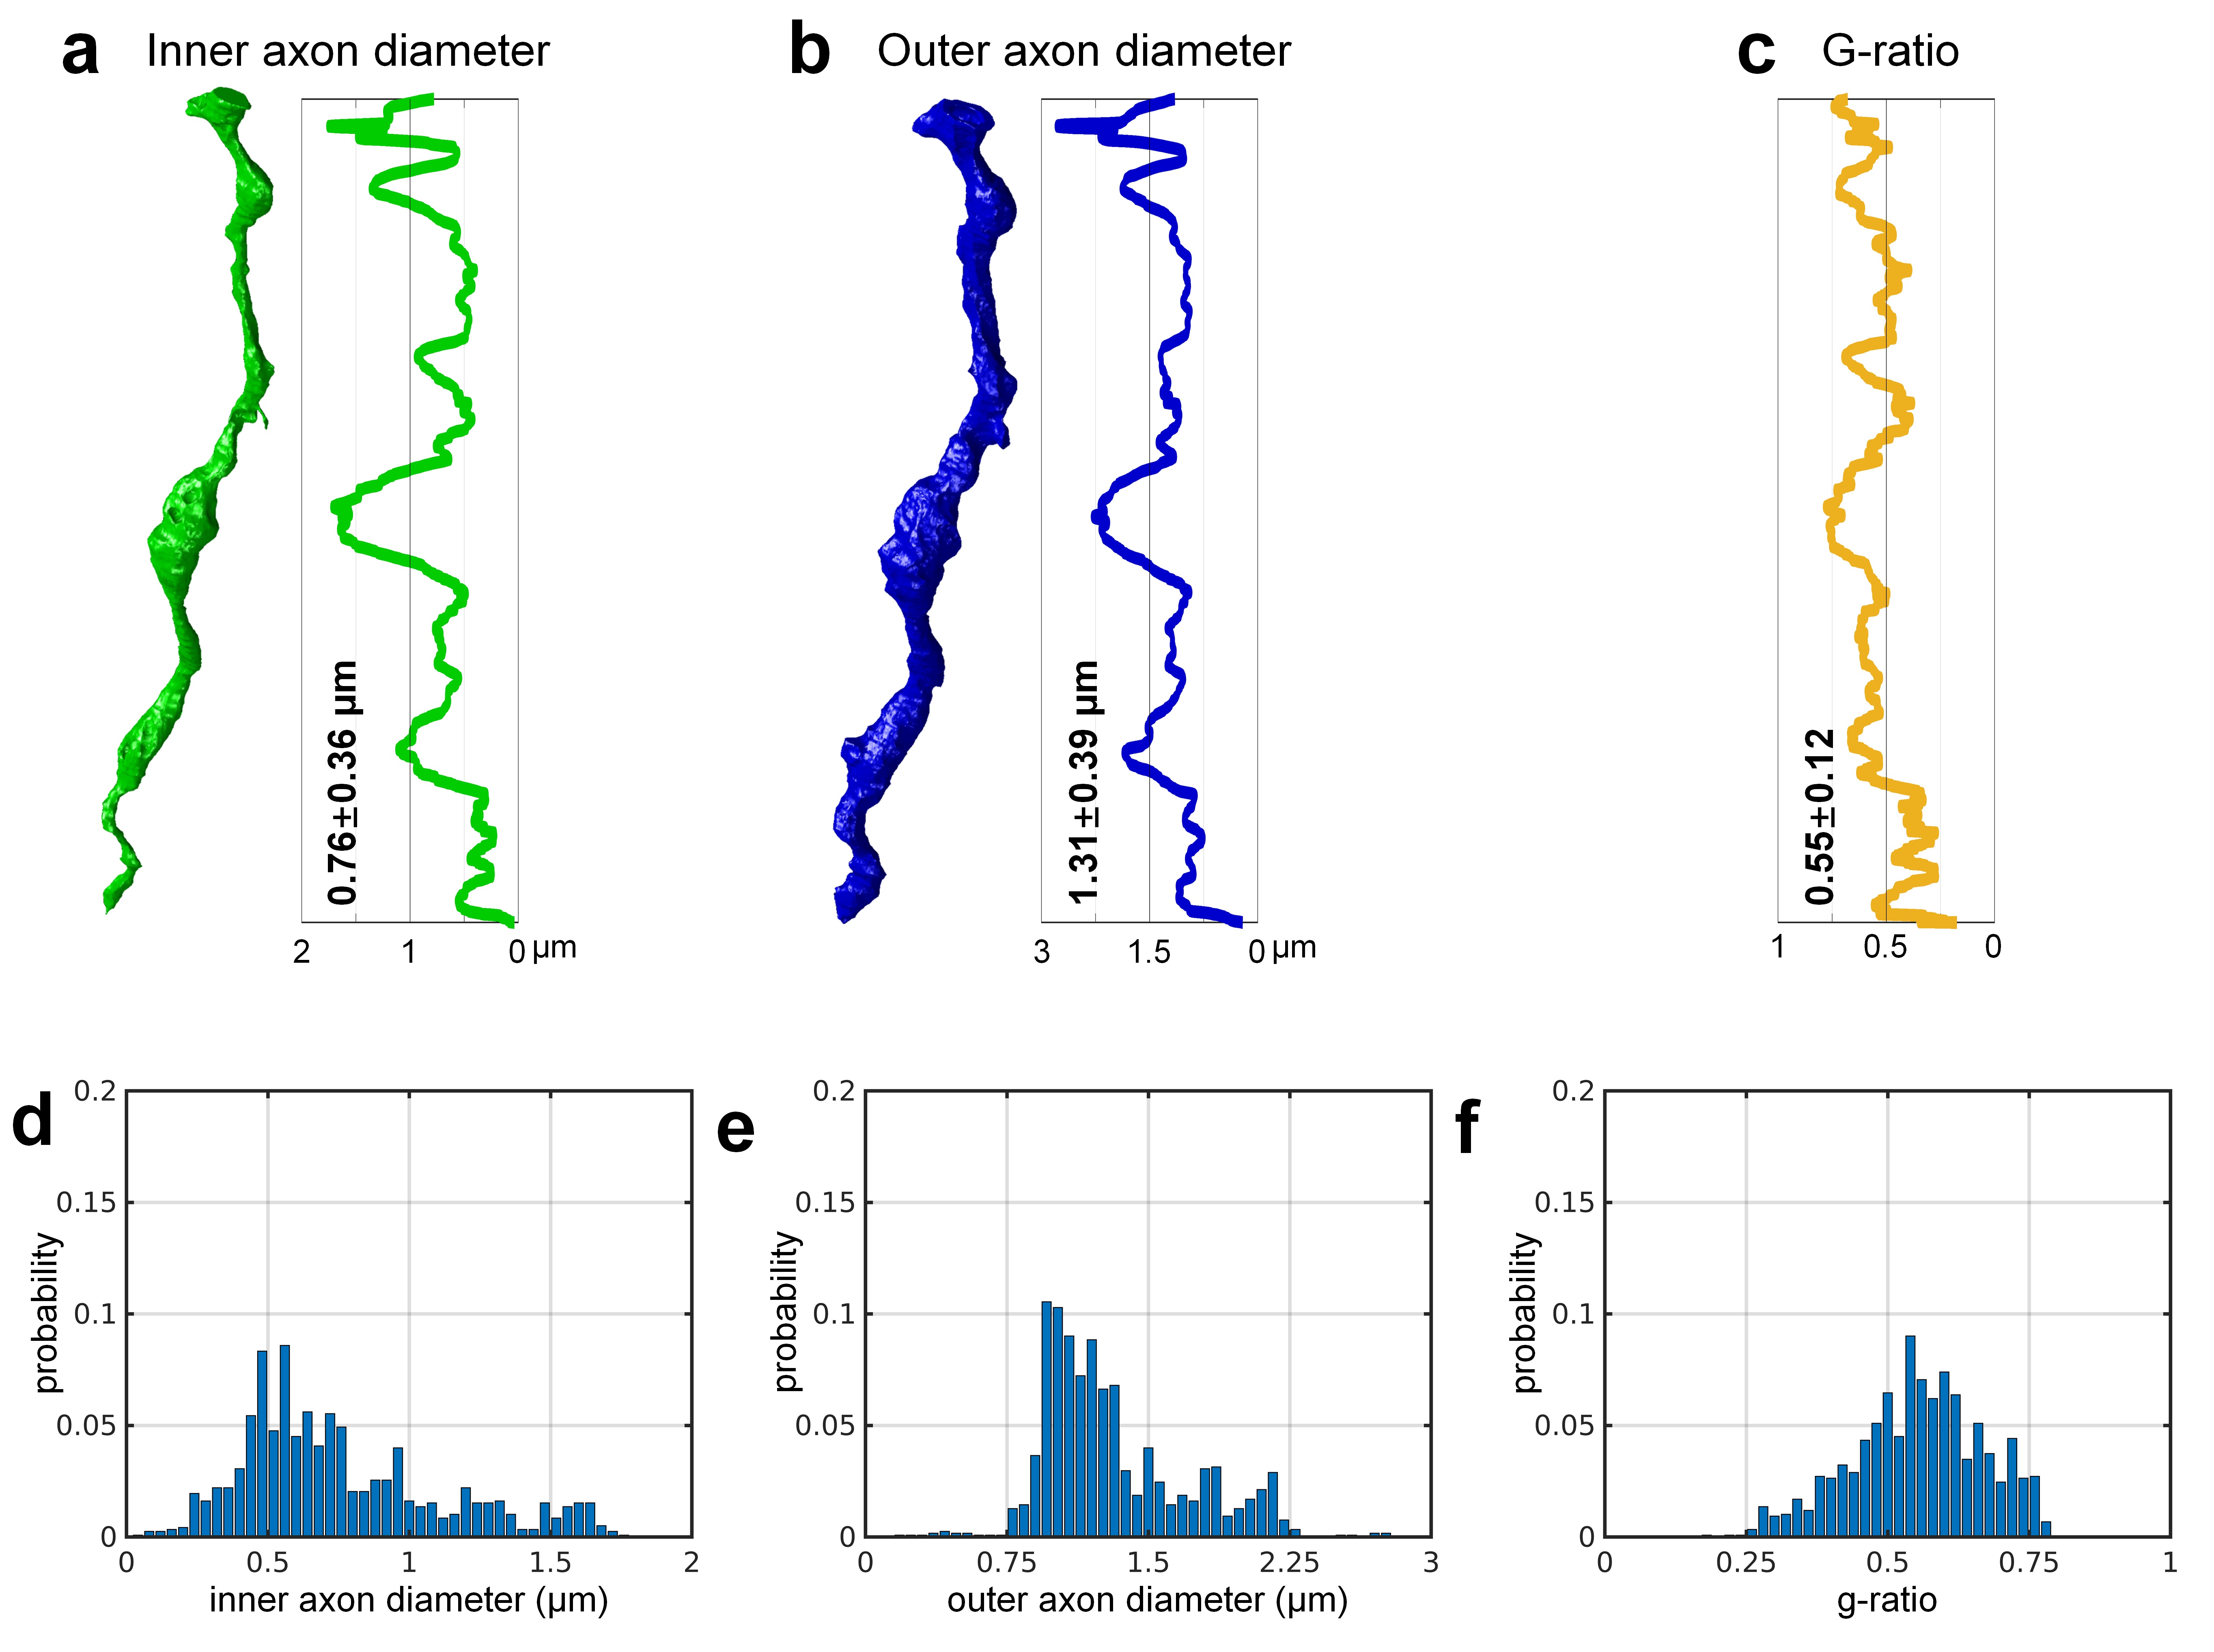
The CNN segmentation of myelin and IAS was similar to the manual segmentation and improved after each iteration (Fig.3). The 3D CNNs were capable of robustly segmenting the artifactual regions (Fig.3, row c,d, columns v,vi) by utilizing across-slice smoothness. Three-dimensional reconstruction of all segmented intra-axonal space/axons in the tissue volume clearly depicts axonal beading and undulation (Fig.4). The along-axon mean inner and outer axon diameters and g-ratios were quantified from a representative axon (Fig.5).Discussion
Marked variation in axonal diameter was observed along the axes of the longest individual axons identified within the volume of tissue, in keeping with previous observations in mouse5,6. Greater variability was observed in the structure of the myelin sheath in the human white matter compared to the mouse EM data, suggesting greater biological complexity in the organization of the human myelin sheath7,8. Monte Carlo diffusion simulations using the myelin and IAS segmentation are being pursued in parallel to understand the implications of axonal undulation and beading on the diffusion MRI signal. Future work will optimize CNNs for segmentation and apply CNNs to the entire volume to quantify the axonal diameters and g-ratios.Acknowledgements
This work was supported by NIH U01EB026996, NIH R01NS088040, NIH P41EB017183.References
[1] Eberle, A. L. & Zeidler, D. Multi-Beam Scanning Electron Microscopy for High-Throughput Imaging in Connectomics Research. Frontiers in neuroanatomy 12, 112, doi:10.3389/fnana.2018.00112 (2018).
[2] Tapia, J. C. et al. High-contrast en bloc staining of neuronal tissue for field emission scanning electron microscopy. Nature protocols 7, 193-206, doi:10.1038/nprot.2011.439 (2012).
[3] Baena, V., Schalek, R. L., Lichtman, J. W. & Terasaki, M. Serial-section electron microscopy using automated tape-collecting ultramicrotome (ATUM). Methods in cell biology 152, 41-67, doi:10.1016/bs.mcb.2019.04.004 (2019).
[4] Falk, T. et al. U-Net: deep learning for cell counting, detection, and morphometry. Nat Methods 16, 67-70, doi:10.1038/s41592-018-0261-2 (2019).
[5] Lee, H.-H. et al. Along-axon diameter variation and axonal orientation dispersion revealed with 3D electron microscopy: implications for quantifying brain white matter microstructure with histology and diffusion MRI. Brain Structure and Function 224, 1469-1488 (2019).
[6] Aboitiz, F., Scheibel, A. B., Fisher, R. S. & Zaidel, E. Individual differences in brain asymmetries and fiber composition in the human corpus callosum. Brain research 598, 154-161, doi:10.1016/0006-8993(92)90179-d (1992).
[7] Liewald, D., Miller, R., Logothetis, N., Wagner, H. J. & Schuz, A. Distribution of axon diameters in cortical white matter: an electron-microscopic study on three human brains and a macaque. Biological cybernetics 108, 541-557, doi:10.1007/s00422-014-0626-2 (2014).
[8] Abdollahzadeh, A., Belevich, I., Jokitalo, E., Tohka, J. & Sierra, A. Automated 3D Axonal Morphometry of White Matter. Scientific reports 9, 6084 (2019).
Figures