4449
Diffusion Tensor Distribution (DTD) MRI Reimagined1SQITS/NICHD, National Institute of Health, Bethesda, MD, United States, 2The Henry M. Jackson Foundation for the Advancement of Military Medicine, Inc., Bethesda, MD, United States, 3University of Helsinki, Helsinki, Finland
Synopsis
A new DTD imaging method is presented with novel data acquisition schemes for higher rank b-matrices, and analysis pipeline to estimate the mean and covariance of diffusion tensor. The developed pulse sequence is simple, easy to implement with well defined diffusion, mixing and pulsed gradient dwell times and immune to concomitant fields. The method is validated using PDMS phantom and excised rat brain tissue. Estimated DTD was used to compute the microscopic FA and AD. The phantom results agreed as expected with zero FA and uFA and accurate AD. The approach was able to capture the heterogeneity in the brain.
Introduction
Measuring and mapping the diffusion tensor distribution (DTD) via MRI holds the promise of revealing the tissue microstructure at sub-voxel resolution. Recent approaches have used the covariance of the diffusion tensor as a means to characterize DTD within a voxel [1], [2]. It can be shown that several terms in the covariance matrix are not observable when using standard rank-1 b-matrix acquisition schemes using single pulsed field gradient (PFG) MR sequences, emphasizing the need for higher-rank b-matrix acquisitions for DTD imaging. Several pulse sequences have been introduced for higher-rank b-matrix encoding [2]–[4] but their applicability is limited by their long echo times and/or the lack of well-defined diffusion times. A new efficient, easy to implement b-matrix encoding strategy is presented which is capable of generating ranks 1, 2 and 3 b-matrices with well-defined diffusion times. The presented method is also immune to concomitant field errors which are thought to confound DTD estimation [5]. The developed method is tested on a macroscopic and microscopically isotropic polydimethylsiloxane (PDMS) phantom , and on excised rat brain tissue.Methods
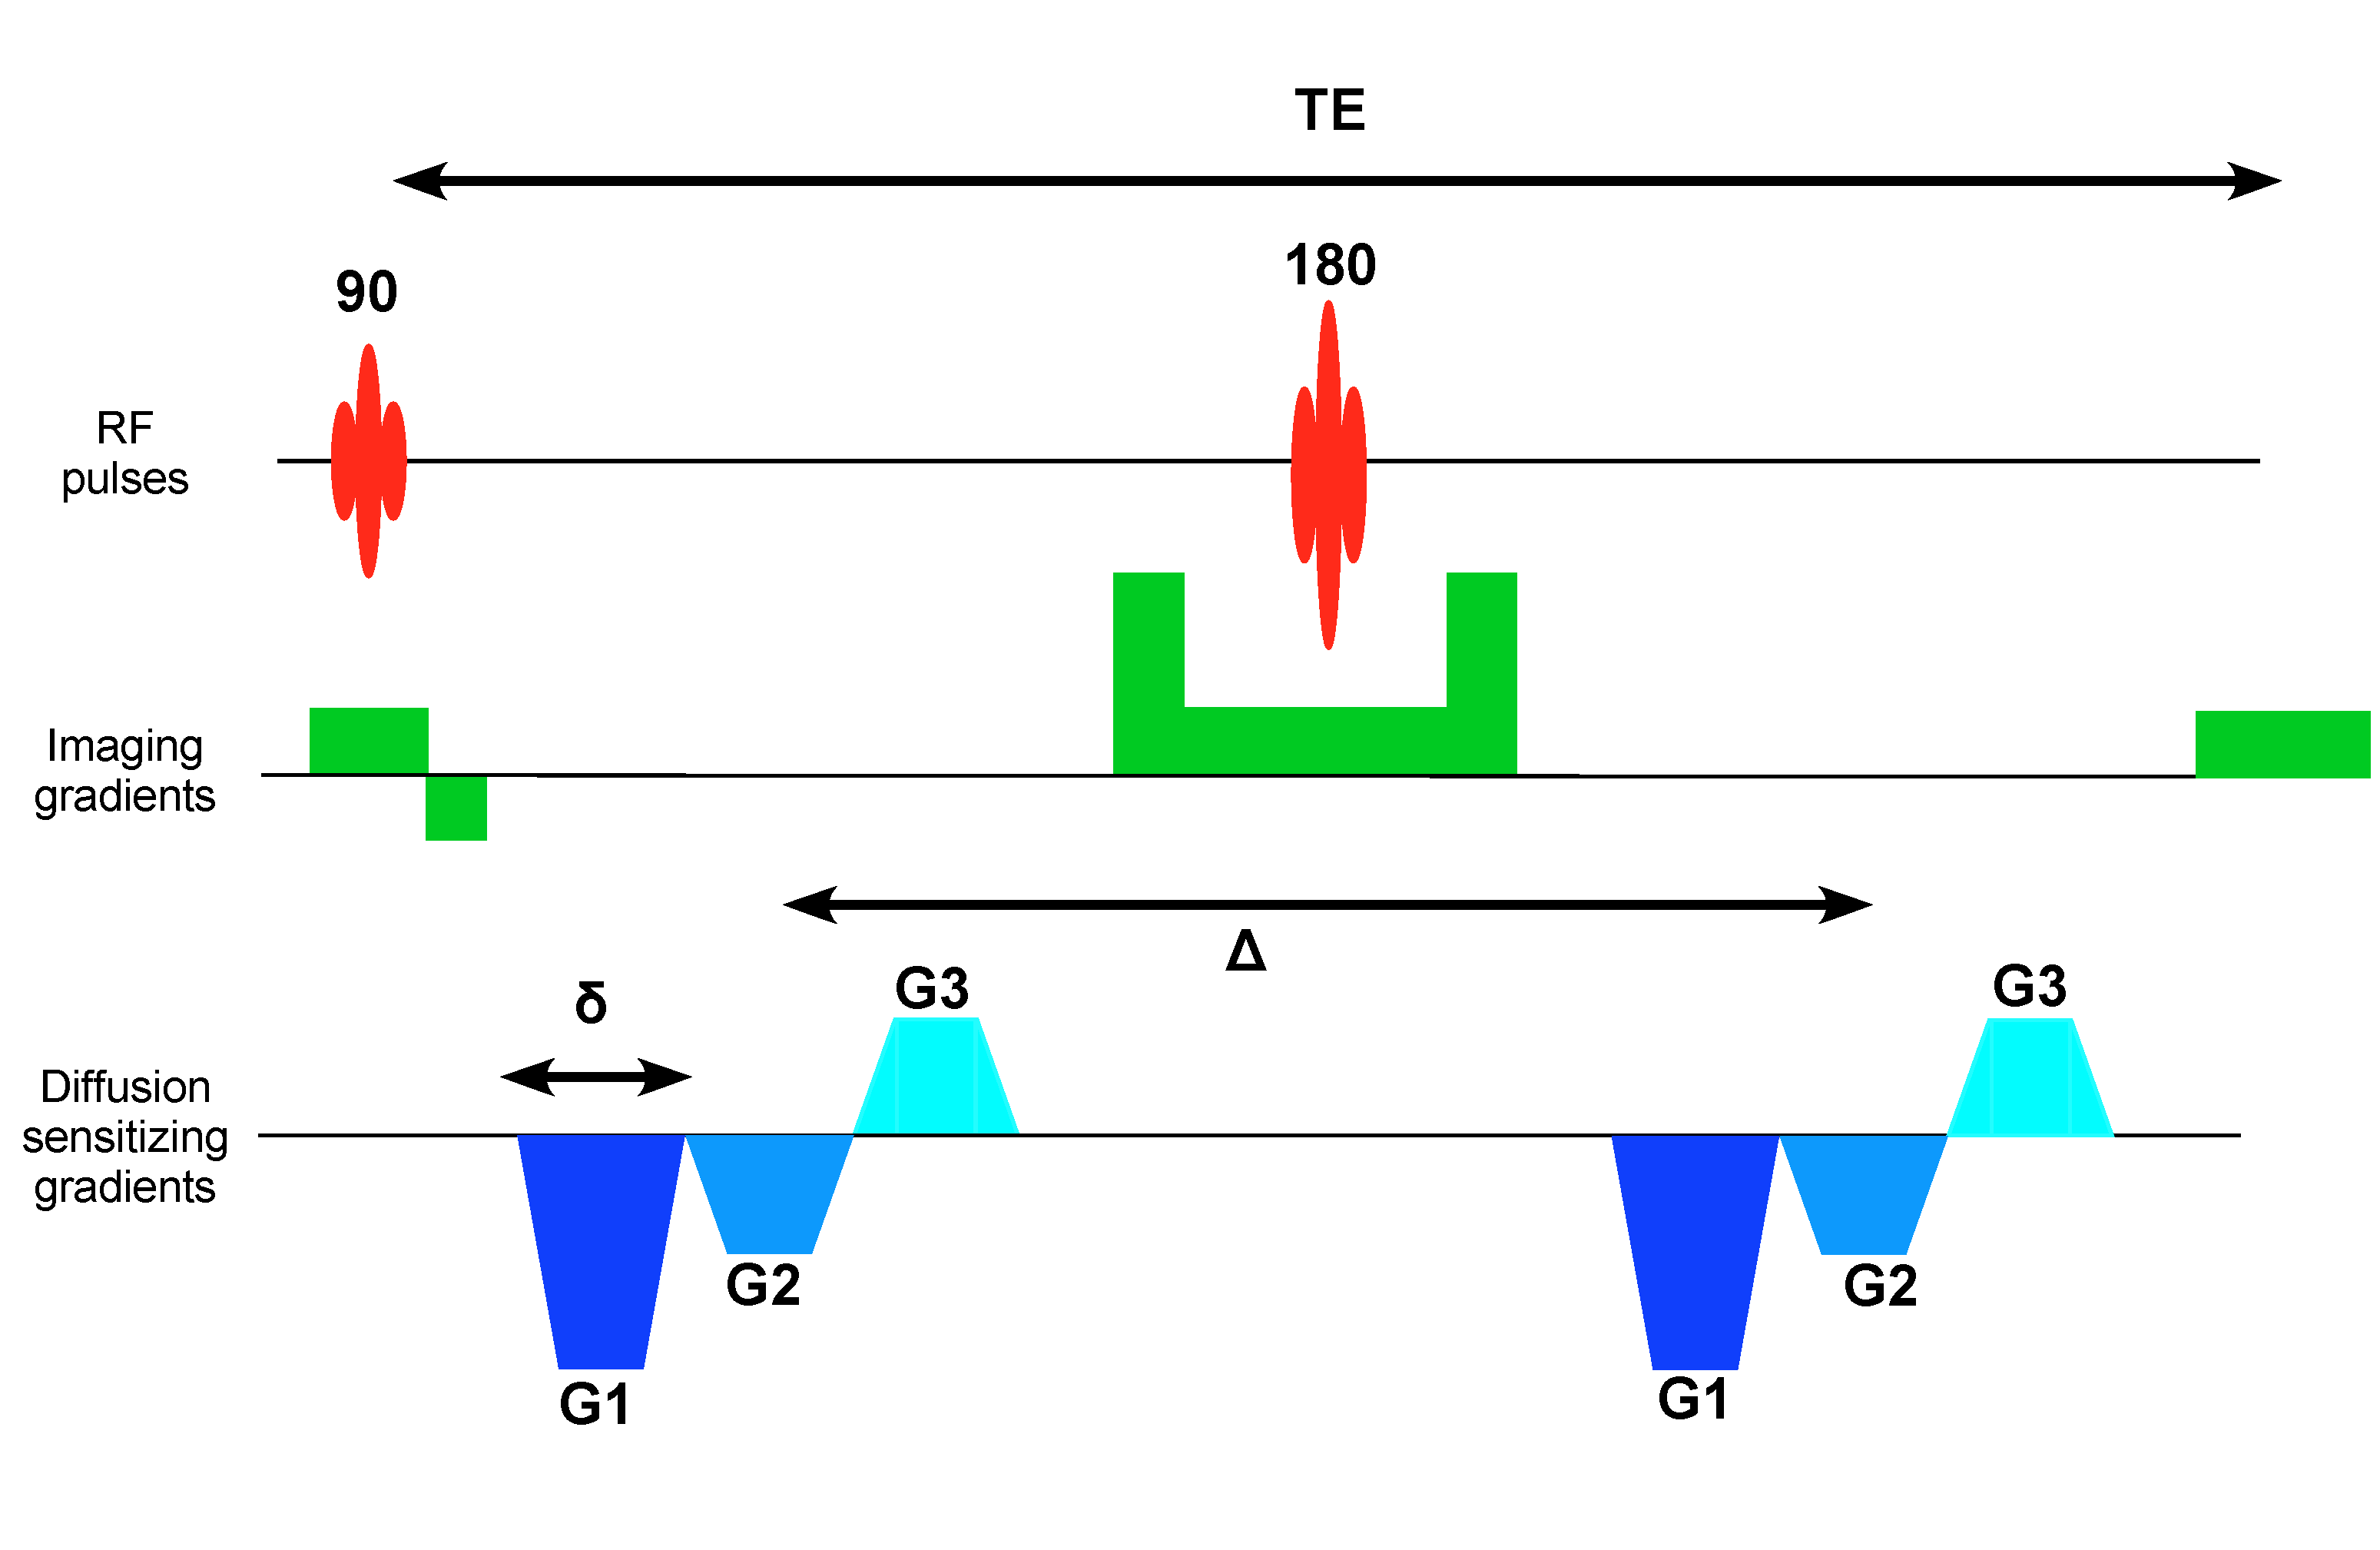
The higher-rank b-matrices were obtained by simply embedding a standard triple PFG pulse sequence in a single spin-echo EPI sequence (Figure 1). The six diffusion gradient lobes of equal duration were balanced around the 180° RF pulse to mitigate the concomitant field effects [6]. The three q-vectors in the diffusion block were randomly oriented and distributed uniformly over a unit sphere; their amplitudes were randomly varied to obtain a range of b-values. The sampled b-matrices displayed as ellipsoids along with the histogram of b-values are shown in Figure 2.MRI data were acquired on a 7T vertical Bruker wide-bore AvanceIII MRI system (Bruker Biospin, Billerica, MA) equipped with a Micro2.5 microimaging probe and three GREAT60 gradient amplifiers. The pulse sequence was calibrated using a 3.9 cSt cyclic PDMS phantom in a 5-mm NMR tube using the following parameters: δ = 3 ms, Δ = 32 ms, TR/TE = 3000/55 ms with a spatial resolution of 100 μm in-plane resolution and 2-mm slice thickness. A total of 150 different b-matrices were acquired as shown in Figure 2 resulting a b-value ranging from 0 – 35,000 s/mm2. Rat brain data were acquired with identical diffusion gradients but with 3D spatial encoding resulting in a TR/TE = 1000/78 ms and 100 μm in-plane spatial resolution with 1 mm resolution in the third dimension.
A multi-normal distribution constrained within the manifold of positive semi-definite diffusion tensors, $$$\mathcal{M}^+$$$, was assumed as the DTD. This new model predicts a monotonically decreasing signal attenuation with increasing b-value consistent with the observed MR signal unlike the higher-order cumulant [2] or kurtosis [7] models. This new model is based on the application of the central limit theorem, which is justified by the large voxel size of typical MRI scans and the large number of micro-voxels they may contain. The resulting signal model is given by,
$$S(\mathbf{b}) = S_0 e^{-\mathbf{b}.\overline{\mathbf{D}}+\frac{1}{2}\mathbf{b}.\Sigma\mathbf{b}} \frac{Z[\overline{\mathbf{D}}-\Sigma.\mathbf{b},\Sigma]}{Z[\overline{\mathbf{D}},\Sigma]}$$
where b is a b-matrix and $$$\overline{\mathbf{D}}$$$ is a 2nd-order mean diffusion tensor transformed into 6 x 1 vectors, ∑ is the 4th-order covariance tensor transformed into a 6 x 6 matrix [1], and $$$Z$$$ is the partition function given by,
$$Z[\overline{\mathbf{D}},\Sigma] = \int_{\mathcal{M}^+} e^{-\frac{1}{2}(\mathbf{D}-\overline{\mathbf{D}})\Sigma^{-1}(\mathbf{D}-\overline{\mathbf{D}})} d\mathbf{D}$$
The mean and covariance were estimated by fitting the acquired data to this model using a nonlinear least-squares (NNLS) routine. An isotropic covariance tensor with 2 parameters was assumed for analyzing both the PDMS and rat brain data. Given the mean and covariance of the DTD, microscopic quantities such as μFA and μAD are computed using the following relation inspired from [8],
$$\mu f = \langle f(\mathbf{D}) \rangle = \frac{1}{Z} \int_{\mathcal{M}^+} f(\mathbf{D}) e^{-\frac{1}{2}(\mathbf{D}-\overline{\mathbf{D}})\Sigma^{-1}(\mathbf{D}-\overline{\mathbf{D}})} d\mathbf{D}$$
where $$$f$$$ is the function of interest for example corresponding to $$$FA$$$ or $$$AD$$$.
Results and Discussion
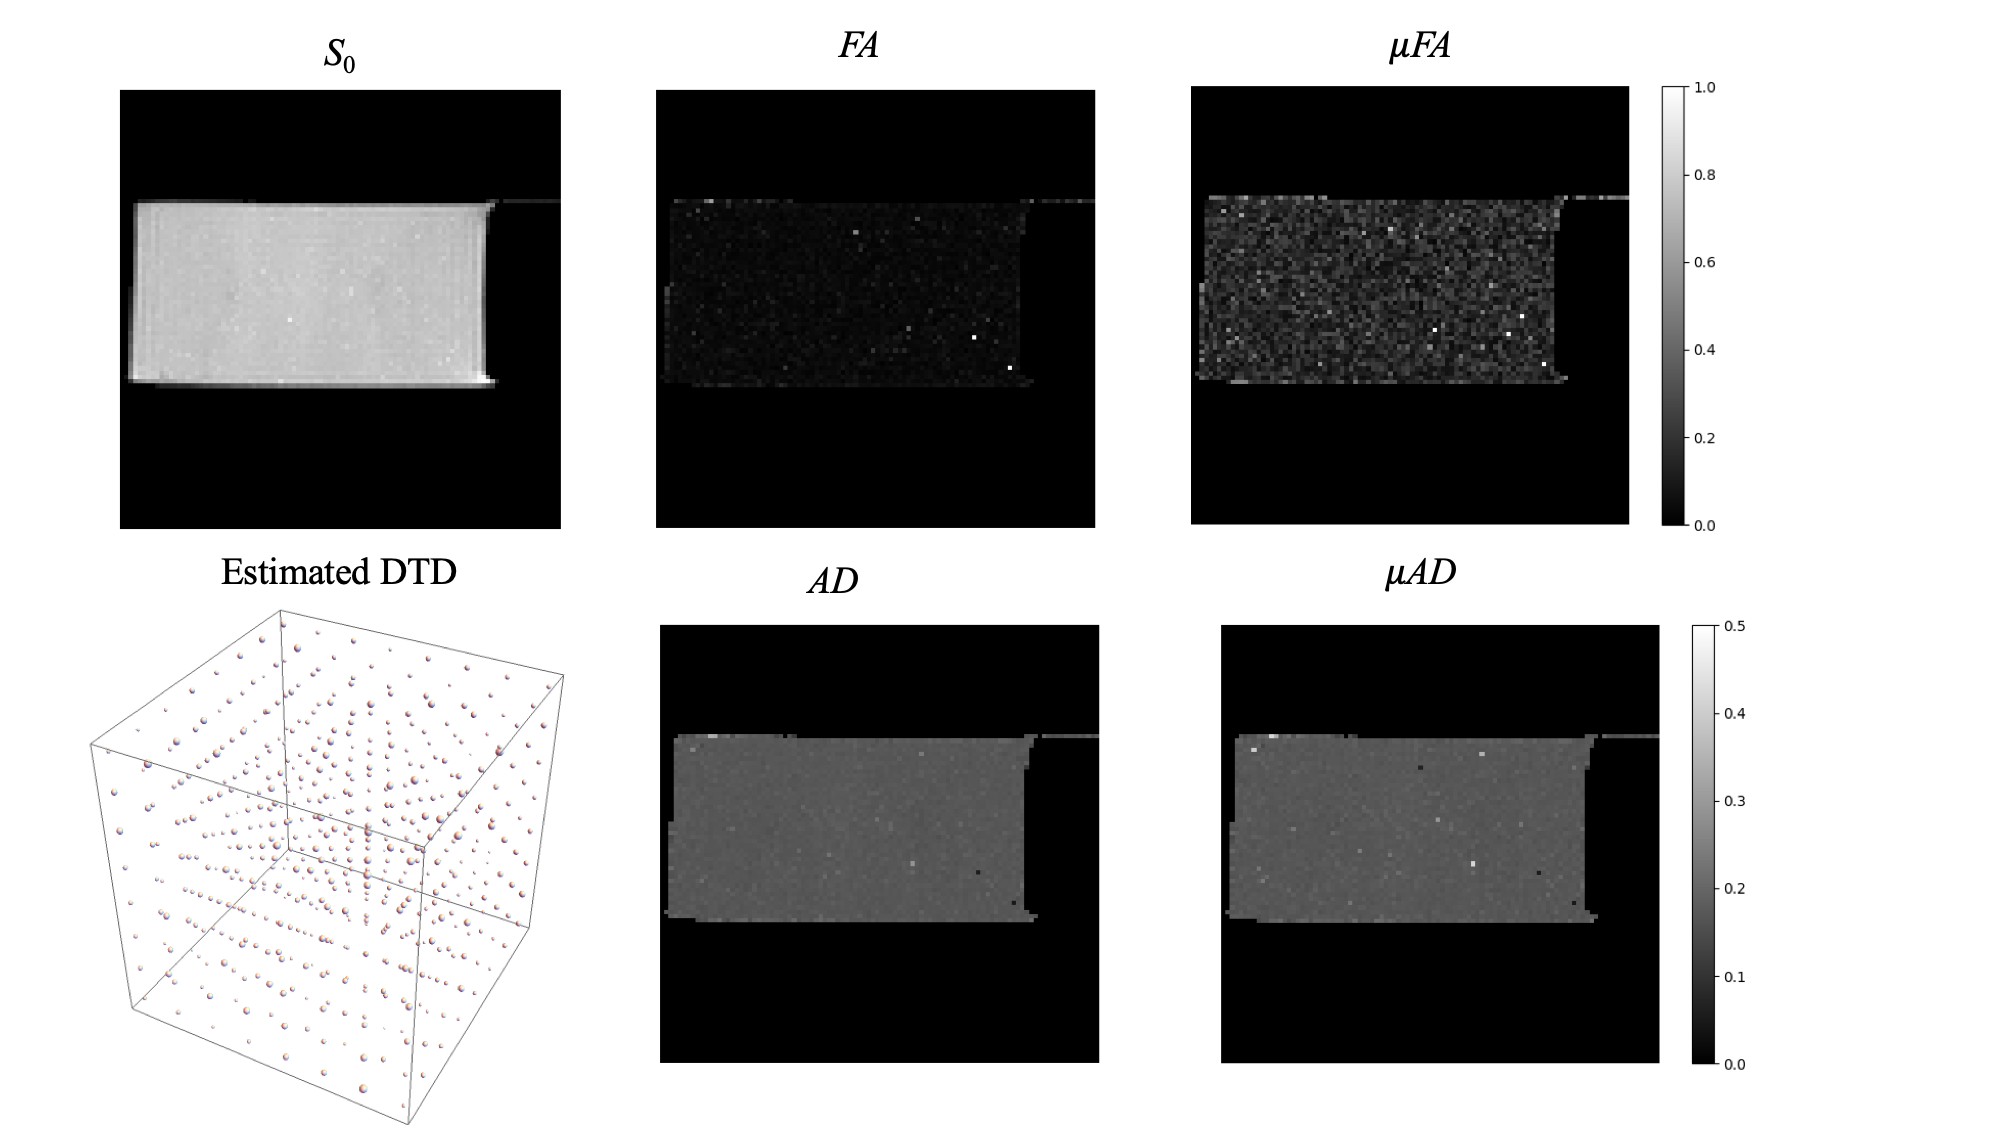
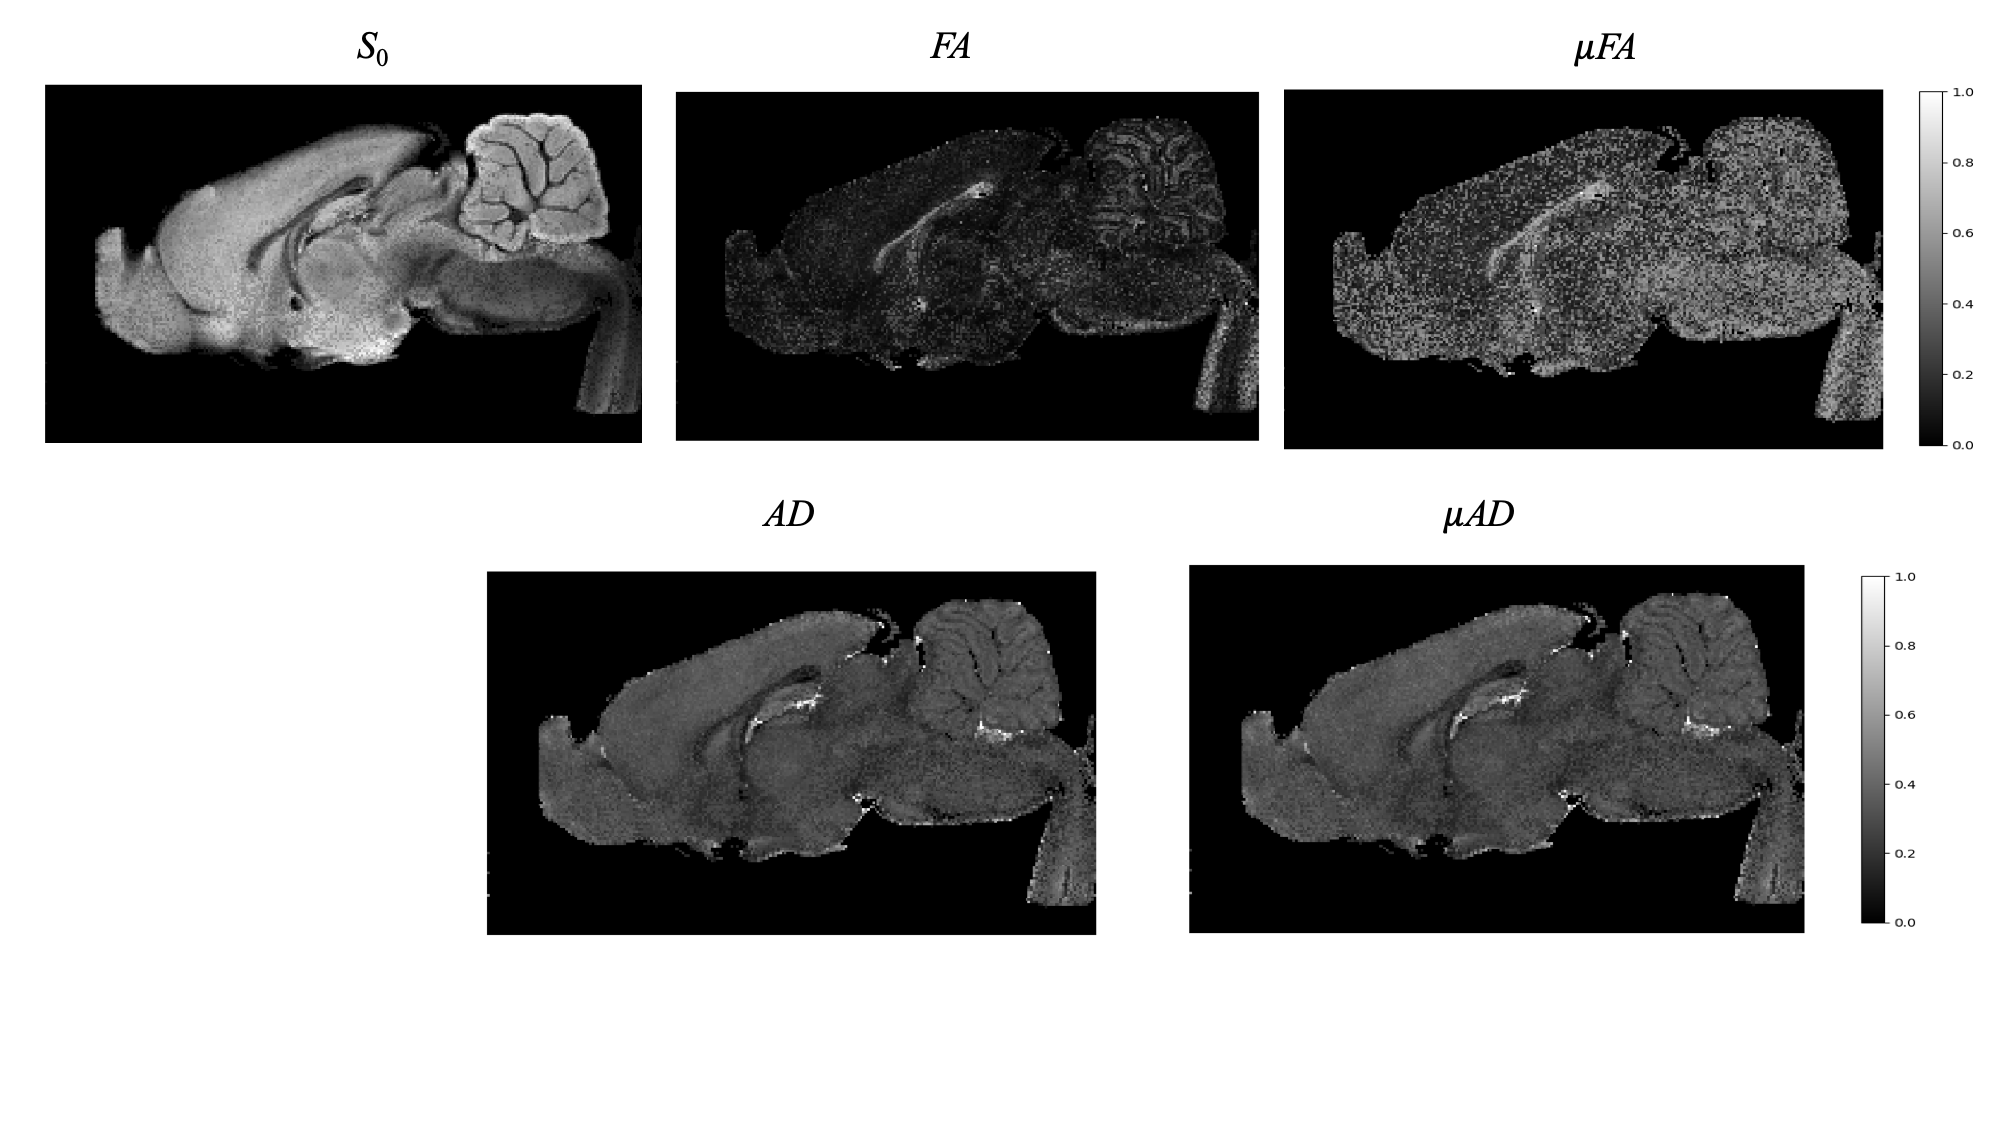
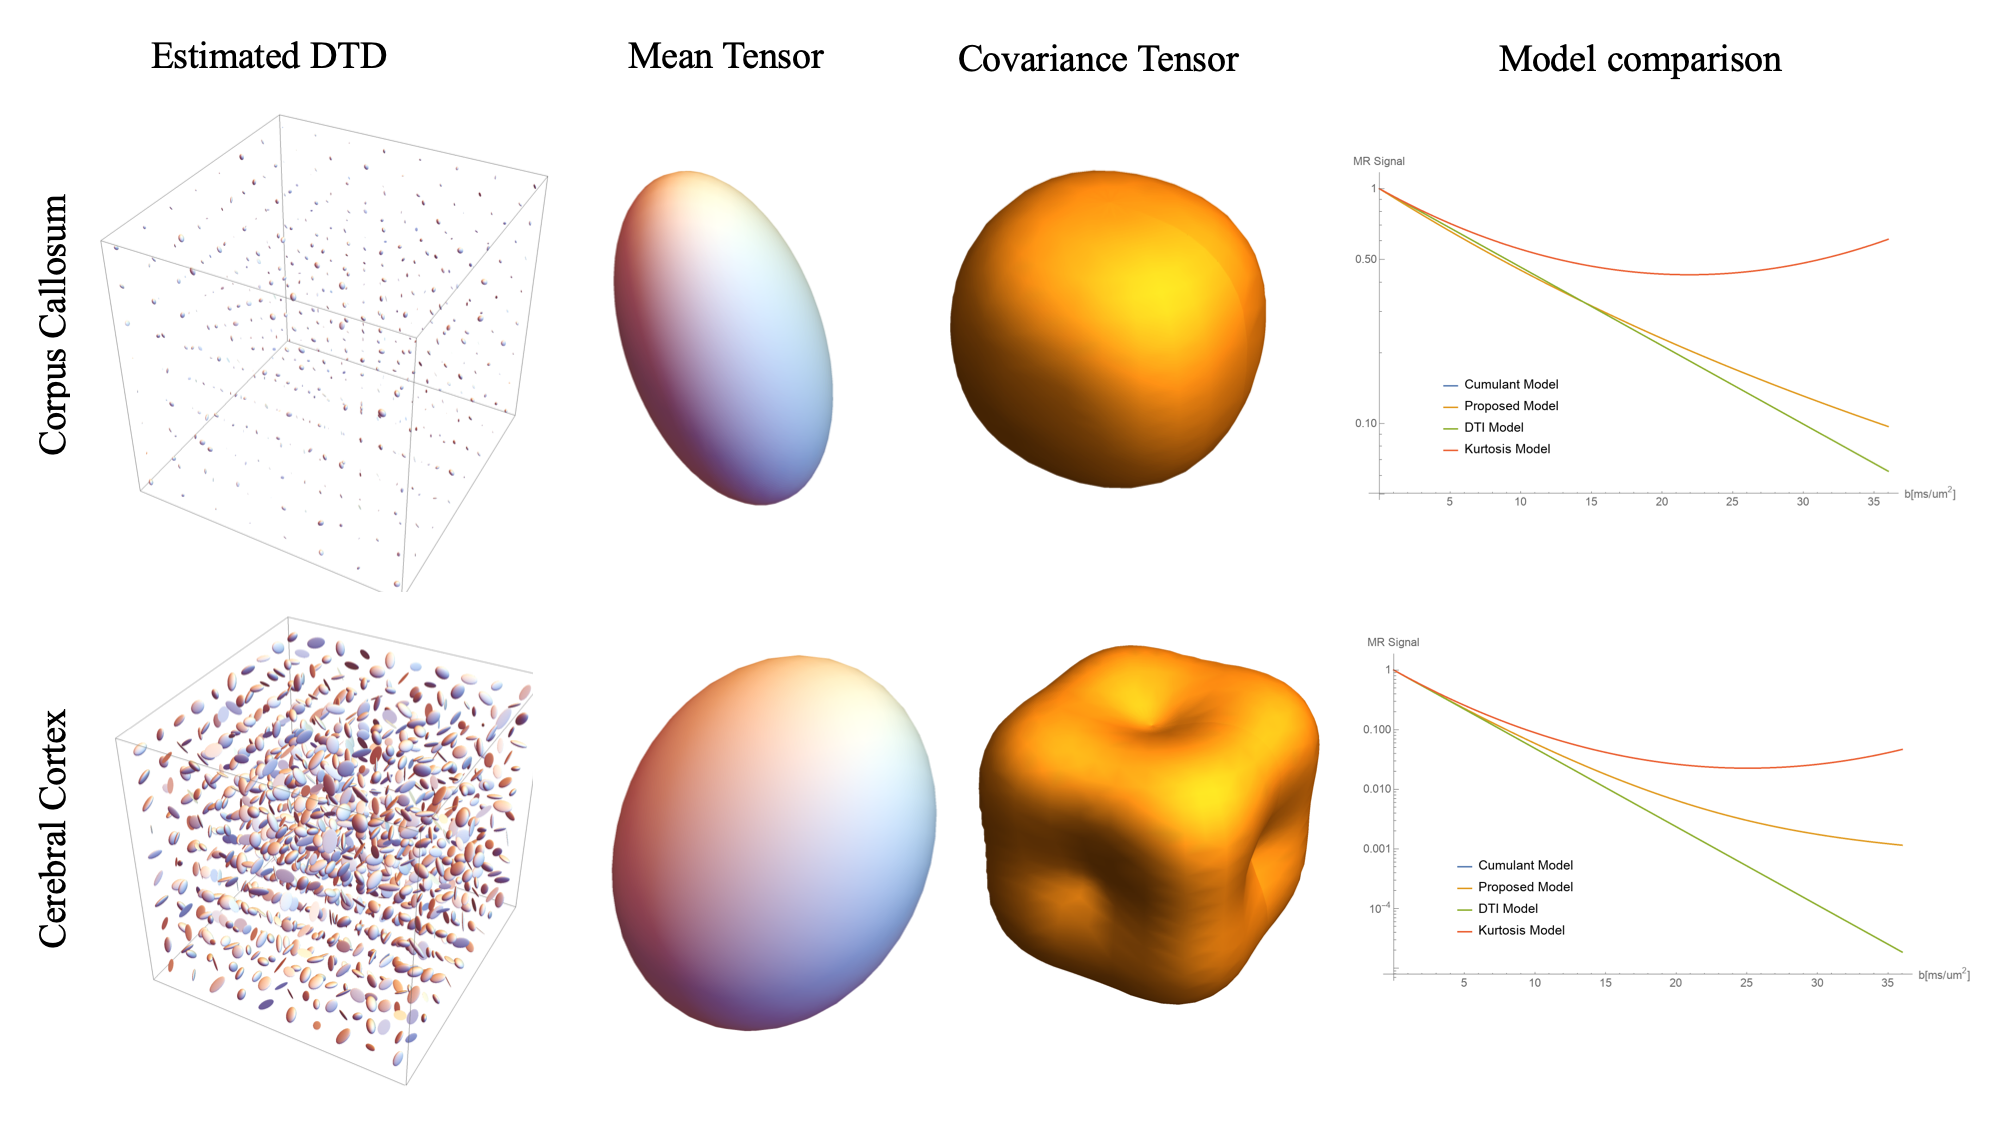
The results obtained from the PDMS data are shown in Figure 3. The average diffusivity of PDMS was 0.172 at 15°C consistent with published results [9]. The DTD obtained by picking samples from the constrained multinormal distribution with estimated mean and covariance at the center voxel was approximately spherical as shown in Figure 3 with small deviations due to measurement uncertainty. The FA and maps were close to zero consistent with the DTD being a delta function. The μAD and macro-AD maps are the same, as expected, since the average diffusivity operator is linear and can be commuted. The results from the rat brain data are shown in Figures 4 and 5. FA and μFA was high and equal in corpus callosum as expected. μFA was high in brainstem and cerebellum perhaps due to their heterogeneous microstructure. The plot of the signal vs b-value using various models based on the estimated DTD (Figure 5) shows the kurtosis and cumulant models fail around b = 15,000 s/mm2 in corpus callosum showing its limitation.Conclusion
A new b-matrix encoding strategy is introduced to estimate mean and covariance tensors of a new DTD model, which is easy to implement, efficient, and immune from concomitant field artifacts. The MRI pulse sequences retain well-defined diffusion and mixing times and pulsed gradient durations, which can be used to probe the DTD’s possible time-dependence systematically.Acknowledgements
This work was funded by the Intramural Research Program of the Eunice Kennedy Shriver National Institute of Child Health and Human Development, and with some support from the NIH BRAIN Initiative: “Connectome 2.0: Developing the next generation human MRI scanner for bridging studies of the micro-, meso- and macro-connectome”, 1U01EB026996-01. We would like to thank Dan Benjamini for insightful discussions.References
[1] P. J. Basser and S. Pajevic, “Spectral decomposition of a 4th-order covariance tensor: Applications to diffusion tensor MRI,” Signal Processing, vol. 87, no. 2, pp. 220–236, Feb. 2007.
[2] C.-F. Westin et al., “Q-space trajectory imaging for multidimensional diffusion MRI of the human brain,” Neuroimage, vol. 135, pp. 345–362, Jul. 2016.
[3] E. Özarslan, M. E. Komlosh, M. J. Lizak, F. Horkay, and P. J. Basser, “Double pulsed field gradient (double-PFG) MR imaging (MRI) as a means to measure the size of plant cells,” Magn. Reson. Chem., vol. 49, pp. S79–S84, Dec. 2011.
[4] D. Cory, A. N. Garroway, and J. B. Miller, “Applications of spin transport as a probe of local geometry,” in Proceedings of the American Chemical Society, 1990, pp. 149–150.
[5] F. Szczepankiewicz, C. Westin, and M. Nilsson, “Maxwell‐compensated design of asymmetric gradient waveforms for tensor‐valued diffusion encoding,” Magn. Reson. Med., vol. 82, no. 4, p. mrm.27828, May 2019.
[6] M. A. Bernstein, K. F. King, and X. J. Zhou, Handbook of MRI Pulse Sequences. Elsevier, 2004.
[7] J. H. Jensen, J. A. Helpern, A. Ramani, H. Lu, and K. Kaczynski, “Diffusional kurtosis imaging: The quantification of non-gaussian water diffusion by means of magnetic resonance imaging,” Magn. Reson. Med., vol. 53, no. 6, pp. 1432–1440, Jun. 2005.
[8] L. Zhan et al., “A novel measure of fractional anisotropy based on the tensor distribution function,” in Lecture Notes in Computer Science (including subseries Lecture Notes in Artificial Intelligence and Lecture Notes in Bioinformatics), 2009, vol. 5761 LNCS, no. PART 1, pp. 845–852.
[9] T. Cosgrove, P. C. Griffiths, J. Hollingshurst, R. D. C. Richards, and J. A. Semiyen, “Self-Diffusion and Spin-Spin Relaxation in Cyclic and Linear Polydimethylsiloxane melts,” Macromolecules, vol. 25, no. 25, pp. 6761–6764, Dec. 1992.
Figures