4448
Comprehensive analysis of full-spectrum diffusion weighted MR images with Multimodal Anomalous Diffusion Method (MAD)1Radiology, University of Illinois at Chicago, CHICAGO, IL, United States
Synopsis
In physiological and pathological conditions in which multiple underlying tissue properties are expected to vary the diffusion weighted signal, the diagnostic value of conventional apparent diffusion coefficient (ADC) notably decreases. By fully dissecting the whole spectrum of diffusion weighted imaging (DWI) data from low to high b‑values, we developed a method to extract the anomalous diffusion parameters for four water milieus: flow, and, unrestricted, restricted, and highly restricted diffusion, thus, expounding upon the diverse diffusivity within a voxel.
Purpose
In physiological and pathological conditions in which multiple underlying tissue properties are expected to vary the diffusion weighted signal, the diagnostic value of conventional apparent diffusion coefficient (ADC) notably decreases. By fully dissecting the whole spectrum of diffusion weighted imaging (DWI) signal from low to high b‑values, we developed a multimodal model to capture the anomalous diffusion properties of four water milieus, including flow with D >> 3 µm2/ms, and, unrestricted diffusion with D ≈ 3 µm2/ms, restricted diffusion with 0.1 µm2/ms < D < 3 µm2/ms, and highly restricted diffusion with D << 0.1 µm2/ms; each water milieu being explained by an anomalous diffusion stretch exponential model [1,2,3]. In this preliminary study, we have studied healthy subjects and tumor patients to test this method’s feasibility and to explore the potential utilities of this novel approach.Methods
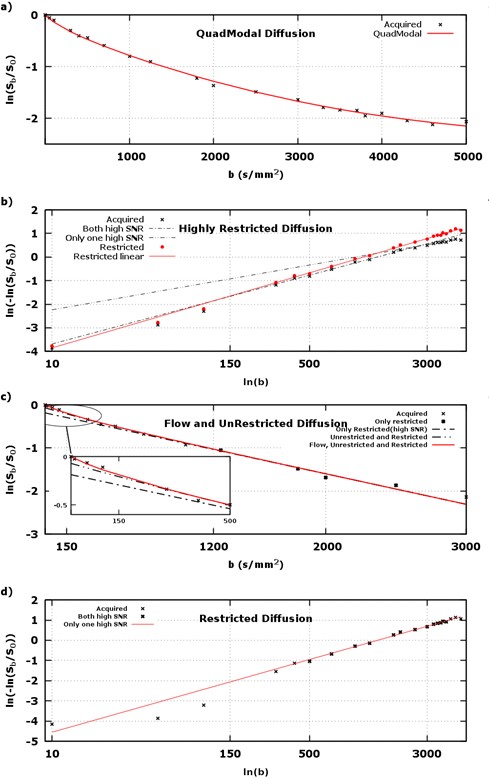
Under an approved IRB protocol, full spectrum of diffusion weighted images were acquired from healthy subjects (n=3) and tumor patients (n=9), using 22 b‑values from 0 to 5000 s/mm2, in 9 minutes, on a 3T MRI scanner (GE MR750). In this study, DWI data was modeled voxel-wise as a sum of four stretch exponential modes: flow (fF, DF, αF=1), unrestricted (fUR, DUR=3 µm2/ms, αUR=1), restricted (fR, DR, αR), and highly restricted (fHR, DHR = 0.0001 µm2/ms, αHR=1), where fx is the fraction of voxel attenuation explained by mode x, Dx is the diffusivity, and αx is the distribution shape narrowness (from 0.5 – uniform distribution, to 1 – delta function, i.e., monoexponential). Parameters that cannot be determined empirically were fixed as specified. Regression of DWI voxel signals was performed using successive linearized fitting with a Theil-Sen linear regressor, thusly, the stretch exponential, $$$ S_b / S_0 = e^{ -(b \cdot D_x)^{\alpha_x} } $$$, was be linearized to, $$$ \ln \left (− \ln \left ({{S_b}} / {{S_0}} \right ) \right ) = {α_x} \ln b + {α_x} \ln {D_x} $$$, and given these two postulates ( μN– noise floor),$$ \ln \left ({f_1} {e} ^ {− {\left (b ⋅ {D_1} \right )} ^ {{α_1}}} + {f_2} {e} ^ {− {\left (b ⋅ {D_2} \right )} ^ {{α_2}}} \right ) ≃ {α_3} \ln b + {α_3} \ln {D_3} {\phantom :}:{\phantom :} {D_2} ≪ {D_1} {\phantom \&}\&{\phantom \&} {f_1} {e} ^ {− {\left (b ⋅ {D_1} \right )} ^ {{α_1}}} , {f_2} {e} ^ {− {\left (b ⋅ {D_2} \right )} ^ {{α_2}}} ≫ {μ_N} {\phantom \sin} (1) $$ and, $$ \ln \left ({f_1} {e} ^ {− b \cdot {D_1}} + {f_2} {e} ^ {− b \cdot {D_2}} \right ) ≃ \ln {f_2} − b ⋅ {D_2} {\phantom :}:{\phantom :} {D_1} ≫ {D_2} {\phantom \&}\&{\phantom \&} {f_1} {e} ^ {− b ⋅ {D_1}} ≪ {μ_N} {\phantom \&}\&{\phantom \&} {f_2} {e} ^ {− b \cdot {D_2}} ≫ {μ_N} {\phantom \sin} (2) $$
each voxel’s linearized diffusion signal was examined for its deviation from linearity. Figure 1 shows empirical justification for aforementioned water milieus.
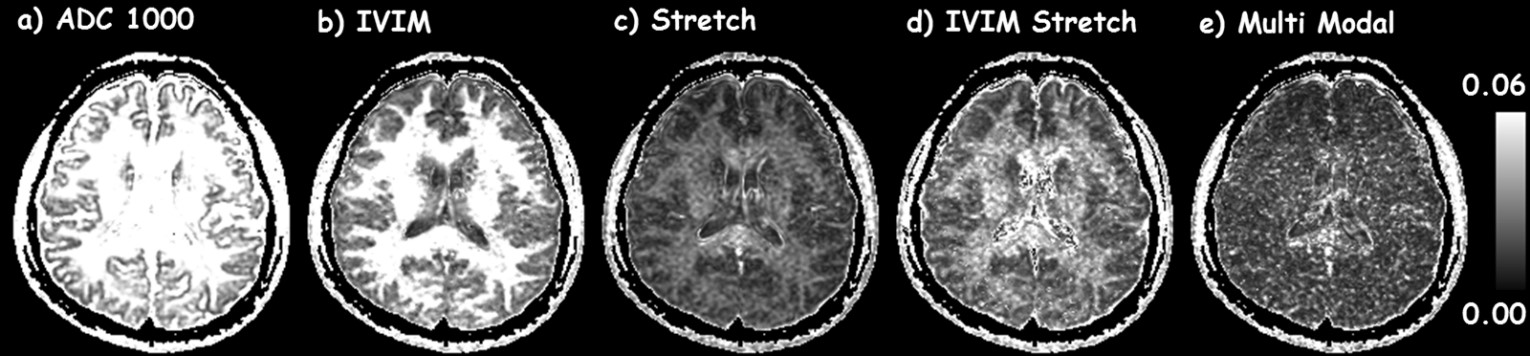
For comparison, ADC, IVIM [4], single stretch exponential, and IVIM-stretch exponential models were fit to the same diffusion dataset(s). To understand each model’s fidelity at representing the underlying diffusivity, root mean squared residual (ψ) maps for all models were computed over the entire range of b‑values (figure 2) for a healthy human brain.
Results
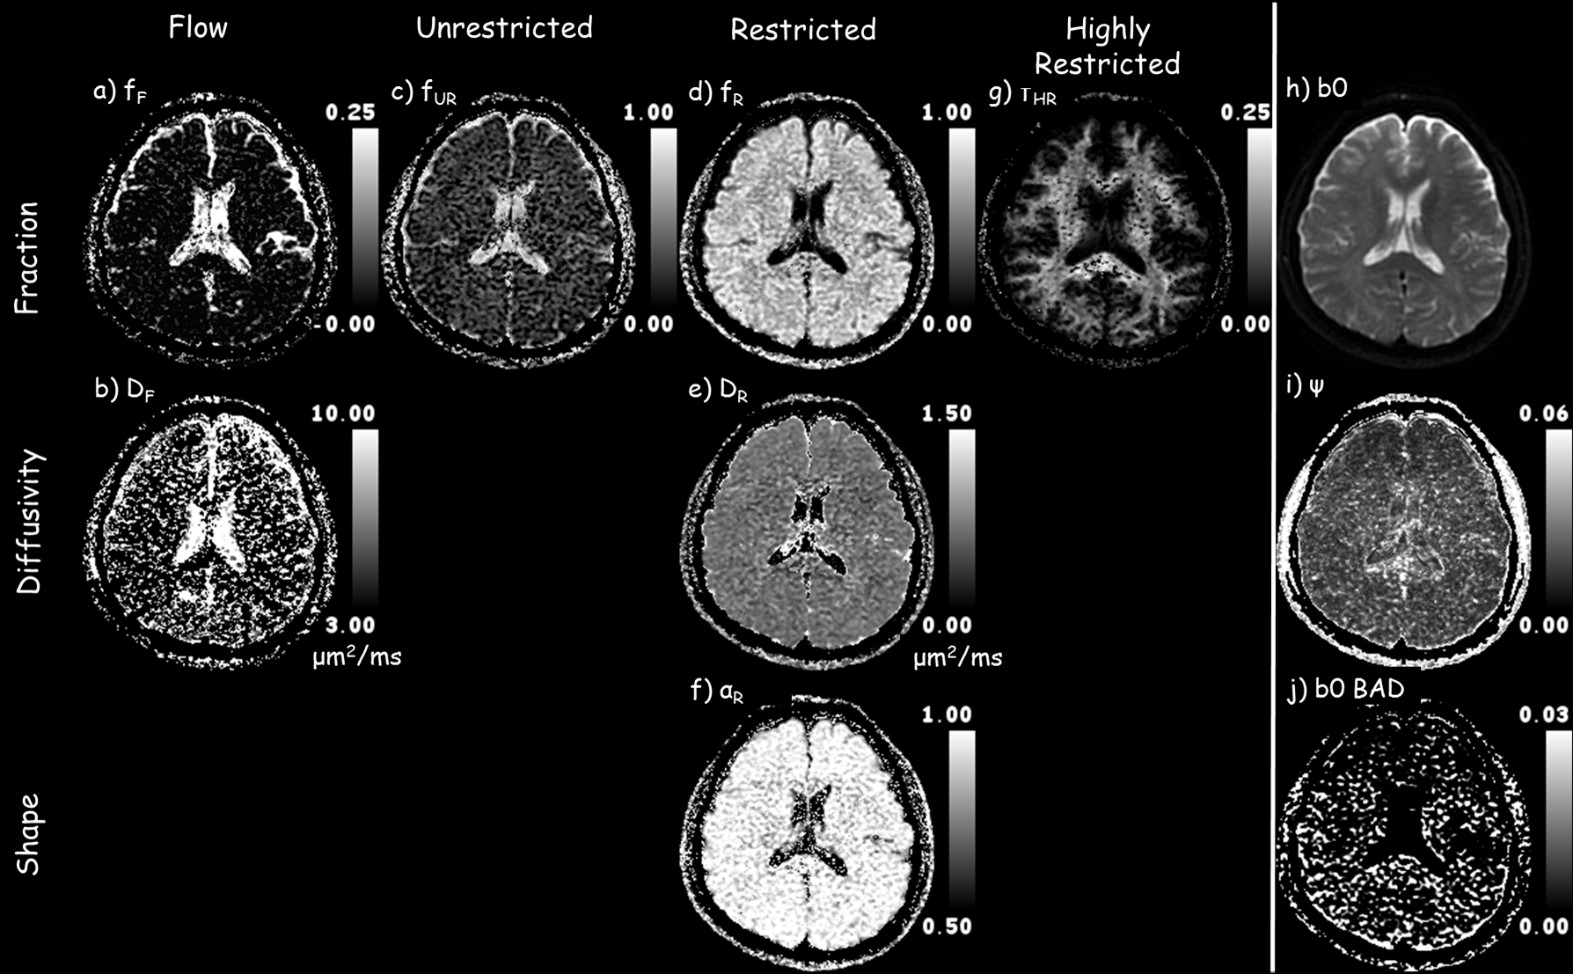
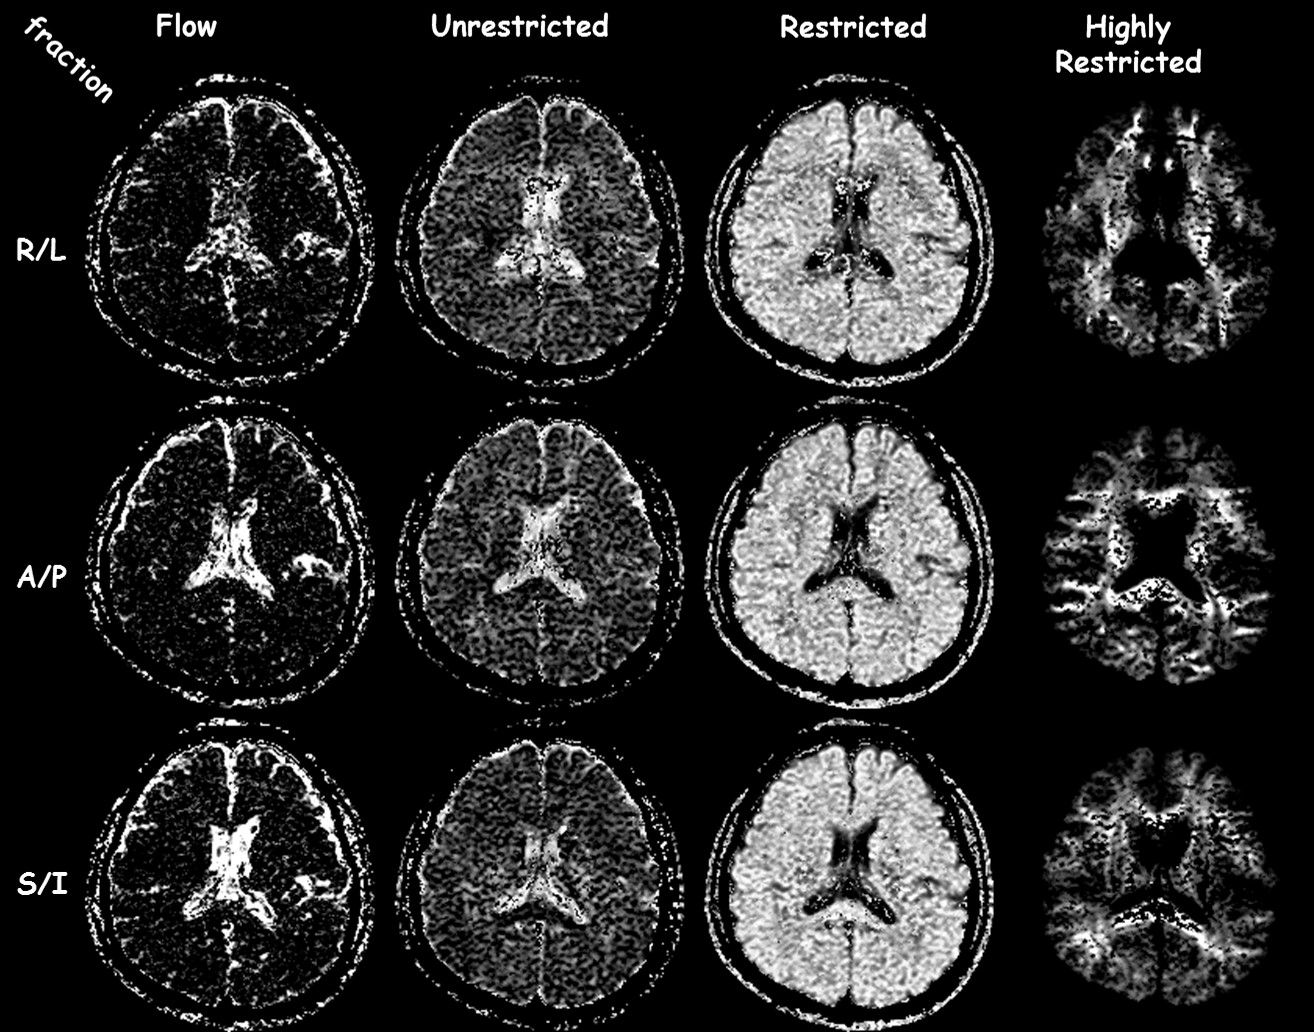
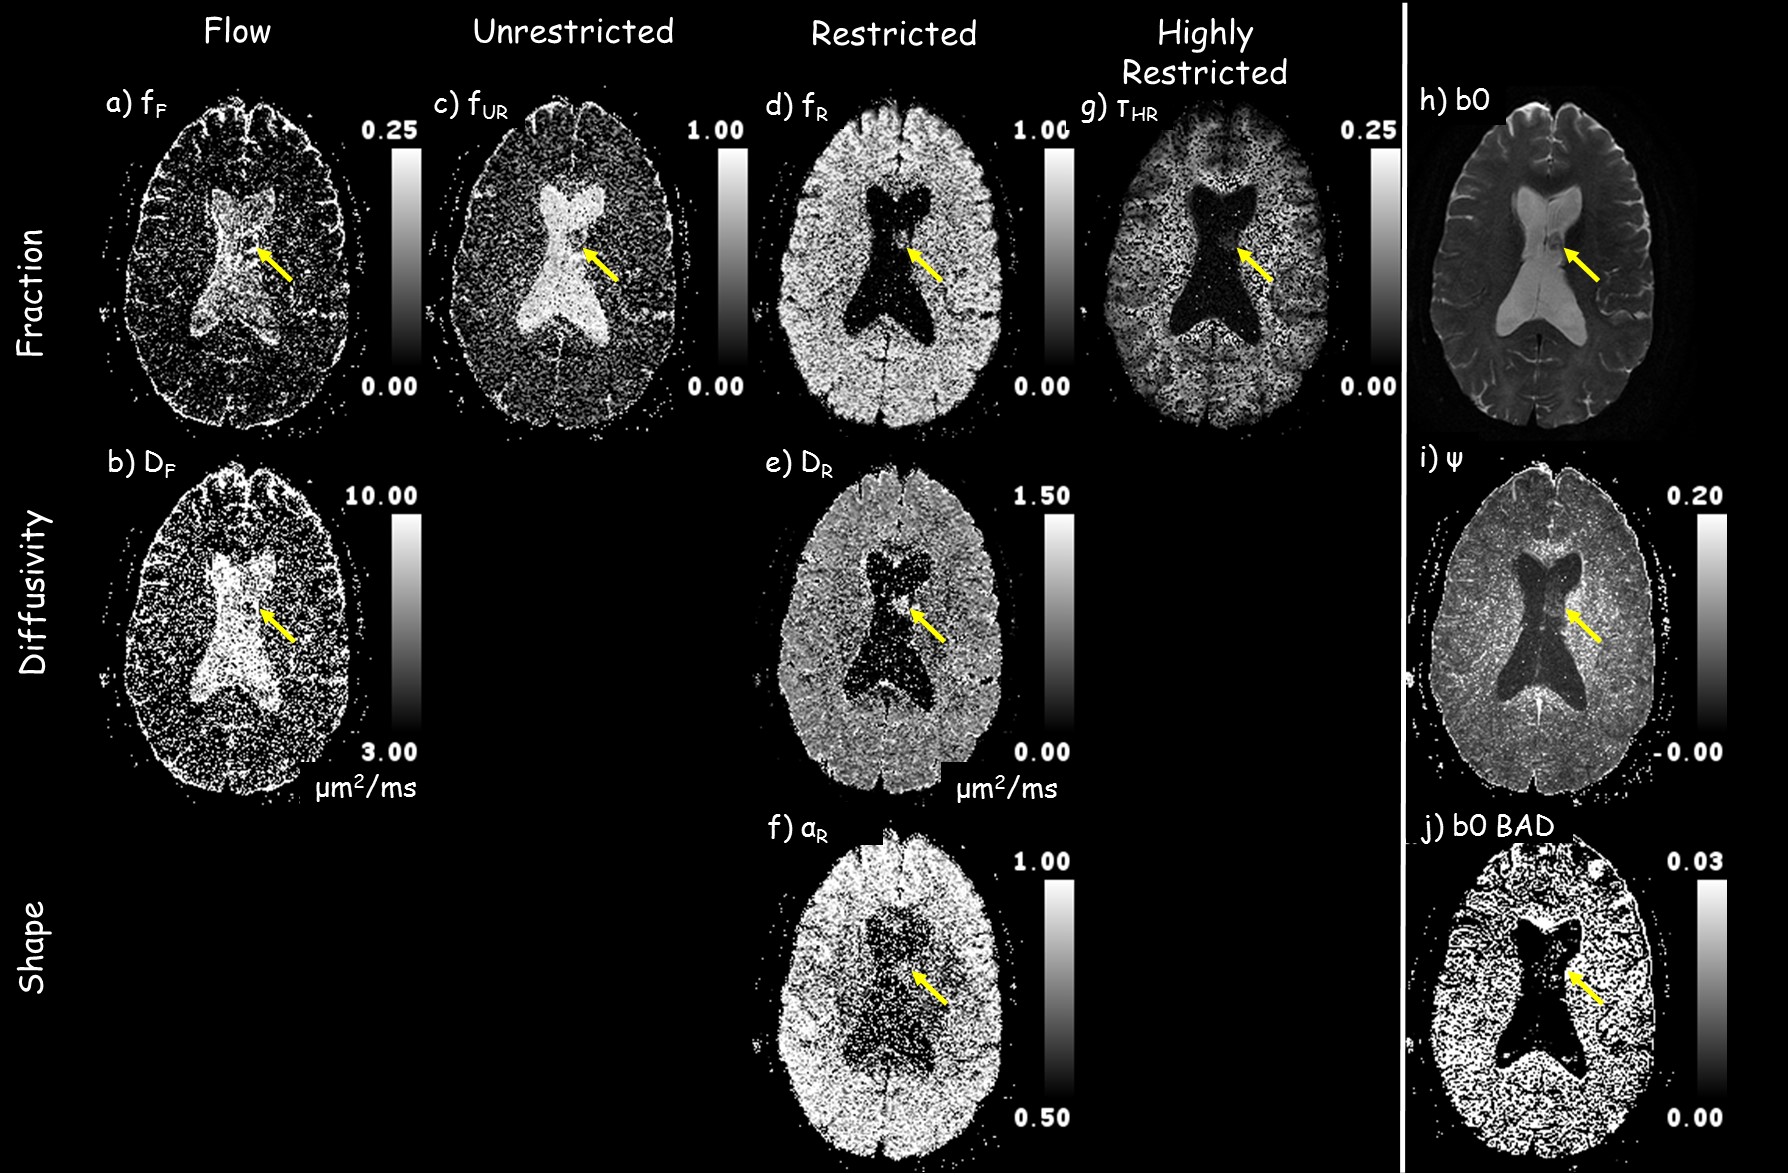
Figure 2 shows that the ADC model overall has the highest residuals, i.e., lowest fidelity in representing the underlying signal. The IVIM model is better at separating flow/fluid from tissue. By incorporating a single stretch exponential model more of the diffusivity variability is captured. All models, except the proposed model, had elevated residuals in white matter. The proposed multimodal model’s residuals do not appear to correlate with anatomy, except for high contrast borders that may have been compromised by physiological undulation or mechanical vibrations. The proposed model parameter maps, figure 3, exhibit expected visual correlation to anatomy. White matter fiber tracts show concomitant exchange of anisotropy in the unrestricted, restricted and highly-restricted diffusion modes as seen on the individual diffusion-gradient-direction fraction maps – see figure 4; plausibly the intra-fiber and intra-myelin-sheath milieus, respectively. The relative location of voids within the highly-restricted diffusion, figure 3g, and their correspondence with increased amounts of flow and unrestricted diffusion, figure 3a,c respectively, are consistent with white matter blood vessels. Intravoxel separation of grey matter – restricted diffusion, and CSF – flow/unrestricted diffusion, follow sulci/gyri boundaries. Voxels with pulsatile flow corruption were also identified, figure 3j. An example patient, see figure 5, 58yo female with a ventricular mass of unknown origin, radiologist presumed low grade tumor, shows multimodal parameters consistent with diagnosis; an inhomogeneous mass with elevated diffusivity, partial volumed with fluid and flow, with signs of highly restricted diffusion, see figure 5 for parameter values.Conclusion
This study demonstrated the feasibility of an enhanced multimodel diffusion MRI with the comprehensive analysis of full spectrum DWI data. With further validation, this method may be explored for better characterization of microstructures of human brains under healthy and diseased conditions, such as the measurement of demyelination, perivascular space enlargement, cortical grey matter lesions, tumor diagnosis and treatment follow-ups – radiation necrosis vs reoccurrence, and, edema vs. infiltrate, etc.Acknowledgements
This work was supported by NIH grants R21EB023516, R01AG061114, and R21AG053876.References
1) Magin, et.al., J, Magn, Reson. 2008;190:255-270.
2) Köpf, et.al., Biophys. J. 1996;70:2950-2958.
3) Bennett, et.al., Magn.Reson. Med. 2003;50:727-734.
4) Le Bihan, et.al., Radiology 1986;161:401-407.
Figures