4445
Apparent exchange rate (AXR) mapping: Influence of extracellular volume fraction and membrane permeability1Department of Medical Physics in Radiology, German Cancer Research Center (DKFZ), Heidelberg, Germany, 2Faculty of Physics and Astronomy, Heidelberg University, Heidelberg, Germany, 3Institute of Radiology, University Hospital Erlangen, Friedrich-Alexander-Universität Erlangen-Nürnberg (FAU), Erlangen, Germany, 4Molecular Structure Analysis, German Cancer Research Center (DKFZ), Heidelberg, Germany
Synopsis
Apparent exchange rate (AXR) mapping can be used to non-invasively investigate water exchange between the intra- and extracellular compartment, which might yield insight into cell membrane permeability. However, the measured AXR is also significantly influenced by intra- and extracellular water fractions. In this study, using simulations and experiments with yeast cells, we show that – for low cell concentrations – the AXR exhibits only a moderate dependence on the cell concentration, while for high concentrations, a stronger influence of the packing density on AXR occurs so that it becomes more difficult to disentangle these two influencing parameters.
Introduction
The permeability of cell membranes is an important biological parameter, which might be changed in pathologies. Recently, apparent exchange rate (AXR) mapping has been introduced, which might allow gaining access to this quantity non-invasively1,2. However, AXR is not only related to membrane permeability but also to the packing density of cells so that the contribution of these parameters might be unclear. In this study, we investigated the influence of the packing density and the permeability on the AXR using theoretical analysis, simulations and measurements with yeast cells.Methods
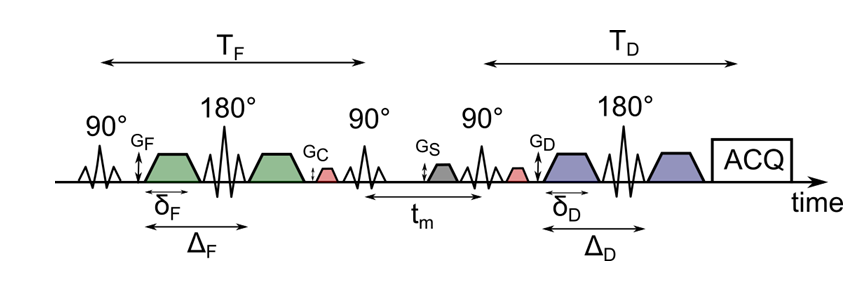
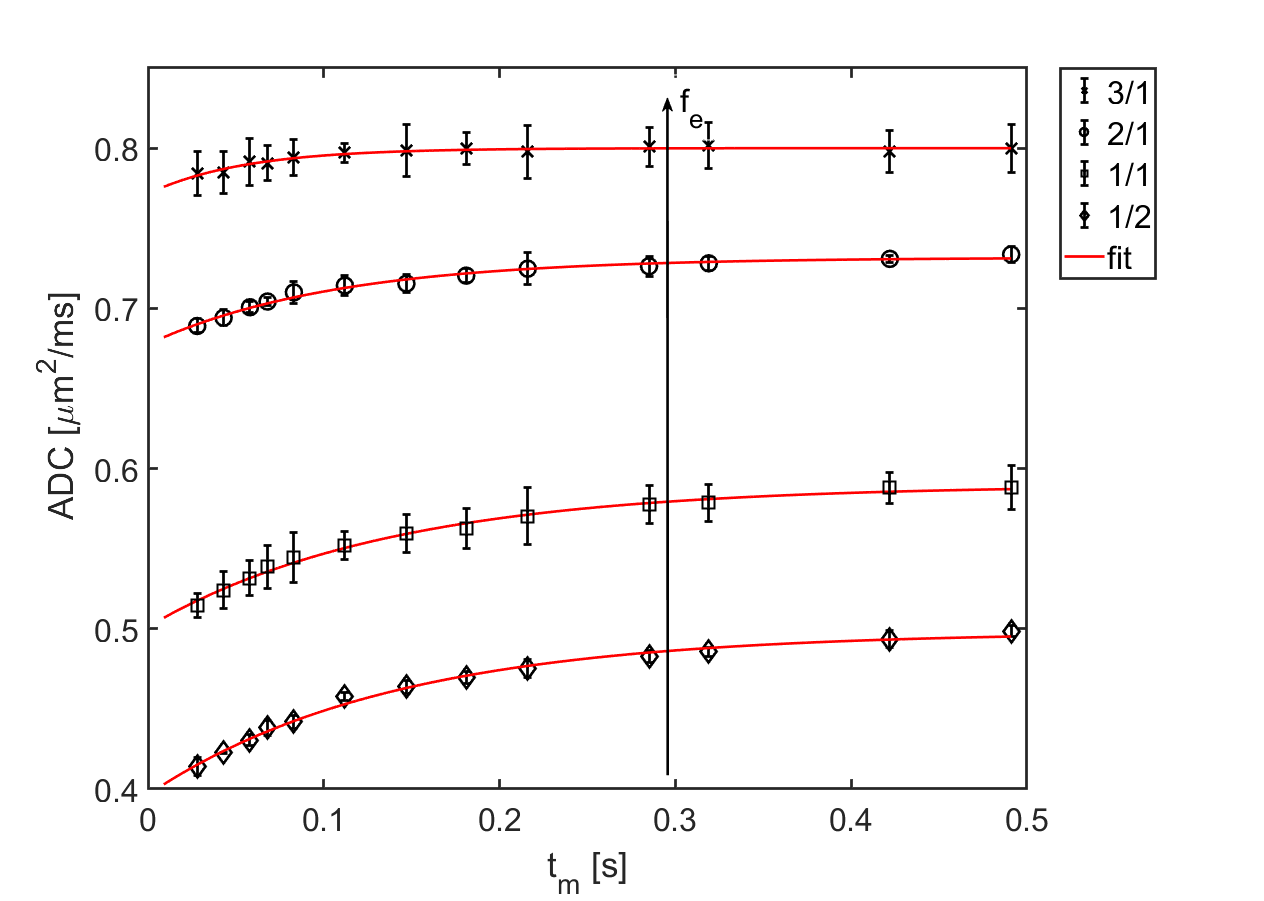
Experiments were carried out on a BRUKER 600 MHz spectrometer. A schematic representation of the used AXR sequence can be found in Figure 1. Yeast suspension phantoms were produced using fresh baker’s yeast which was dissolved in tap water in 3/1, 2/1, 1/1 and 1/2 water/yeast weight ratios. The measurements were performed at 280 K in order to prevent the yeast from budding and keep the ratio stable. To evaluate the AXR for each sample, apparent diffusion coefficient (ADC) values for different mixing times tm (Fig. 1) ranging from 28 ms to 491 ms were determined. For each mixing time, five b-values ranging from 37 s/mm2 to 930 s/mm2 were acquired. Gradient duration for the filter block was set to δF = 7.3 ms with an echo time of TF = 21.1 ms while the diffusion weighting was set to δD = 7.8 ms with TD = 22.4 ms. The time between the onsets of the filter and diffusion gradients was ΔF = 9.7 ms and ΔD = 10.2 ms, respectively. The b-value of the filter was set to 1989 s/mm². A spoiler gradient with GS = 0.07 T/m and a duration of 5.3 ms was used. The gradients to choose the right echo path were run with GC = 0.05 T/m for a duration of 1.3 ms. The used fit function yielding the AXR values is $$ADC = ADC_{\mathrm{eq}} (1-\sigma \exp(-AXR\,t_m))\quad(1)$$ where ADCeq is the equilibrium ADC observable in the limit of very long tm and σ the filter efficiency.Simulations were carried out using a GPU accelerated Monte Carlo simulation approach3. Yeast cells were represented as ellipsoids with the semi-axes a = 2.725 µm and b = c = 1.875 µm, which was roughly estimated from microscopic images of the used yeast suspensions. The ellipsoids were randomly distributed within a volume of (100 µm)3. Diffusion coefficients were set to Di = 0.625 µm2/ms for intracellular space and De = 1.25 µm2/ms for the extracellular fraction. The step size of the simulation was set to dt = 1 µs, the number of simulated particles was set to 75000 to roughly match the SNR of the measurements. For each packing density, 4 averages with 8 mixing times were simulated with the membrane permeabilities ρ = 0.007 µm/ms, ρ = 0.005 µm/ms and ρ = 0.003 µm/ms. Packing densities characterized by the extracellular volume fraction fe ranged from fe = 0.93 to fe = 0.71, which roughly matches the yeast samples, assuming an amount of 6.2*109 cells per gram baker’s yeast. The theoretical reference AXR values were calculated using $$AXR_{\mathrm{reference}}=\rho\frac{S_{\mathrm{cell}}}{V_{\mathrm{cell}}}\frac{1}{f_{e}} \quad (2) $$ where Scell is the surface and Vcell the volume of the cell and $$$f_{e}=(V_{\mathrm{total}}-V_{\mathrm{intracellular}})/V_{\mathrm{total}}$$$.
Results
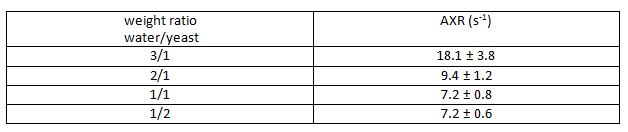
The obtained experimental ADC curves for each considered weight ratio are shown in Figure 2, the obtained AXR values in Table 1. As expected, the ADC value is decreasing with increasing amount of yeast which is corresponding to a smaller extracellular fraction fe. For low yeast concentrations, only very small ADC changes occur making AXR determination unreliable for the lowest yeast concentration (3/1 in Fig. 2). The AXR values for the remaining three ratios do not exhibit significant differences within the 2 sigma confidence interval. Simulated and experimental AXR values with the corresponding theoretical values obtained from Eq. (2) are shown in Figure 3. The measured AXR values match the order of magnitude obtained from theory and simulations with very rough assumptions on packaging density and permeability. For low concentration, i.e. high fe, the dependence of AXR on fe is rather weak while the slope of the curve is considerably higher for small fe. In accordance with the experiment, the simulated values for the lower yeast concentrations also depict large errors and discrepancies from the theoretical values.Discussion and Conclusion
It could be shown that the AXR is mainly influenced by permeability changes for low packaging density of cells, while changes in the cell concentration lead to moderate variation, which was also observed for the cell experiments. In this experimental range, it could be possible to relate AXR changes mainly to permeability changes, while, for low fe, a high sensitivity to volume fraction changes is to be expected which might be useful to detect e.g. tumors implying changes in fe. Limitations include the very rough estimation of fe in the yeast samples with basic assumptions, which might be resolved by flow cytometry. Further, especially for small tm, undesired coherence pathways may disturb the signal. The very small ADC changes for low concentrations may lead to unreliable AXR measurements requiring very high SNR.Acknowledgements
Financial support by the DFG (Grant No. KU 3362/1-1) is gratefully acknowledged.References
[1] Lasič, Samo, et al. Apparent exchange rate mapping with diffusion MRI. Magnetic Resonance in Medicine. 2011;66(2):356-365.
[2] Nilsson, Markus, et al. Noninvasive mapping of water diffusional exchange in the human brain using filter‐exchange imaging. Magnetic Resonance in Medicine. 2013;69.(6):1572-1580.
[3] Ludwig, Dominik, et al. Apparent exchange rate mapping: relation to membrane permeability. ISMRM Annual Meeting. 2018; E-Poster #3231
Figures