4444
What’s the FWAF? A Finite Width Adjustment Factor for the effect of finite pulse duration on the diffusion signal in impermeable cylinders1National Physical Laboratory, Teddington, United Kingdom, 2UCL Great Ormond Street Institute of Child Health, University College London, London, United Kingdom
Synopsis
A common approach to microstructure imaging in diffusion MRI is to fit the signal with a weighted sum of geometric compartments. This approach is widespread but the need for analytical closed-form solutions necessitates highly restrictive assumptions about the underlying physics which are rarely met in practice. In particular, violation of the narrow-pulse approximation is a significant potential source of bias. This abstract investigates the effect of violating the narrow pulse approximation numerically and proposes a simple effect correction factor to reduce apparent bias as a scale factor on q as a function of δ.
Introduction
Diffusion MRI data is known to contain information about small-scale tissue structure. In particular, multi-shell b-value data has been used to infer geometric details which have potential as biomarkers of pathology.1 One frequent approach is to assume the signal is a weighted sum of two or more non-exchanging compartments for which analytical approximations are available and to fit the parameters to a set of observations. This approach is widespread but is known to be flawed. The constraints of requiring a closed analytical form for compartments necessitates highly restrictive assumptions regarding both geometry and spin physics.One aspect which has received relatively little attention is the effect of finite pulse duration on microstructural estimates. To obtain analytical expressions for diffusion in restricting geometries it is often necessary to assume either that diffusion-encoding pulses are infinitely short or that the spin phase distribution is Gaussian. This study investigates the effect of finite pulse duration on the diffusion signal in impermeable cylinders. We reproduce a previous result from the literature demonstrating a shift in the pattern of diffraction minima2,3 and go on to derive an effective rescaling relationship for q as a function of the pulse duration δ. This is a simple relationship which allows signal curves at finite pulse width to be mapped onto those assuming the narrow pulse approximation. We propose that this may be used with in vivo measurements at finite δ to reduce bias in microstructural estimates.
Methods
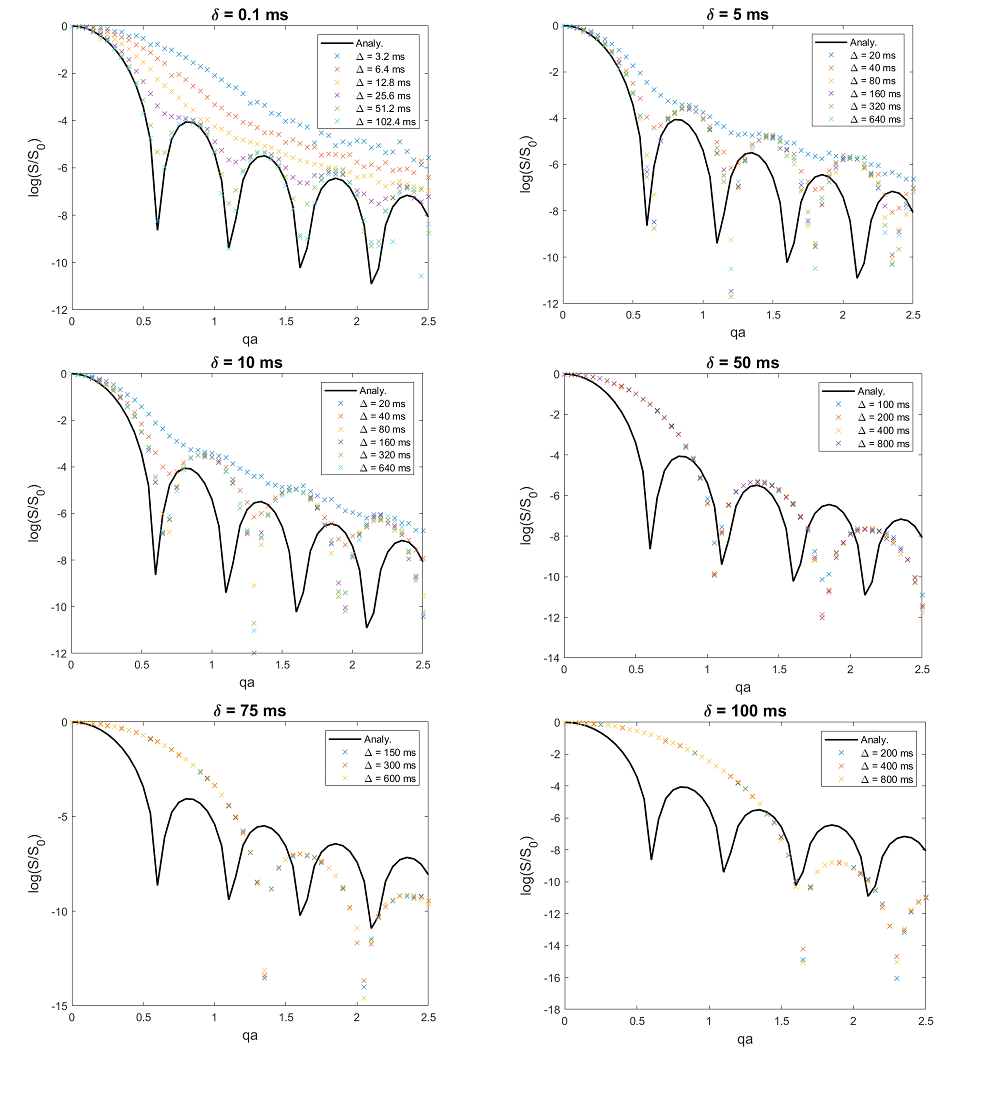
We synthesise diffusion-weighted measurements over a wide range of sequence parameters - q was incremented from 0 to 1 x 10⁵ m-1 in steps of 5 x 10³ m-1, δ in {0.1 0.5 1 2.5 5 10 50 75 100 125 150} ms, and Δ = 2n δ, n = 1,...,10, for all combinations such that δ < Δ - using a finite element model (FEM) of diffusion4,5 in an impermeable cylinder of radius a=10 μm with gradients applied perpendicular to the cylinder axis. FEM simulations were implemented in COMSOL Multiphysics™ 5.4 (COMSOL Group, Stockholm, Sweden). All spins are contained in the intracellular space. We also synthesise the same set of measurements using the closed form solution for diffusion in a cylinder in the long-time limit for diffusion.6Results
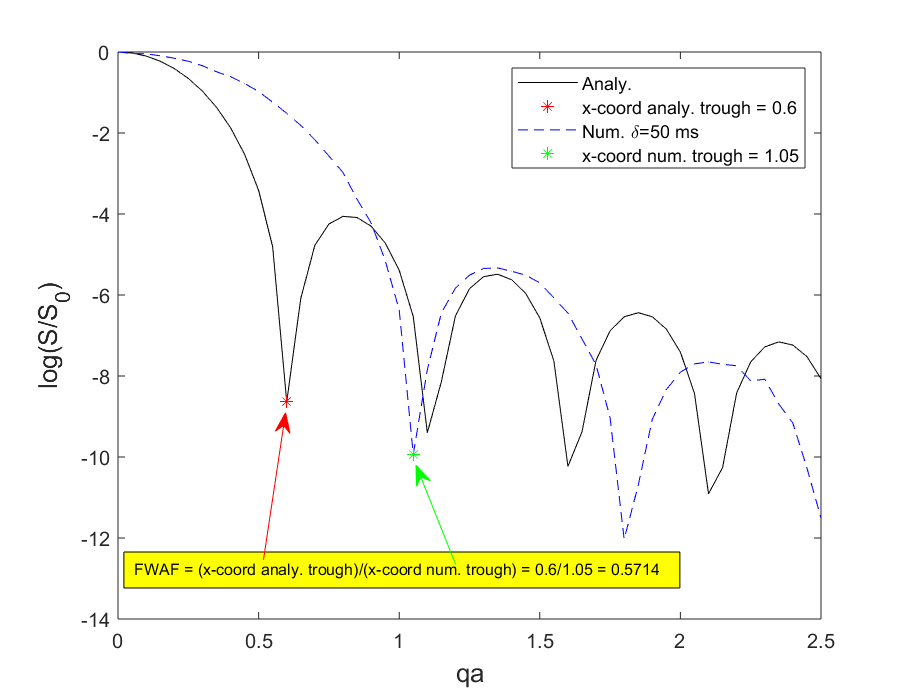
Fig-1 shows the effect of finite pulse duration on the synthetic measurements, plotting normalised signal vs qa. As pulse duration increases, systematic shift is observed whereby minima are shifted further away from the minima of the analytical solution. This is in agreement with [2,3]. For each value of δ, we plot the curves corresponding to the different values of Δ. It is not surprising to observe that for larger values of Δ, better agreement with the long-diffusion-time limit analytical solution is achieved. For this reason, in the calculations that follow we use the highest value of Δ for a particular δ.Fig-2 shows our proposed method of calculating a Finite Width Adjustment Factor (FWAF), as a ratio of x-coordinates of the minima of the analytical vs. numerical solution for each pulse duration.
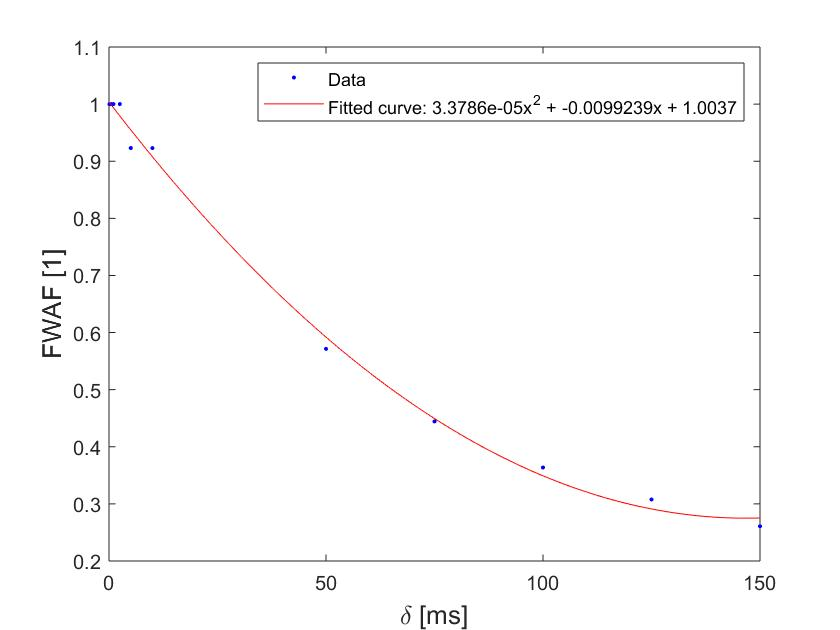
Fig-3 plots the FWAF per curve as a function of δ with a fitted empirical quadratic curve of the form: $$ FWAF = 3.3786 \times 10^{-5}~\delta^2 - 0.0099239~\delta + 1.0037 $$
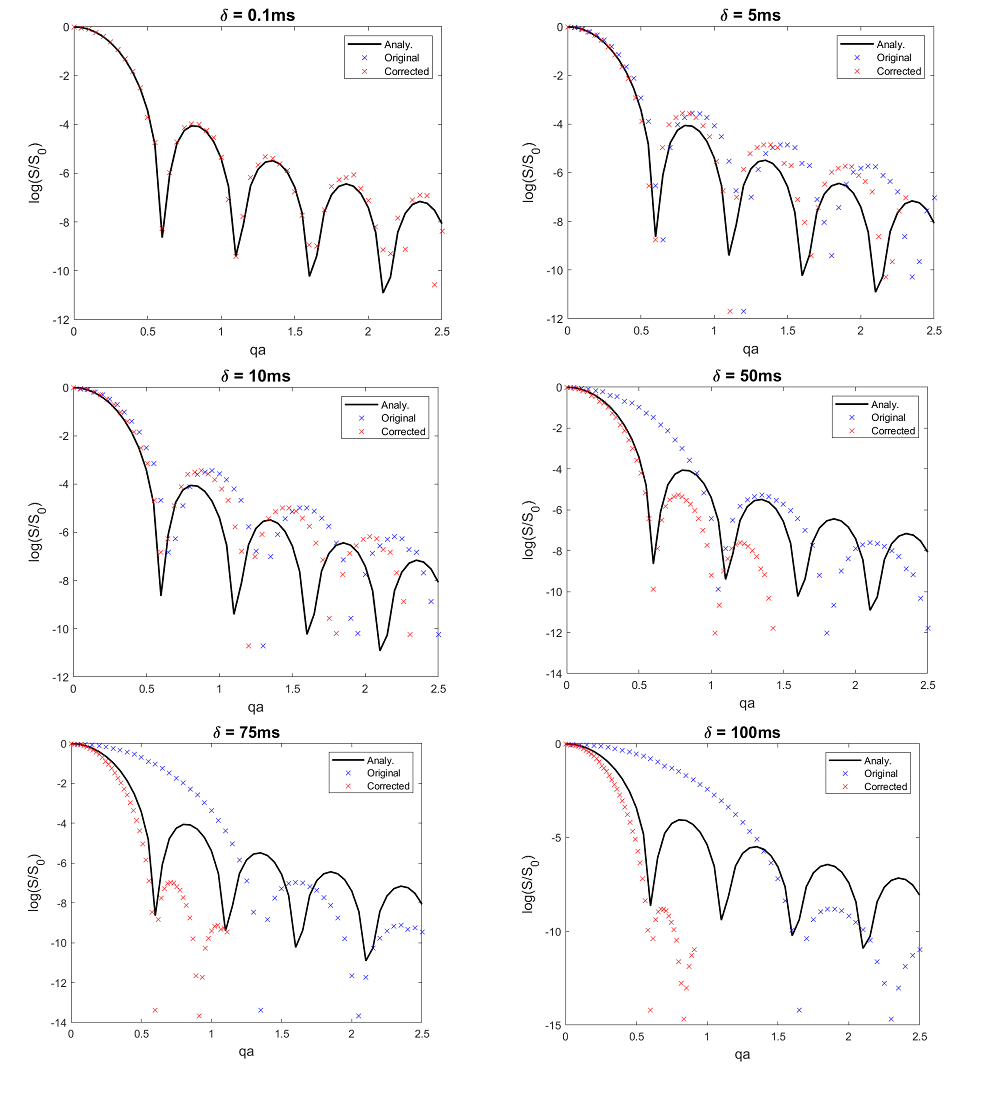
Fig-4 plots the corrected signal curves as a function of qa for different δ values after applying the FWAF to the original curves.
Discussion
These results suggest that the simple geometric models employed in many microstructure models might be more effective if recalibrated to account for finite pulse duration. Eq. 1 can be used a priori to obtain a FWAF for a new acquisition and the scale incorporated into the fitted model. It is not necessary to fit it as an additional parameter. Uncalibrated fits assuming infinitely short pulses will currently be biased if the effect of pulse duration is not taken into account. We note that reproducing the analytical curves in simulation with finite pulse duration requires extremely short gradient pulses. These pulses are not just shorter than those accessible on clinical hardware, but also largely unfeasible on most preclinical systems. Our approach makes the use of narrow pulse approximations more feasible in practical imaging.Further work is required to investigate how sensitive the applied scale factors are with respect to the form of the assumed geometry (e.g. are sphere factors similar to the cylinder factors?) and also to quantify the effect of disorder and heterogeneous packing on this approach. There is no reason, however, why different calibration factors could not be applied in multi-compartment models since these are not required to be fitted along with the other parameters.
Conclusion
The q-scaling approach proposed here appears to work well for pulse durations up to about 40-50ms but becomes less effective for much longer pulses. We note that this is the region of parameter space for which the pulse duration is long enough for spins to explore the entire cylinder.These results are encouraging for developing microstructural inference approaches which reduce the bias of current approaches. This work will now be extended to include different geometries and an extracellular component to examine its robustness to disorder.
Acknowledgements
This work was funded by the department of Business, Engineering and Industrial Strategy through the Data Science theme National Measurement Strategy programme (DS core Modelling and Analytics – Applications, 121577). MGH is partly supported by a research grant from Great Ormond Street Hospital Biomedical Research Centre.References
[1] DS Novikov, E Fieremans, et al. Quantifying brain microstructure with diffusion MRI: Theory and parameter estimation, NMR in Biomed. 2019; 32 (4)
[2] Bar-Shir A, Avrama L, et al. The effect of the diffusion time and pulse gradient duration ratio on the diffraction pattern and the structural information estimated from q-space diffusion MR: Experiments and simulations, J. Magn. Reson. 2008; 194 (2)
[3] Avram L, Özarslan E, et al. Three-dimensional water diffusion in impermeable cylindrical tubes: theory versus experiments. NMR Biomed. 2008; 21: 888–898
[4] Smith N, Talbott J, et al. Simulation based study of the effect of sub-voxel spatial distribution of permeability of muscle fibres as a function of diffusion time and b-value using a finite element model. Presented at ISMRM 2019, Abstract #1272
[5] Moroney B, Stait-Gardner T, et al. Numerical analysis of NMR diffusion measurements in the short gradient pulse limit. J Magnetic Resonance. 2013; 234:165-175
[6] Soderman O, Jonsson B, Restricted Diffusion in Cylindrical Geometry, J. Magn Reson Ser A, 1995; 117 (1)
Figures