4442
Compartment-specific diffusivity: A new dimension in multidimensional diffusion MRI?1Department of Biomedical Engineering, Linköping University, Linköping, Sweden, 2Center for Medical Image Science and Visualization CMIV, Linköping, Sweden
Synopsis
We extend the diffusion tensor distribution imaging framework so that each subdomain making up the tissue is represented by an effective confinement (rather than diffusion) tensor. The confinement tensor is determined by the subdomain’s shape as well as the acquisition parameters and is the physical quantity that leads to microscopic diffusion anisotropy. In this approach, the scalar-valued diffusivity remains as an independent parameter, which could be different in different subdomains. We demonstrate the difficulties in estimating compartment-specific diffusivity alongside the confinement tensor distribution when typical free gradient waveforms are employed.
INTRODUCTION
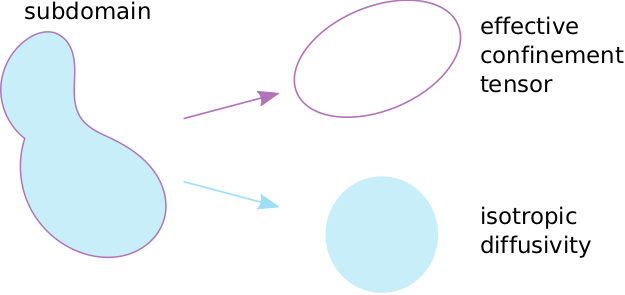
Diffusion tensor distribution imaging1 is currently based on free diffusion within each subdomain. The confinement tensor description was introduced2 to overcome the paradoxical assumptions of distinct compartments and free diffusion within each. It was found later that under certain relevant experimental scenarios, the confinement picture is the effective model of restricted diffusion3. As shown in Figure 1, the shape of the pore is represented by a second order symmetric tensor leaving aside the diffusivity for that subdomain. Here, we incorporate this approach into Multidimensional diffusion MRI and assess the feasibility of obtaining the joint confinement tensor—diffusivity distribution from a commonly employed protocol4 that utilizes free gradient waveforms and publicly available inversion algorithm5.METHODS
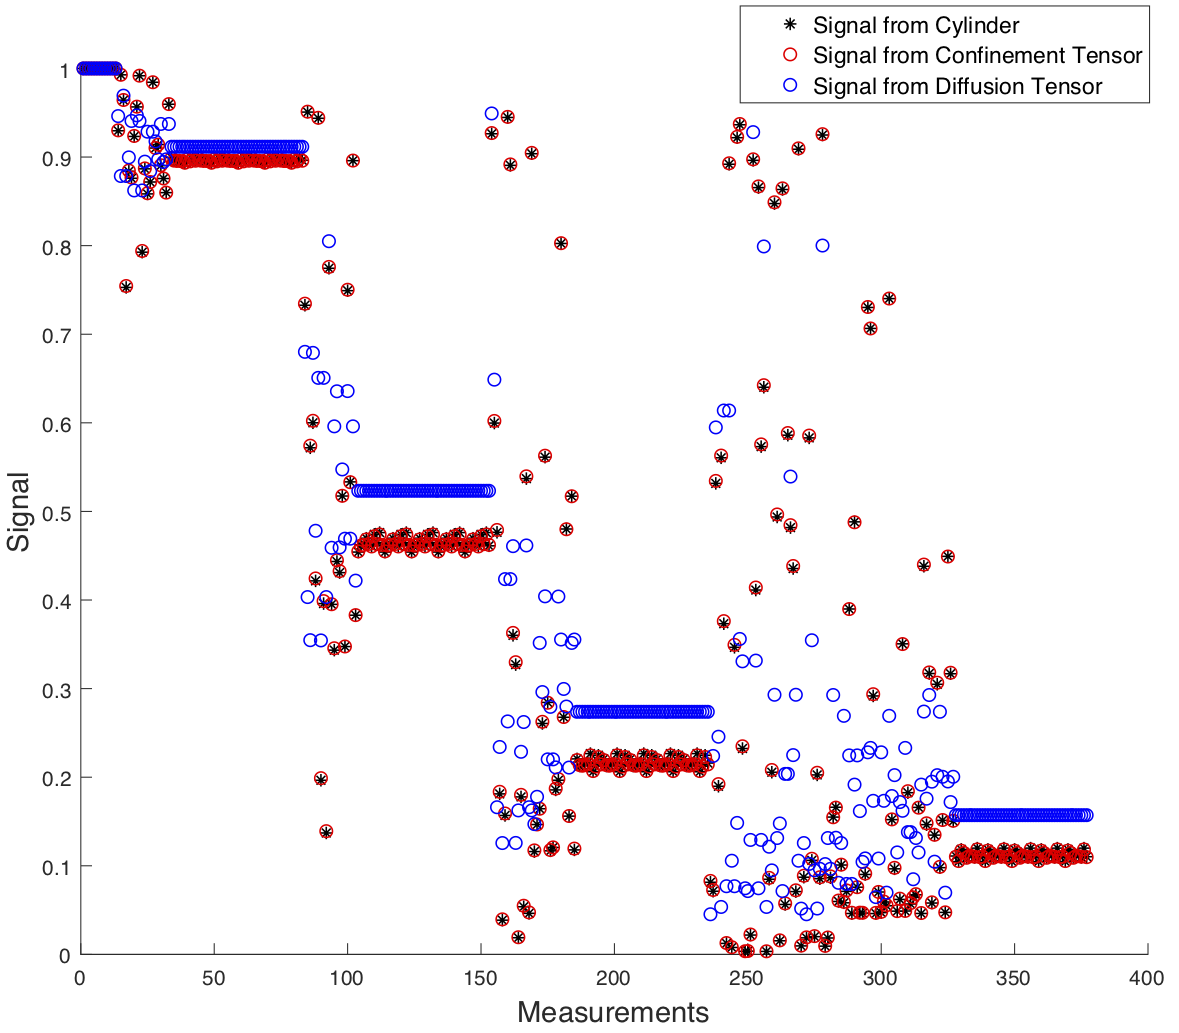
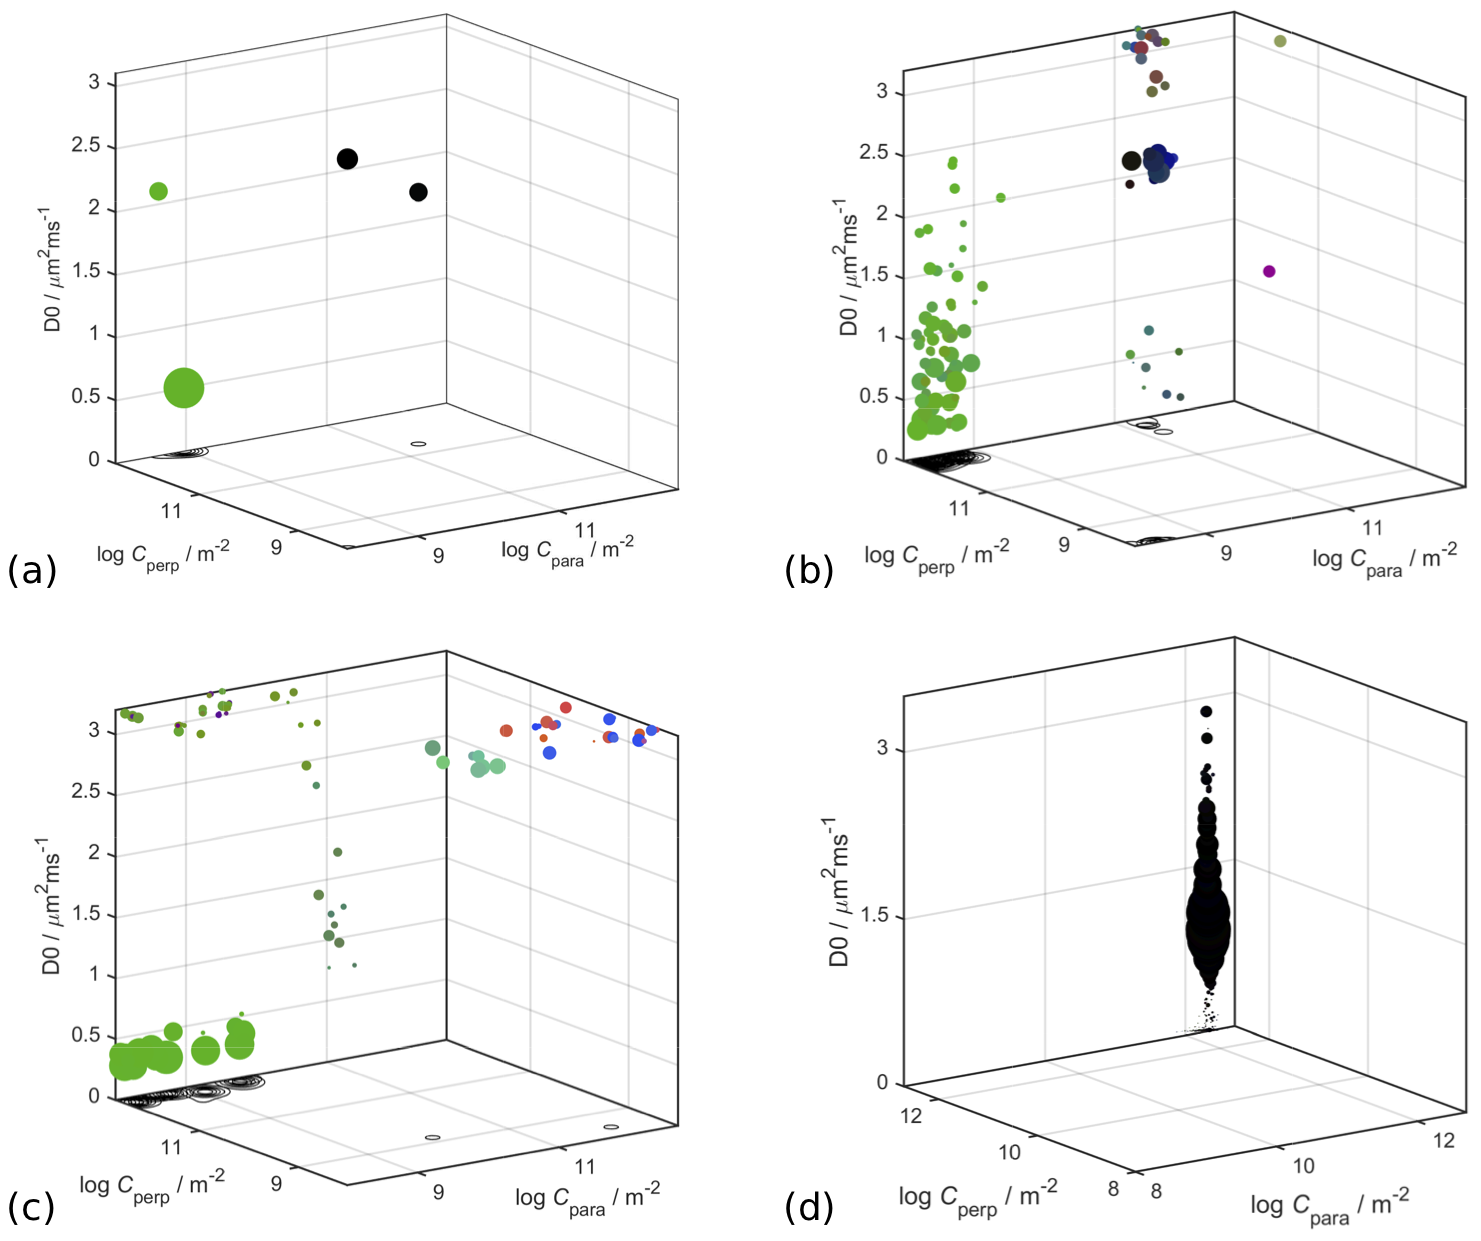
First, we observed that unlike the diffusion tensor based framework which assumes free diffusion, the confinement tensor describes the features associated with restricted diffusion for many pore shapes and experimental scenarios. See Figure 2 for an example. The existing technology5 can be adapted to incorporate the confinement tensor model into the tensor distribution imaging framework. In Figure 3 we illustrate the results obtained applying the considered method on few selected voxels on a brain data set.To assess the reliability of this approach, we performed simulations on a tissue model comprising three subdomains: a spherical compartment with restricted diffusion, an isotropic free diffusion compartment, and a compartment presenting unidirectional free diffusion and two different diffusivities. An available protocol4 was used to generate the signal from the tissue model. When generating the signal, different weights were assigned to each compartment to uneven their contribution in the distribution. Figure 5a shows the voxel composition.
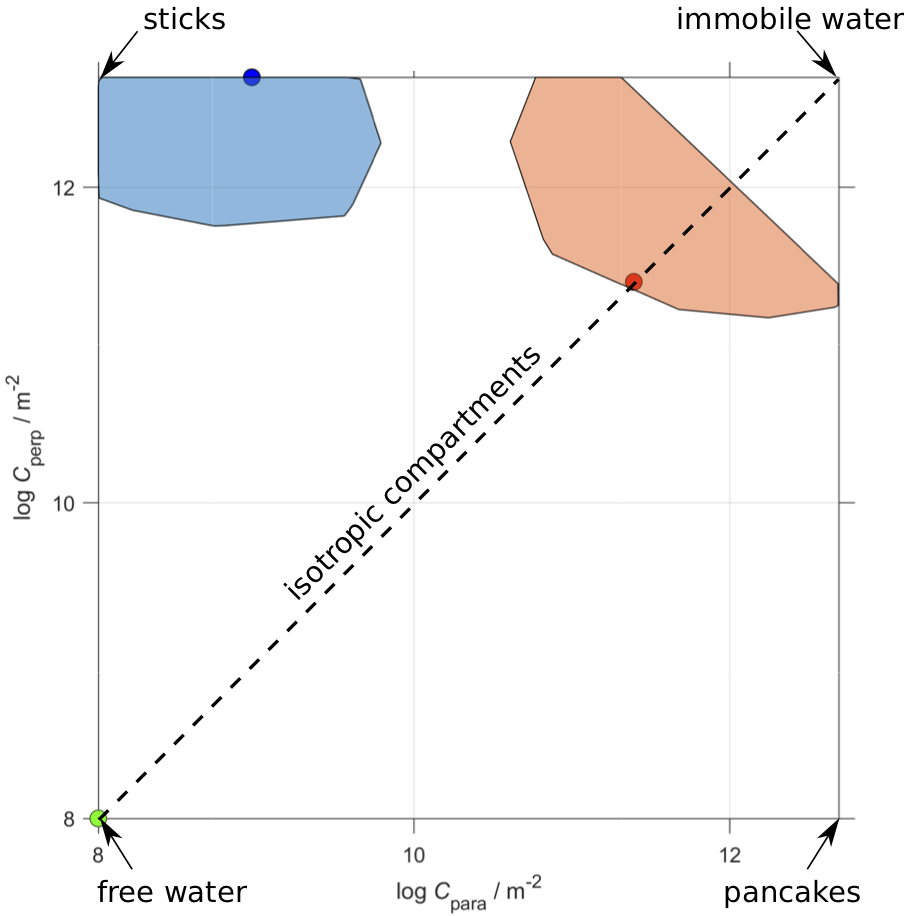
Repeated transformations of the signal with and without noise were carried out. The added noise was estimated from a brain dataset acquired with the same protocol4 employed in the simulations. To compute quantitative metrics for the evaluation of the algorithm outcomes, regions around the ground truth compartments were defined as the convex hull of the points obtained by applying the transformation on each subdomain separately, see Figure 4. The recovered confinement tensor – diffusivity distributions were then mapped to their belonging region. Then, dispersions in size, shape, and diffusivity where computed (results not shown) for each region. Recovered tensors not falling in any of the convex hulls were considered as artefacts of the transformation and their relative amount to the entire population was considered when assessing the performance of the method.
RESULTS
Figure 5b and 5c shows examples of transformations results in the noiseless and noisy scenarios. These plots highlight the difficulties encountered in recovering a full joint confinement tensor diffusivity distribution even when noise is not present. When noise is introduced, the uncertainty about the estimated distribution increases as only the compartment with the higher weight is still fully captured by the algorithm. The computed metrics seems to suggest that the higher variability is found in the estimation of the compartment diffusivity, while the geometry estimations tend to be more robust.DISCUSSION
As shown for single diffusion encoding6, the accurate recovery of compartment-specific diffusivities is challenging via the existing methods (algorithm as well as the experimental protocol) when a distribution of such compartments is to be obtained. Figure 5d clearly shows that even in a simple scenario where the voxel contains a single compartment shape with a single diffusivity, and no noise is present, the variation in the estimated diffusivity value is large. This issue could be potentially solved by employing a different set of gradient waveforms.7When considering more complex scenarios, the results in Figure 5c showed that only one compartment in the distribution could be accurately recovered, suggesting that the considered method could potentially generate satisfactory outcomes but improvements are needed before considering in vivo applications.
CONCLUSIONS
In this work we showed the challenges arising when attempting at determining a compartment specific diffusivity combined with a confinement tensor distribution when commonly available protocols are used. However, as shown for double diffusion enconding7, such difficulties could be mitigated by changing the acquisition protocols. This, alongside with the superiority of the confinement tensor model in representing microscopic domains, justifies future efforts on algorithmic and experimental schemes development.Acknowledgements
No acknowledgement found.References
1. Topgaard D. Diffusion tensor distribution imaging. NMR Biomed. 2019;32(5):e4066.
2. Yolcu C, Memiç M, Şimşek K, Westin CF, Özarslan E. NMR signal for particles diffusing under potentials: From path integrals and numerical methods to a model of diffusion anisotropy. Phys Rev E. 2016;93:052602.
3. Özarslan E, Yolcu C, Herberthson M, Westin CF, Knutsson H. Effective potential for magnetic resonance measurements of restricted diffusion. Front Phys. 2017;5:68.
4. Szczepankiewicz F, Hoge S, Westin CF. Linear, planar and spherical tensor-valued diffusion MRI data by free waveform encoding in healthy brain, water, oil and liquid crystals. Data Brief. 2019;25:104208.
5. Nilsson M, Szczepankiewicz F, Lampinen B, Ahlgren S, Martins JPA, Lasic S, Westin CF, Topgaard D. An open-source framework for analysis of multidimensional diffusion MRI data implemented in MATLAB. Proc. Intl. Soc. Mag. Reson. Med. (26), Paris, France, 2018.
6. Jelescu IO, Veraart J, Fieremans E, Novikov DS. Degeneracy in model parameter estimation for multi‐compartmental diffusion in neuronal tissue. NMR Biomed. 2016;29:33–47.
7. Coelho S, Pozo JM, Jespersen SN, Jones DK, Frangi AF. Resolving degeneracy in diffusion MRI biophysical model parameter estimation using double diffusion encoding. Magn Reson Med. 2019;82(1):395-410.
8. Özarslan E, Shemesh N, Basser PJ. A general framework to quantify the effect of restricted diffusion on the NMR signal with applications to double pulsed field gradient NMR experiments. J Chem Phys. 2009;130(10):104702.
Figures