4441
Detecting the evolving tumor microenvironment with diffusion microstructure modeling: a simulation study
Shu Xing1,2 and Ives R. Levesque1,2,3,4
1Department of Physics, McGill University, Montreal, QC, Canada, 2Medical Physics Unit, McGill University, Montreal, QC, Canada, 3McGill University Health Center Research Institute, Montreal, QC, Canada, 4Department of Oncology, McGill University, Montreal, QC, Canada
1Department of Physics, McGill University, Montreal, QC, Canada, 2Medical Physics Unit, McGill University, Montreal, QC, Canada, 3McGill University Health Center Research Institute, Montreal, QC, Canada, 4Department of Oncology, McGill University, Montreal, QC, Canada
Synopsis
Diffusion MRI with microstructure modeling can nominally map voxelwised cell radii and relative cell volume fractions for the entire tumour. This work proposes a model selection method that chooses the most suitable diffusion model among the two microstructural models and the monoexponential ADC model. This technique can potentially distinguish tissue microstructure featuring one or two underlying cell populations, and acellular necrosis. Microstructural parameters were also reliably estimated. These observations suggest the possible differentiation of three tumour microenvironments resulting from cancer therapy.
Introduction
Diffusion weighted MRI, and more specifically the quantitative apparent diffusion coefficient (ADC) have been used to detect changes in the tumor microenvironment during cancer treatment such as radio-, chemo- and recently immune-therapy (1–3). However, underlying microstructural variations can result in similar changes in ADC (4). For example, immunotherapy could lead to several scenarios including 1) infiltration of modified T-cells (radius R~ 4μm ) among the cancer cells (R ~8-10 μm), 2) increased number of cancerous cells due to ineffective therapy and 3) therapy induced necrosis (Figure 1) (5). The first two scenarios, opposed in terms of hypothetical clinical response, both cause the ADC to decrease and ADC alone cannot distinguish them.Multiple existing techniques use a single cell population microstructural model (1P-MM) to map $$$R$$$ and $$$v_{in}$$$ assuming that tumour features a single cell population (6,7). A previously proposed microstructural model for diffusion in two cell populations (denoted 2P-MM) can map the cell radii ($$$R_l$$$ and $$$R_s$$$) and relative cell volume fractions ($$$v_{in,l}$$$ and $$$v_{in,s}$$$), when 2 cell population of different $$$Rs$$$ and $$$v_{in}s$$$ co-exist in the same voxel (8).
In this work, we propose a method for voxel-wise model selection of the most suitable diffusion model among 2P-MM, 1P-MM and mono-exponential ADC (ME-ADC), which potentially allows the inference of qualitatively different tumor microenvironments. The effects of variations in the underlying tissue properties on the fitted microstructural parameters are also studied.
Method
The matrix method (9) was used to simulate PGSE diffusion signal at 4 diffusion times (Δ = 68,28,18,8 ms) for different radii and relative volume fractions, with Din = 1 μm2/ms and Dexo = 2 μm2/ms. Rician noise was added to yield a SNR of 50 and 80 in the b = 0 ms/mm2 signal with 100 noisy realizations generated for each simulation. Three diffusion models (1P-MM, 2P-MM and ME-ADC) were separately fitted to the data. The apparent cell radius $$$R_{app}$$$ and volume fraction $$$v_{in,app}$$$ were estimated from the two-compartment 1P-MM (6). The radius and volume fraction of the large and small cells $$$R_l, R_s, v_{in,l}$$$, and $$$v_{in,s}$$$ were obtained from the three-compartment 2P-MM. A monoexpoential function was fitted to the same data, yielding the ADC. Fit quality from three models was assessed using the corrected Akaike Information Criterion (cAIC). The model that produced the lowest cAIC was preferred. All data was fitted with 100 starting points. Fits that were within 1% of the fit constraints were considered failures and excluded from future analysis. A digital object mimicking a tumor was created encompassing all three scenarios and covering a range of volume fractions. We generated the b=1000 ms/mm2 diffusion “image”, ADC map, model selection, $$$R_l, R_s, v_{in,l}$$$, and $$$v_{in,s}$$$ maps. Note that the $$$R_{app}$$$ and $$$v_{in,app}$$$ estimated from the 1P-MM were displayed in the $$$R_l$$$ and $$$v_{in,l}$$$ maps. The $$$R_s$$$ and $$$v_{in,s}$$$ not applicable for the voxels with one cell population were displayed in black. The difference maps for $$$R_l, R_s, v_{in,l}$$$, and $$$v_{in,s}$$$ were then computed by subtracting the ground truth values from the medians of 100 noisy fits.Results and Discussion
Separating necrosis from cellular tissueThe cAIC distinguished necrosis from cellular tissue, but it was unable to differentiate cellular tissue scenarios with single-cell and two-cell populations. For the scenario with one underlying cell population, the distribution of cAIC from 1P-MM fit (cAIC1P-MM) overlapped with the cAIC distribution from 2P-MM fit (cAIC2P-MM). The cAIC distribution from the monoexponential fit (cAICADC), however, was centered around a much greater value (Figure 2a). The same was observed for the scenario of a two-cell populations (Figure 2b). For necrotic tissue, the cAICADC shifted towards a lower value than the cAIC1P-MM and cAIC2P-MM (Figure 2c).
Separating tissue with one-cell population from tissue with two cell populations
The scenario of a single cell population was distinguished from the scenario with two cell populations based on the estimated radii. When both 1P-MM and 2P-MM were fitted to signal from a tissue with one cell population, the estimated radii were approximately equal, i.e. $$$R_{app}\approx R_l\approx R_s$$$ (Figure 3, top row), for either SNRs. For signal from a tissue with two cell populations, the fits returned $$$R_s<R_{app}<R_l$$$ (Figure 3, bottom row).
Analysis of the simulated tumor covering a range of $$$v_{in}s$$$ demonstrated similar ADC values for multiple “voxels” (Figure 4). The parameter maps show the expected heterogeneity, with contrast in $$$v_{in,l}$$$ and $$$v_{in,s}$$$ maps in regions identified as cellular tissue by the cAIC. The difference maps (Figure 5) illustrate that the radii and volume fractions can be estimated within $$$\pm 1\mu m$$$ and $$$\pm 6\%$$$ respectively.
Conclusion
The combination of cAIC and estimated radii could enable model selection between mono-exponential ADC, and one-cell and two-cell microstructure models. The relative cells volume fractions can be estimated with acceptable accuracy. This suggests that we might differentiate among necrotic tissue, and tumour tissue with one cell population or two cell populations, on a voxel level. Diffusion-based measurements may potentially monitor therapy changes such as T-cell infiltration, tumour advancement, and necrosis. The volume of modified T-cells at the tumour site could potentially also be quantified.Acknowledgements
The authors acknowledge Dr. Junzhong Xu, Dr. Damien McHugh, Zaki Ahmed, and Véronique Fortier for valuable discussions. This work is supported by Medical Physics Research Training Network Grant of the Natural sciences and Engineering Research Council (Grant number: 432290), and the Fonds de Recherche en Santé du Quebec.References
- Padhani AR, Liu G, Koh DM, Chenevert TL, Thoeny HC et al. Diffusion-weighted magnetic resonance imaging as a cancer biomarker: consensus and recommendations. Neoplasia. 2009;11(2):102–25.
- Vallières M, Serban M, Benzyane I, Ahmed Z, Xing S, Naqa I El, et al. Investigating the role of functional imaging in the management of soft-tissue sarcomas of the extremities. 2018
- Dudeck O, Zeile M, Pink D, Pech M, Tunn PU, Reichardt P, et al. Diffusion-weighted magnetic resonance imaging allows monitoring of anticancer treatment effects in patients with soft-tissue sarcomas. J Magn Reson Imaging. 2008;27(5):1109–13.
- McHugh DJ, Hubbard Cristinacce PL, Naish JH, Parker GJM. Towards a ‘resolution limit’ for DW-MRI tumor microstructural models: A simulation study investigating the feasibility of distinguishing between microstructural changes. Magn Reson Med. 2018 Oct 19
- Chapelin F, Capitini CM, Ahrens ET. Fluorine-19 MRI for detection and quantification of immune cell therapy for cancer. J Immunother Cancer. 2018 Dec 11;6(1):105.
- Xing S, Levesque IR. Modeling the microstructure of tissue with two cell populations of different sizes using diffusion-weighted MRI. ISMRM. 2019;3540.
- iang X, Li H, Xie J, Mckinley ET, Zhao P, Gore JC, et al. In vivo imaging of cancer cell size and cellularity using temporal diffusion spectroscopy. Magn Reson Med. 2016;00(June):1–9.
- Panagiotaki E, Walker-Samuel S, Siow B, Johnson SP, Rajkumar V, Pedley RB, et al. Noninvasive Quantification of Solid Tumor Microstructure Using VERDICT MRI. Cancer Res. 2014 Apr 1;74(7):1902–12.
- Ianu AS. Advanced Diffusion MRI for Microstructure Imaging : Theoretical Developments. 2016.
- McHugh DJ, Lipowska-Bhalla G, Babur M, Watson Y, Hubbard Cristinacce PL, Naish JH, et al. Mapping tumour response to radiotherapy using diffusion model comparison. ISMRM Annual meeting. 2019;1017.
Figures
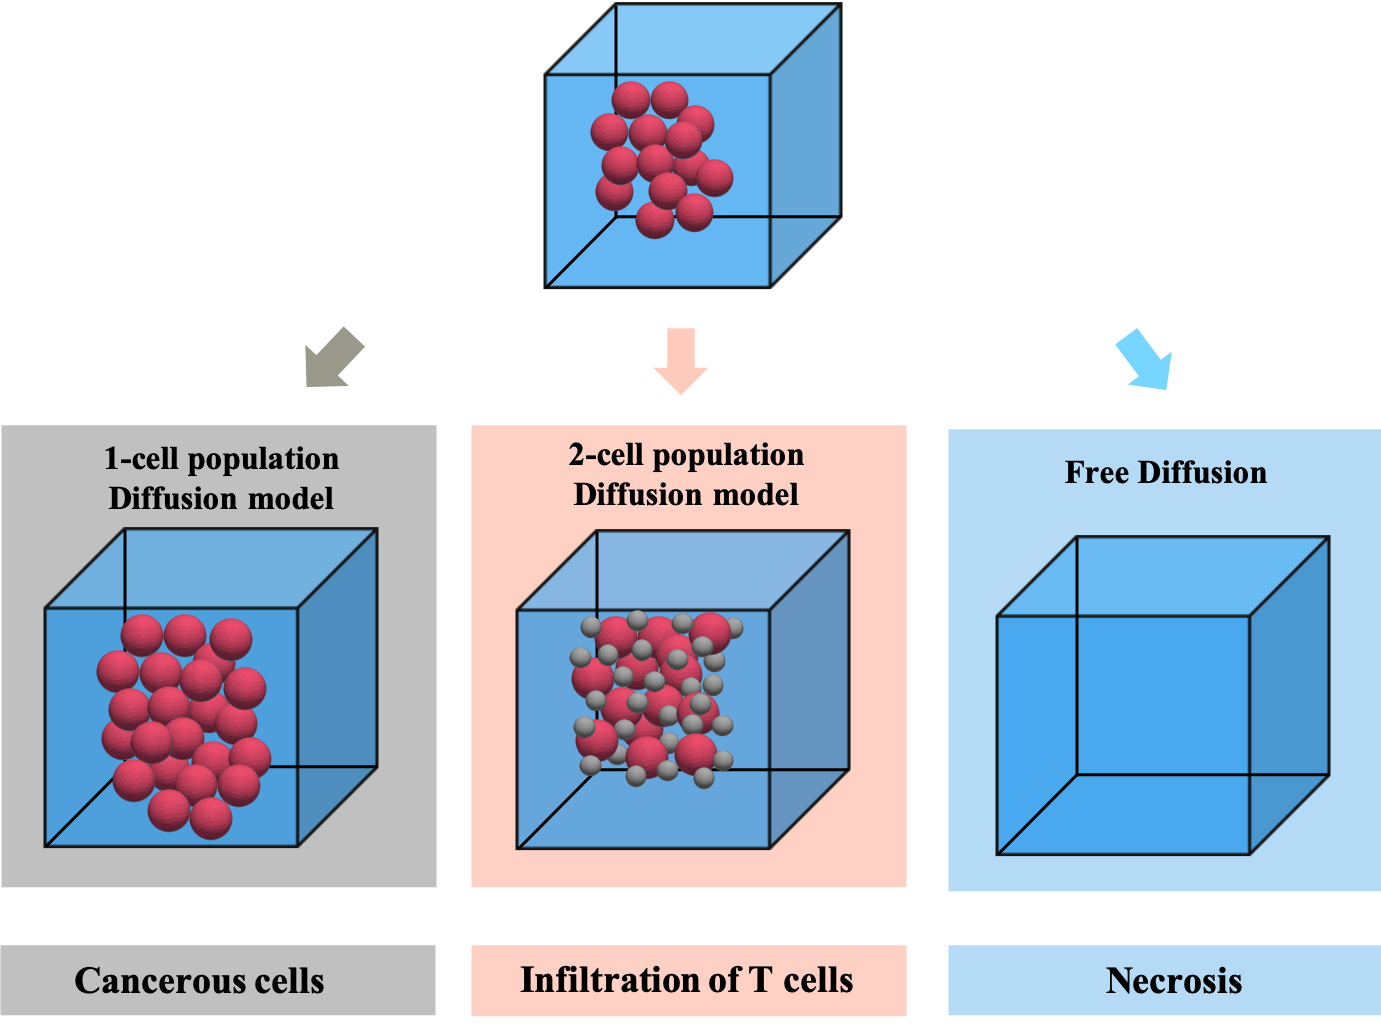
Figure 1 Schematic illustration of three possible scenarios during immunotherapy including 1) increasing number of cancer cells (red spheres, R ~ 8-10 μm) due to ineffective therapy, 2) infiltration of modified T-cells (gray spheres, radius R~ 4μm) within the tumour, and 3) therapy induced necrosis. The cells are modeled as impermeable spheres.
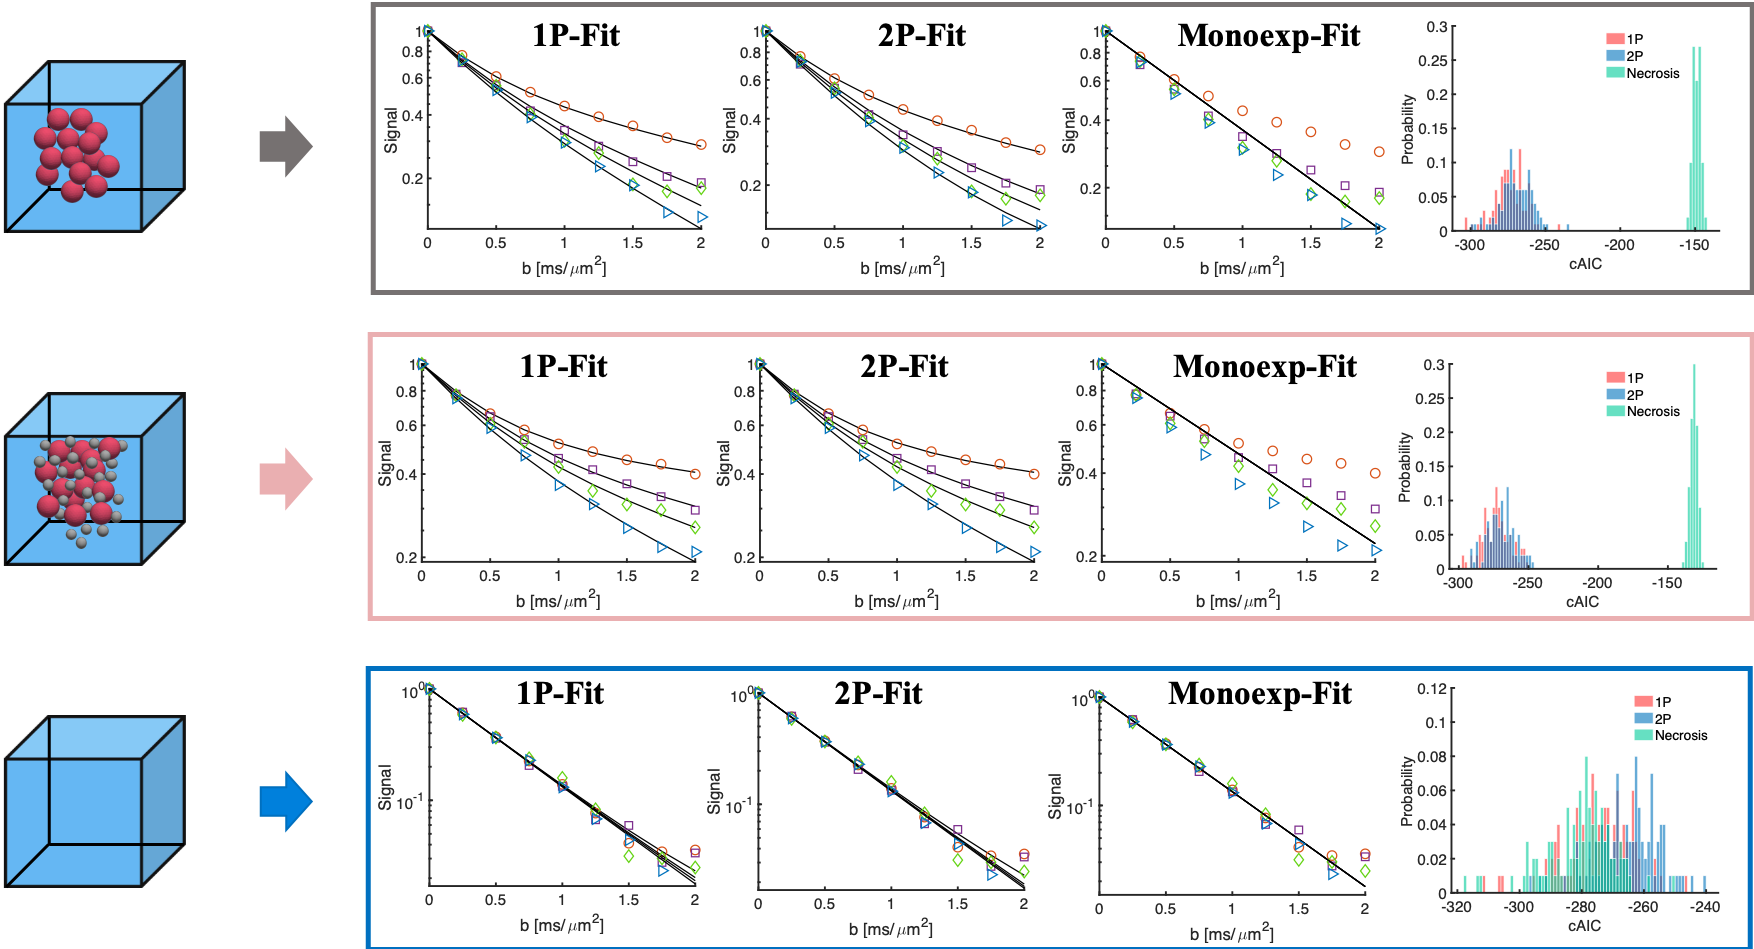
Figure 2 Model selection procedure can differentiate the necrotic and cellular scenarios, based on the corrected Akaike information criterion (cAIC). Three diffusion models (1P-MM, 2P-MM and ME-ADC, see text) were separately fitted to three scenarios simulating tumour microenvironments. The signal was simulated at 4 diffusion times (Δ = 68,28,18,8 ms) with SNR =50. The distribution of cAIC is plotted over 100 noisy fits. The model that produced the lowest cAIC was preferred.
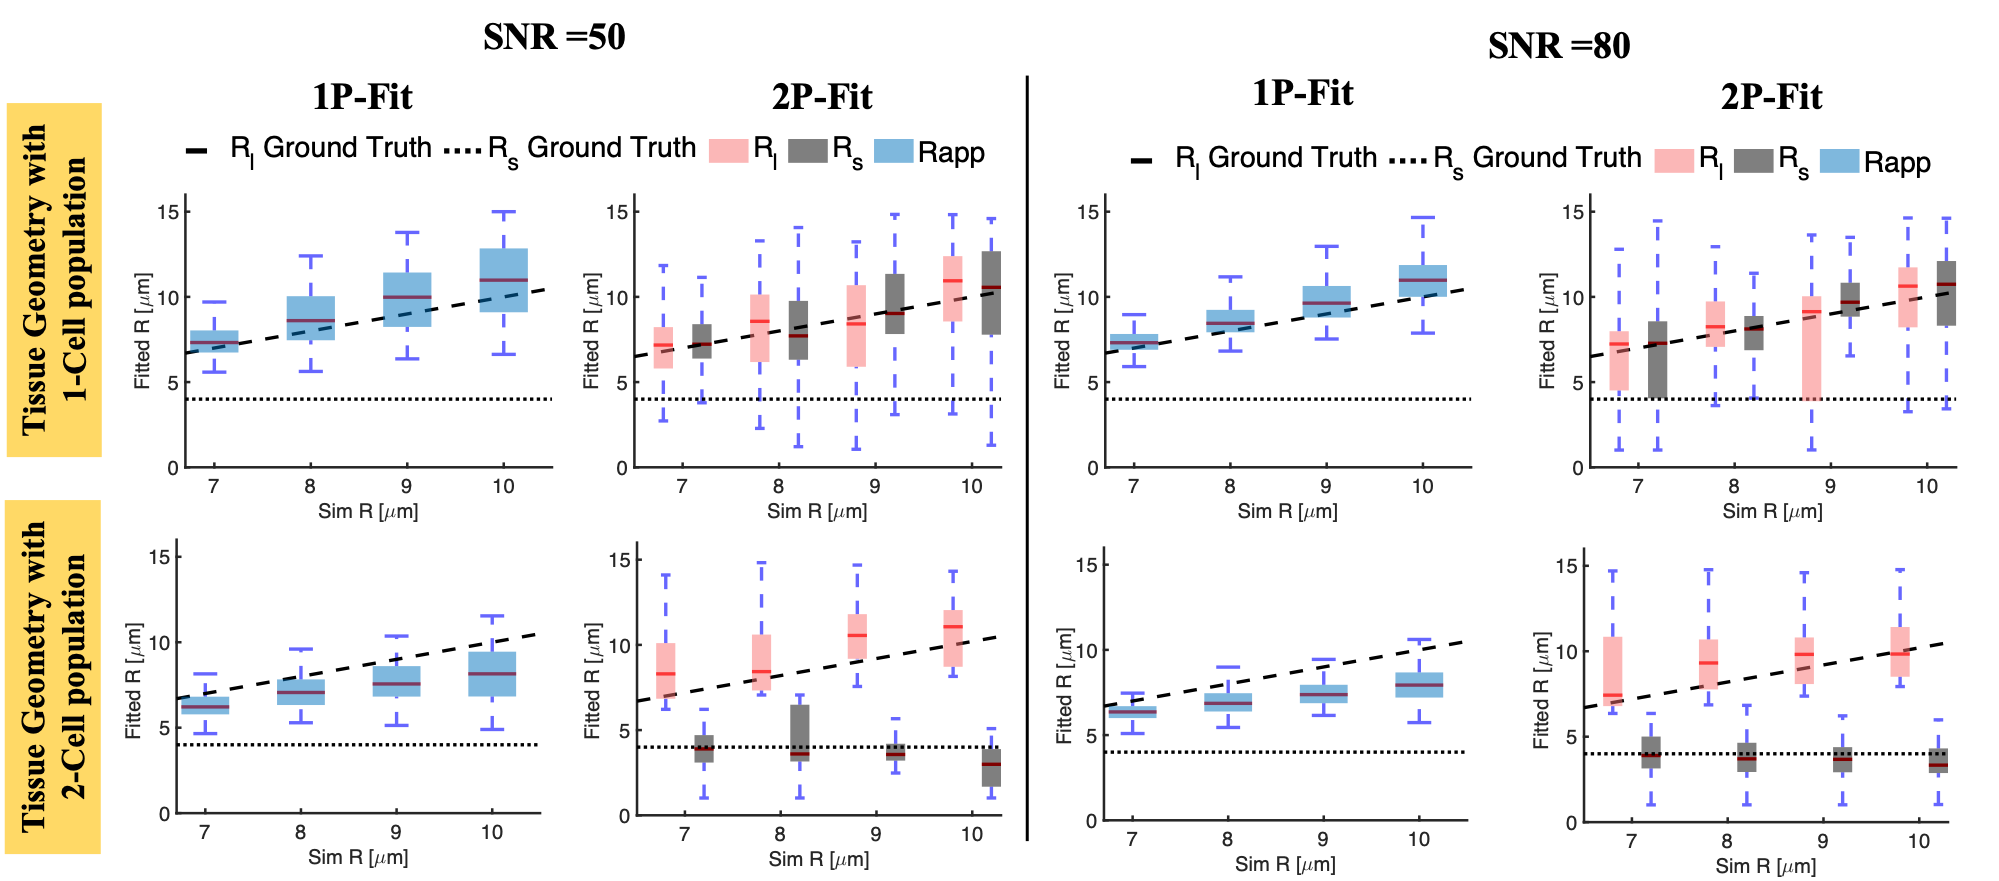
Figure 3 Model selection can differentiate cellular tissue with one cell population from that with two cell population based on the fitted radii. When 1P-MM and 2P-MM are fitted to signal from tissue with one cell population, $$$ R_{app}\approx R_l \approx R_s $$$ (top row). For tissue with two cell populations, $$$ R_s <R_{app}< R_l $$$ (bottom row). Variation of the noise (SNR = 50, 80) has a limited effect on fitted radius. The dashed black lines represent the ground truth. On each box, the central red line indicates the median and the coloured box indicates the 25th and 75th percentiles.
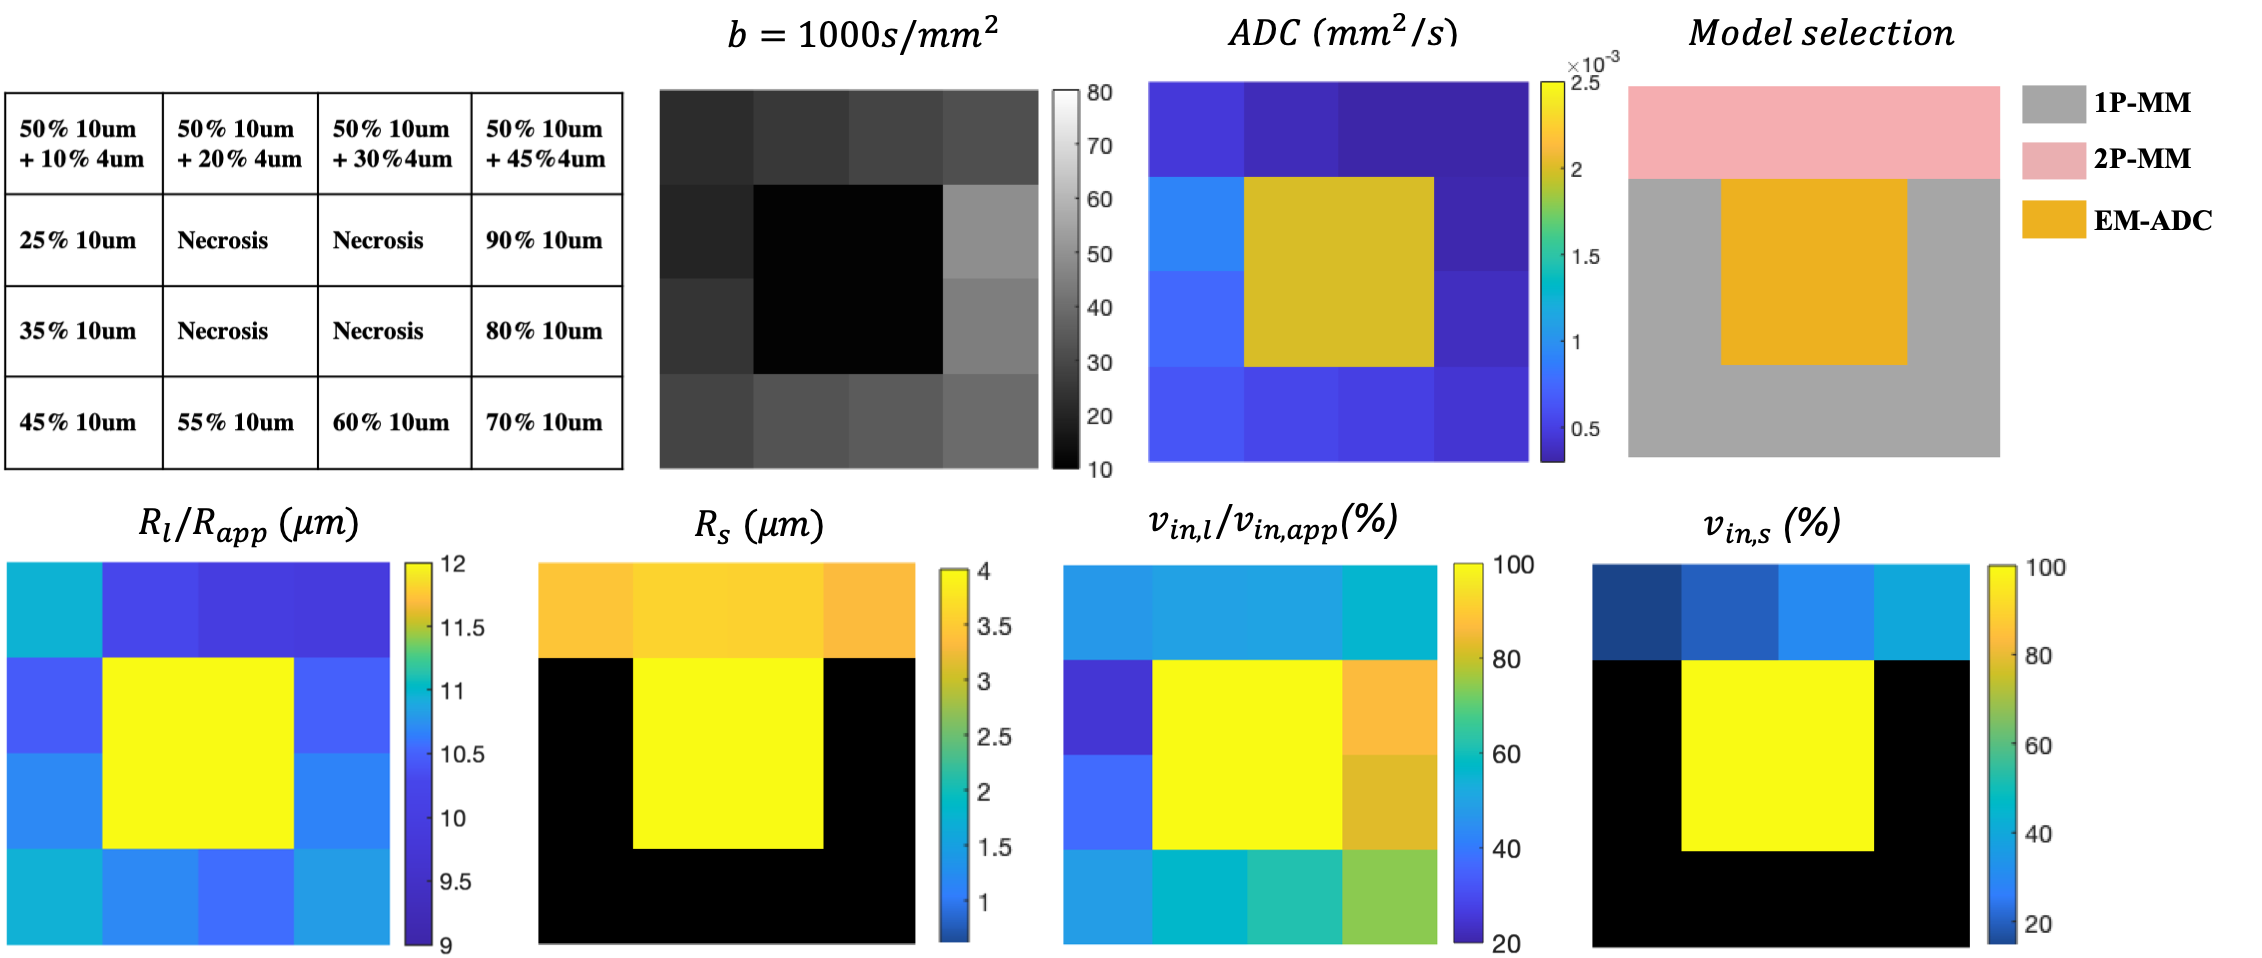
Figure 4 Simulations from the digital “tumour” object mimicking three clinical scenarios over a range of $$$ v_{in}$$$s.The ME-ADC, 1P-MM and 2P-MM are correctly selected. ADC values are similar for multiple regions. The parameter maps (bottom row) computed as the median of 100 noisy fits of SNR =50 show intra-tumoural heterogeneity in regions identified as cellular tissue. The $$$R_{app}, v_{in,app}$$$ estimated from 1P-MM are displayed in the $$$R_l$$$ and $$$v_{in,l}$$$ maps. The $$$R_s, v_{in,s}$$$ not applicable for the one cell population voxels, are displayed in black.
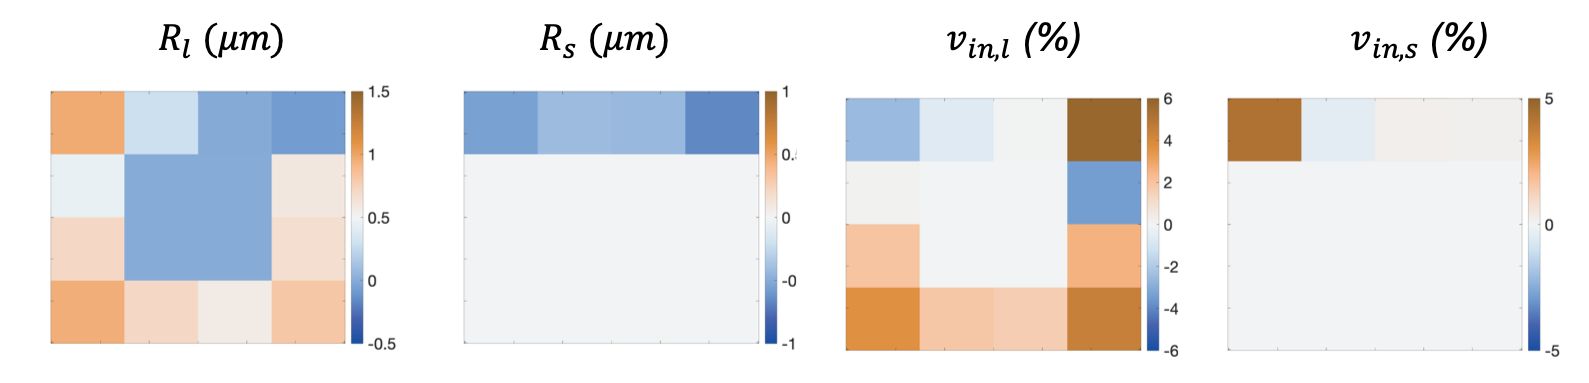
Figure 5 Difference maps for $$$R_l, R_s, v_{in,l} $$$ and $$$v_{in,s}$$$ computed by subtracting the ground truth values from the medians of 100 noisy fits (SNR=50) suggest that the radii and cell volume fractions can be estimated within $$$\pm 1\mu m$$$ and $$$\pm 6\%$$$ respectively. The ground-truth values are shown in Figure 4.