4440
Behaviors of high b-value direction-averaged DWI signal decay in human gray matter1Hoglund Brain Imaging Center, University of Kansas Medical Center, Kansas City, KS, United States, 2Department of Neurology, University of Kansas Medical Center, Kansas City, KS, United States, 3Department of Molecular & Integrative Physiology, University of Kansas Medical Center, Kansas City, KS, United States, 4Department of Radiology, University of Kansas Medical Center, Kansas City, KS, United States
Synopsis
Neurite microenvironment has been approximated as impermeable, thin cylindrical tubes. This assumption has been validated in human white matter by a power law with the exponent of around 0.5 at b-values above 4000 s/mm2. However, the decay exponent in gray matter deviates from 0.5, suggesting that the cylindrical tube approximation does not apply in gray matter. This study aimed to study the whole-brain gray matter distribution of the decay exponent, and demonstrated an apparent contrast in the decay exponent between cortical gray matter and deep gray matter. This suggests that inherent microstructural differences may exist between these gray matter regions.
INTRODUCTION
The microenvironment of neurites has been approximated as impermeable, thin cylindrical tubes. Based on this approximation, the theoretical signal decay of diffusion-weighted imaging (DWI) signals has been derived, 1-3 and has been recently validated in the human brain through direction-averaged DWI signals. 4,5 In white matter, the signals follow a power law relation with the decay exponent of around 0.5 at b-values above 4000 s/mm2. 4,5 This is consistent with the theoretical prediction of water diffusion within the cylindrical tubes. By contrast, the power law decay exponent in gray matter tends to be larger than 0.5. 4,6 The deviation from the cylindrical tube approximation has been attributed to less myelinated neurites and larger proportion of neuronal cell bodies in gray matter compared to white matter. 4,6 This suggests that the magnitude of the decay exponent may reveal underlying microstructural differences in gray matter. However, only regional values of the exponent in gray matter have been reported. 4,6 Therefore, this study aimed to investigate the whole-brain gray matter distribution of the power law decay exponent at b-values 3000‒10000 s/mm2.METHODS
In vivo dataIn vivo DWI data and T2-weighted structural data of 5 subjects (2 females, age 22‒44 years) were obtained from the MGH Adult Diffusion Dataset (https:// www.humanconnectome.org). The data were collected using Spin-echo EPI sequence on the customized Siemens 3T Connectom scanner with b-values: 1000, 3000, 5000, and 10000 s/mm2 and corresponding 64, 64, 128, and 256 randomly distributed diffusion-encoding directions. Other sequence parameters for DWI were: the number of b0 images = 40, diffusion gradient pulse duration/spacing (δ/Δ) = 12.9/21.8 ms, echo time/repetition time (TE/TR) = 8800/57 ms, and an isotropic voxel size of 3.38 mm3. Further details of the sequence parameters for DWI are given in Ref. [7].
Gray matter segmentation
Gray matter regions was determined through the segmentation of T2-weighted structural images using SPM (https://www.fil.ion.ucl.ac.uk/spm/) with tissue probability > 90% to reduce partial volume effects. Its anatomical space was transformed into that of DWI images through the co-registration of the T2-weighted structural images and b0 images using SPM. To reduce the tissue contamination from cerebrospinal fluid in gray matter regions, apparent diffusion coefficient (ADC) maps were created using the DWI images with b-values = 0 and 1000 s/mm2. Gray matter regions with ADC > 1.2 × 10⁻³ mm2/s were excluded from the analysis.
Data fitting
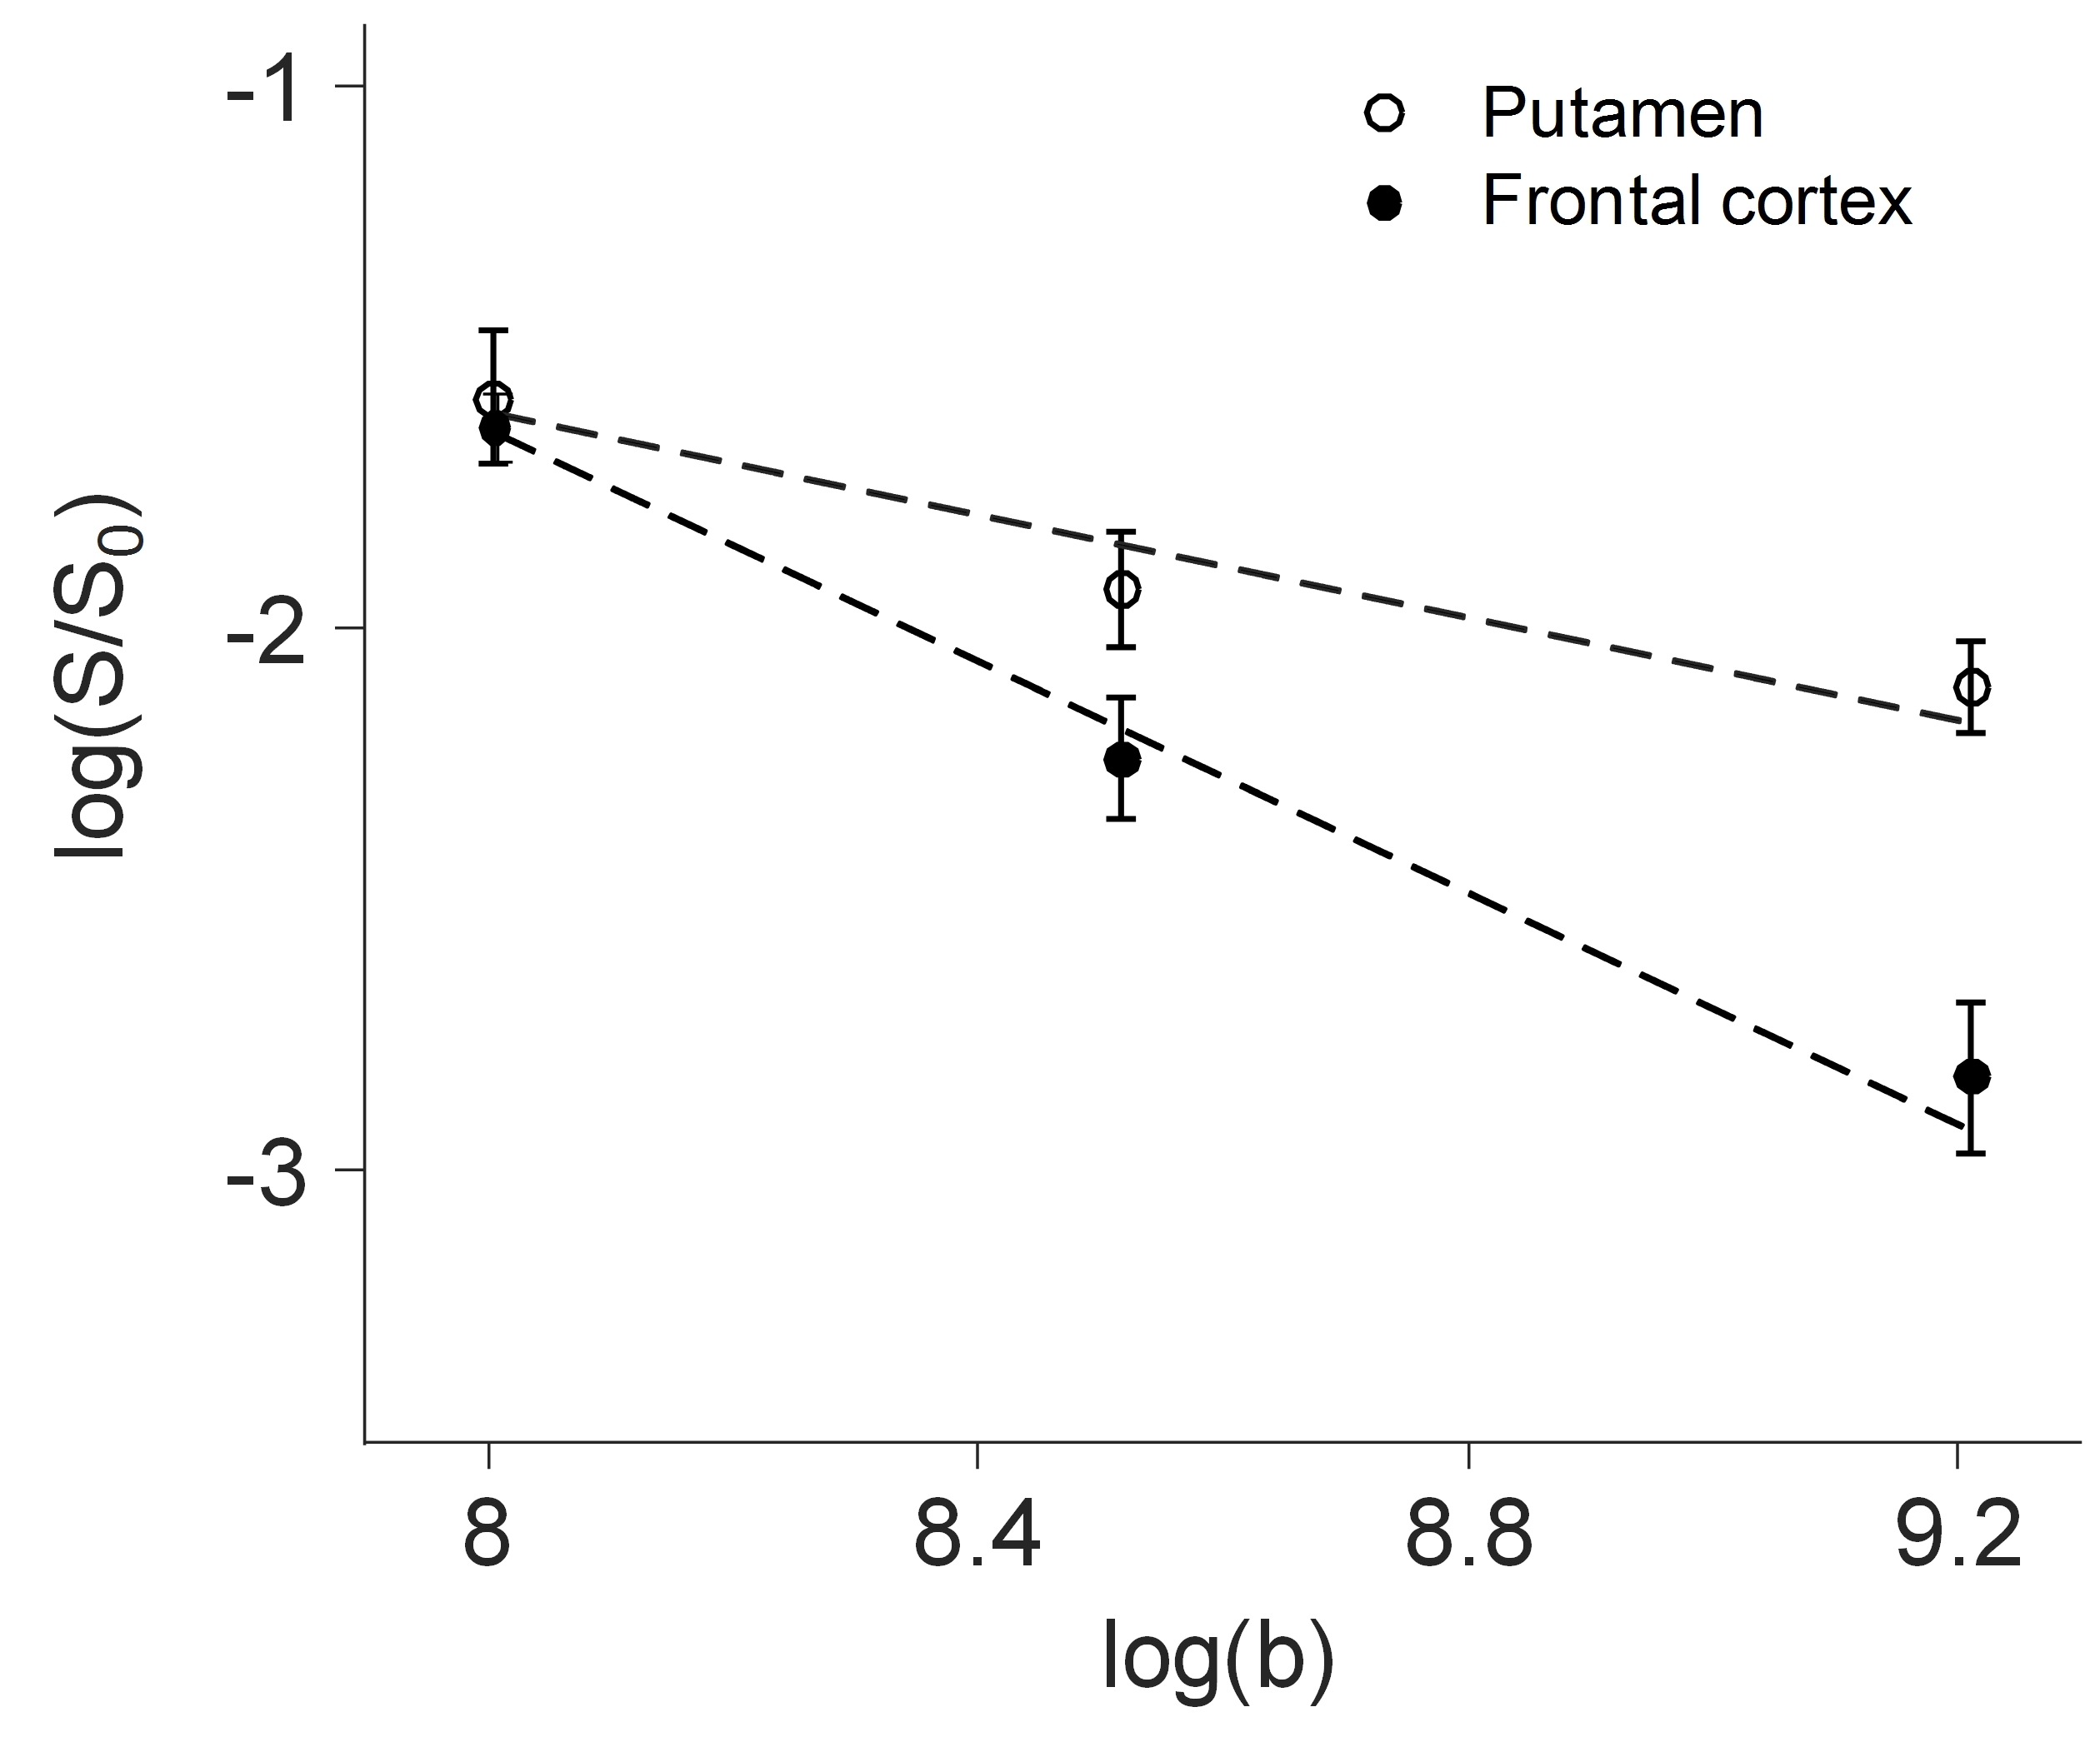
For each b-value, DWI images were averaged across all the diffusion-encoding directions to suppress the effects of macroscopic diffusion anisotropy. The direction-averaged signals with b-values: 3000, 5000, and 10000 s/mm2 were normalized by the signal with b = 0 s/mm2 and were fitted with the power law 4,5:
S(b)/S(0) = C x b-α [1]
where α is the power law decay exponent and C is a constant. The voxel-wise fitting was performed within the segmented gray matter regions using the trust-region-reflective algorithm in Matlab (Mathworks, Inc.). The goodness-of-fit was evaluated using the reduced chi-square statistic (χν2), 8 which quantifies the sum of squares of the residuals normalized by degrees of freedom and the uncertainty of the measurement. The uncertainty of the measurement was determined from the standard deviation of the background noise assuming a Rayleigh distribution. Image voxels with the χν2 value outside 95% confidence interval were excluded from the analysis.
RESULTS
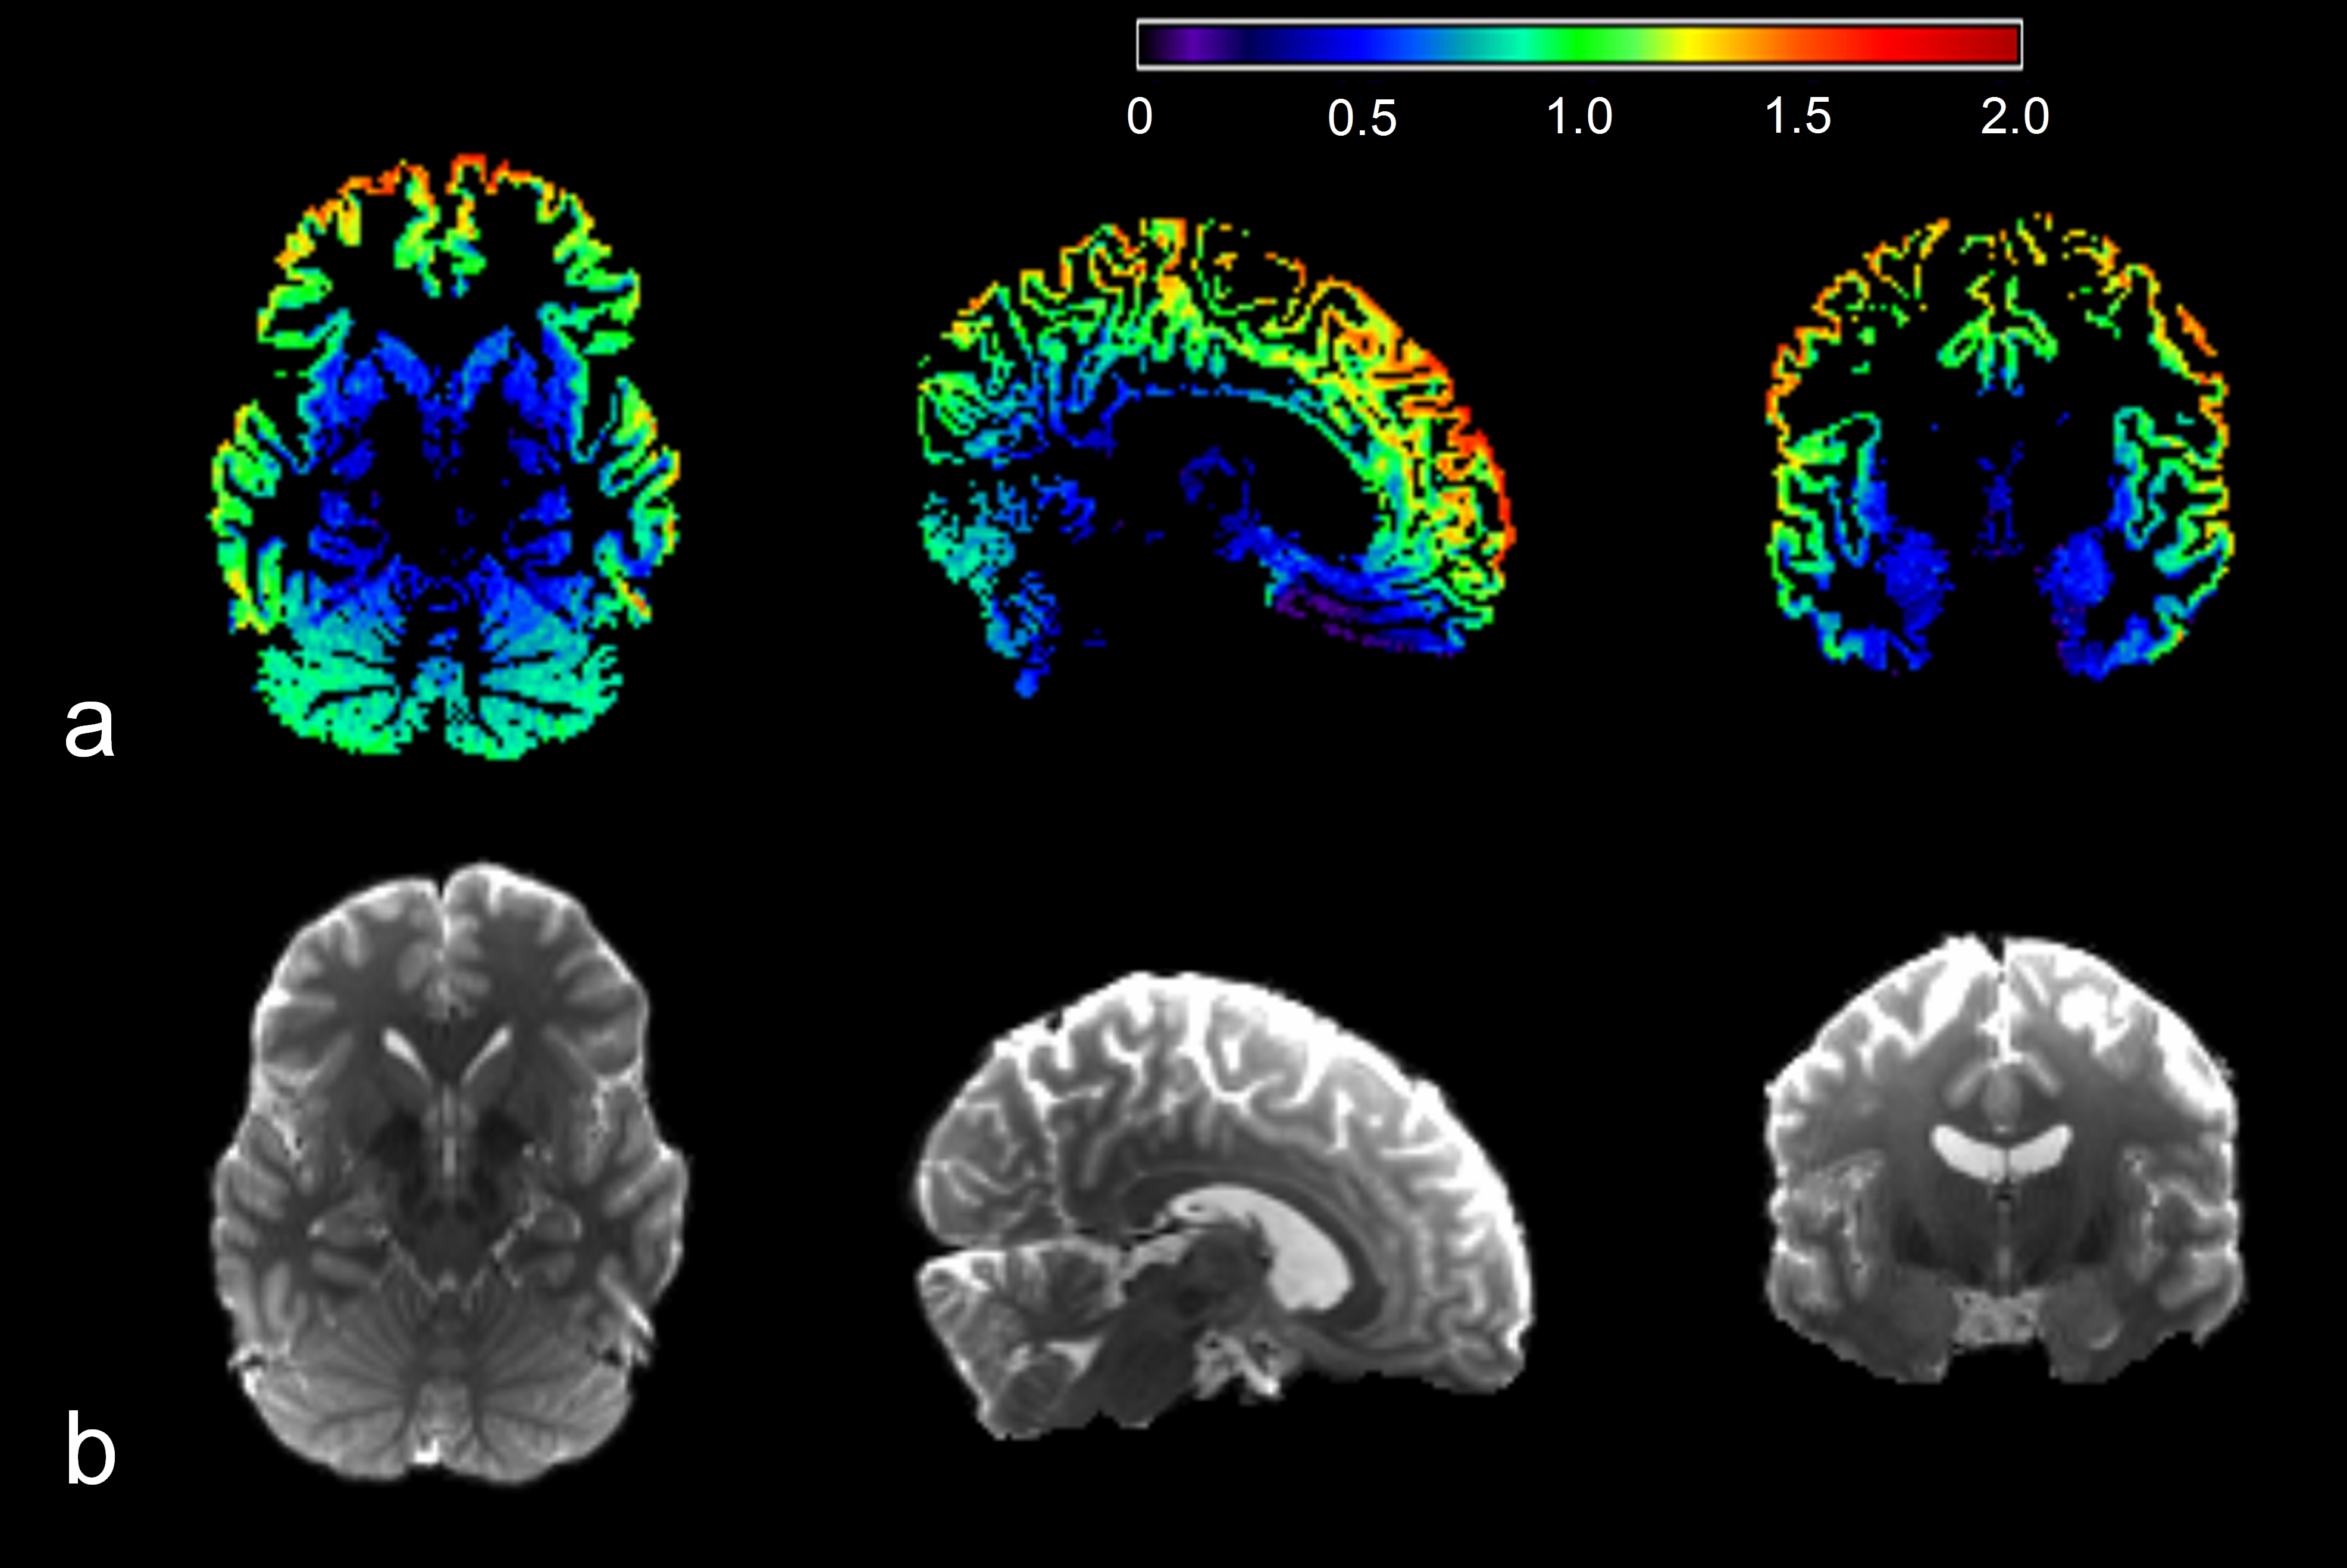
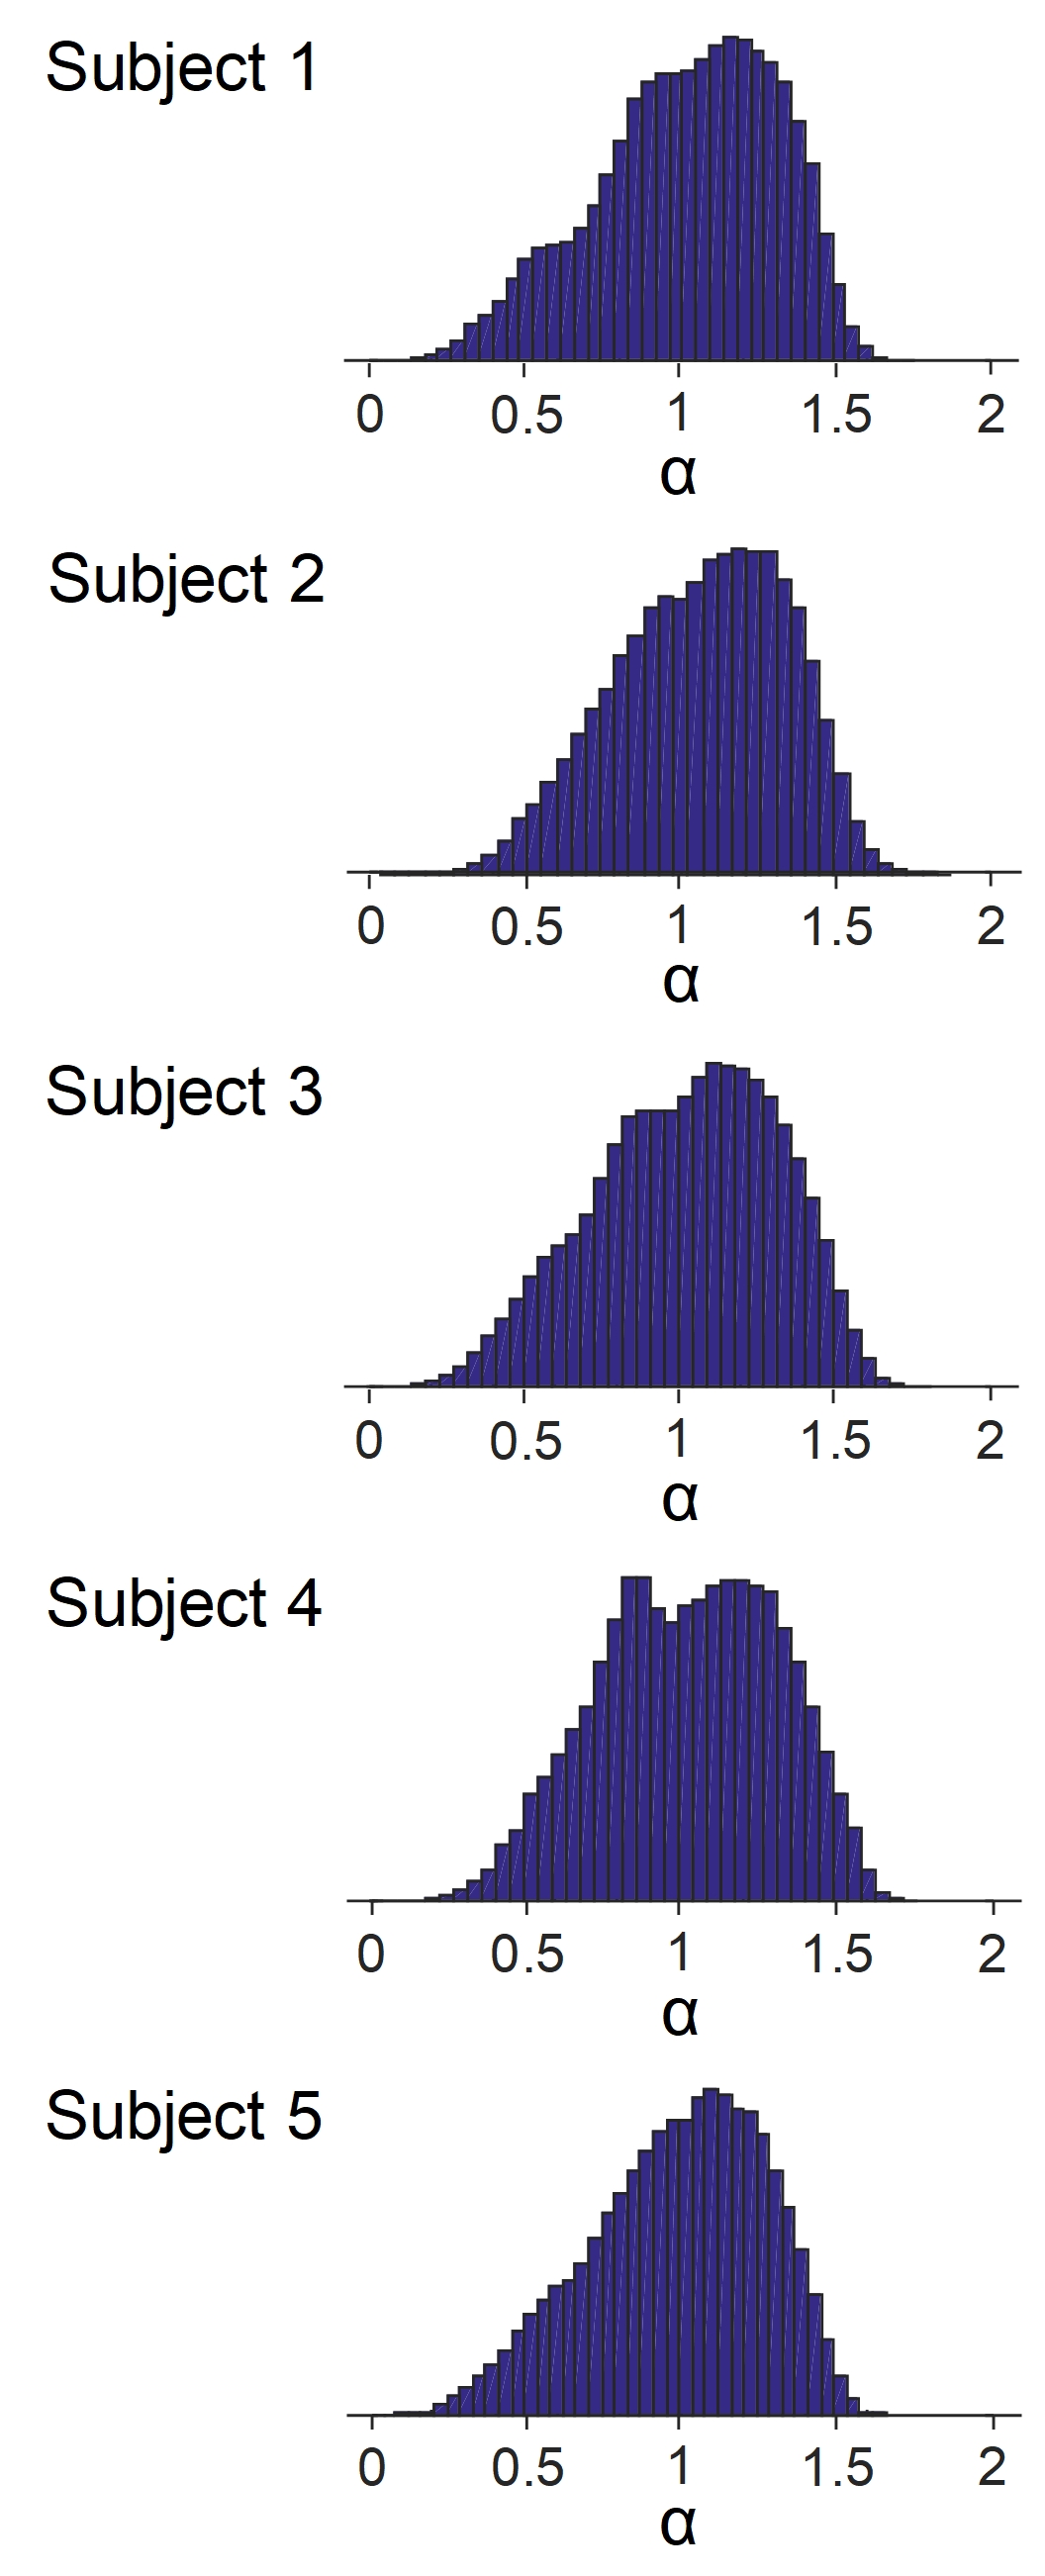
The power law decay exponent in frontal cortex (1.07) was larger than that in putamen (0.47) (Fig. 1). The differences in the decay exponent across gray matter regions are further illustrated in Fig. 2. The decay exponent was larger in cortical regions and smaller in deep gray matter structures, including hippocampus, putamen, and caudate. The dispersion of the decay exponent histogram in whole-brain gray matter was observed across the 5 subjects (Fig. 3). The 25, 50, 75 percentile values of the exponent for the 5 subjects were 0.83 ± 0.03, 1.05 ± 0.03, and 1.25 ± 0.03, respectively.DISCUSSION
This study demonstrated an apparent contrast in the power law decay exponent between cortical gray matter and deep gray matter (Figs 1 and 2). This faster decay in cortical gray matter may be associated with higher membrane permeability resulting from less myelinated neurites or higher proportion of neuronal cell bodies relative to deep gray matter. 4,6 The reported dispersion of the decay exponent across different gray matter regions generally agrees with previous findings. 4,6 However, in order to effectively suppress the effect from extra-neurite water diffusion, the b-values for the DWI signals need to be sufficiently high, e.g. larger than 7000 s/mm2. 5 Multiple high b-values are also required to robustly fit the model. Our study performed the fitting with only three b-values: 3000, 5000, and 10000 s/mm2. Therefore, the DWI signals in our study can still be influenced by the extra-neurite water diffusion. Additionally, the fitting can be subject to over-fitting. Our reported difference in the decay exponent of gray matter structures will require further validation.CONCLUSION
This study observed a larger power law decay exponent in cortical gray matter than in deep gray matter, suggesting possible microstructural differences leading to the deviation from the cylindrical tube approximation.Acknowledgements
This work is partly supported by the National Institutes of Health (S10RR29577, UL1TR000001) and the Hoglund Family Foundation.References
[1]. Kroenke et al., Magn Reson Med. 2004 Nov;52(5):1052-9.
[2]. Yablonskiy et al., NMR Biomed. 2010 Aug;23(7):661-81.
[3]. Jensen et al., Neuroimage. 2016 Jan 1;124(Pt A):824-833.
[4]. McKinnon et al., Magn Reson Imaging. 2017 Feb;36:121-127.
[5]. Veraart et al., Neuroimage. 2019 Jan 15;185:379-387.
[6]. Palombo et al., ISMRM 2018, 892.
[7]. Setsompop et al., Neuroimage. 2013 Oct 15;80:220-33.
[8]. P.R. Bevington et al., Data Reduction and Error Analysis for the Physical Sciences, McGraw-Hill, New York, 1992.
Figures