4439
Quantification of soma compartment in cerebral cortical mean kurtosis with diffusion MRI1Radiology, Children's Hospital of Philadelphia, Philadelphia, PA, United States, 2Bioengineering, University of Pennsylvania, Philadelphia, PA, United States, 3Radiology, University of Pennsylvania, PHILADELPHIA, PA, United States
Synopsis
Unlike white matter composed mostly of neurites, cerebral cortex includes a significant amount of somas from neurons or glial cells besides neurites. Mean kurtosis (MK) of diffusion kurtosis imaging characterizes cortical microstructural complexity contributed by both neurites and somas, but the exact contribution of somas to cortical MK is unknown. Neuronal density plays a vital role in neurodegenerative disorders. Quantitative delineation of the soma compartment is critical for assessment and therapeutic monitoring of soma compartment with noninvasive diffusion MRI. We for the first time proved and quantified soma and neurite compartmental contributions to cerebral cortical MK.
Purpose
Unlike white matter composed mostly of neurites, cerebral cortex includes a significant amount of somas from neurons or glial cells besides neurites. Mean Kurtosis (MK) from diffusion kurtosis imaging (DKI)[1] has been used to quantify the cortical microstructural complexity[2], and is contributed by both neurites and somas. Previous study [3] showed that MK is correlated with histology measure of neurofilament density, but the exact contribution of somas to cortical MK is unknown. Quantitative delineation of the soma compartment is critical for assessment and therapeutic monitoring of soma compartment with noninvasive diffusion MRI. We aimed to prove and quantify the soma and neurite contributions to cerebral cortical MK to pave the way for kurtosis-based estimation of density, average diameter and quantities of somas in clinical research. The work builds a novel framework for a diffusion kurtosis based model to estimate soma density and average diameter in the cerebral cortex called KINDS (Kurtosis-based ImagiNg of Density of Somas in the cerebral cortex).Methods
Diffusion MRI signal model: The signal comes from two restricted compartments, soma and neurite: $$ S_{intra}=f_N S_N+f_S S_S (1)$$ $$f_N+f_S=1 (2)$$ Where $$$S_{intra}$$$ denotes the total intracellular signal, $$$f_N$$$ and $$$f_S$$$ denote the neurite and soma compartmental volume fractions, $$$S_N $$$ and $$$S_S$$$ denote the signal from the neurite and soma compartments, respectively. We assume no exchange between the two compartments. We interpret $$$f_N$$$ and $$$f_S$$$ as neurite density and soma density, respectively. For each gradient direction, we fit apparent diffusivity D, and apparent kurtosis K, according to: $$ ln(S/S_0 )=-bD+(b^2 D^2 K)/6 (3)$$ Where $$$S_0$$$ is the signal at $$$b=0$$$. We averaged K across all gradient directions to get the total mean kurtosis $$$K_{total}$$$ . Based on the definition of diffusivity and kurtosis:$$ D=\frac{\int_{-\infty}^{+\infty} {P(Δ,x) x^2 dx}}{2Δ} (4)$$
$$K=\frac{\int_{-\infty}^{+\infty}{P(\Delta,x)x^4dx}}{(\int_{-\infty}^{+\infty} {P(Δ,x) x^2 dx})^2 }-3(5)$$
Where x,$$$\Delta$$$ , and $$$P(\Delta,x)$$$ are defined as in [1], [5], we derive that
$$K_{total}=\frac{f_S (K_S+3) D_S^2+(1-f_S )(K_N+3) D_N^2}{(f_S D_S+(1-f_S ) D_N )^2} -3(6)$$
$$D_{total}=f_S D_S+(1-f_S ) D_N(7)$$
Where $$$K_S$$$ and $$$D_S$$$ are the mean kurtosis and mean diffusivity from simulating signals from somas only, and $$$K_N$$$ and $$$D_N$$$ are the mean kurtosis and mean diffusivity computed from simulating signals from randomly distributed neurites only. To quantify the soma and neurite compartmental contributions to mean kurtosis, we define: ,
$$K_{total}'=K_{total}+3=K_{SC}+K_{NC}, K_S'=K_S+3,K_N'=K_N+3(8)$$
Where $$$K_{SC}$$$ and $$$K_{NC}$$$ denote the soma and neurite contributions to total Kurtosis,
$$K_{SC}=\frac{f_S K_S' D_S^2}{(f_S D_S+(1-f_S ) D_N )^2}(9)$$
$$ K_{NC}=\frac{(1-f_S) K_N' D_N^2}{(f_S D_S+(1-f_S ) D_N )^2} (10)$$
Simulation of somas and neurites: We simulated the intracellular diffusion MRI signal using Camino[4]. Digital Cells: We generated triangularized meshes from Blender[6] to represent the intracellular compartment. Somas were represented as spheres, and neurites were represented as cylinders with diameter 1 $$$\mu m$$$ and length 60 $$$\mu m$$$. We controlled the volume fraction (density) of soma in neuron models by sticking different numbers of neurite sticks (0, 10, 20, 30, 40) onto the soma model at diameter 20$$$\mu m$$$ . Diffusion Simulation: Diffusion simulation of the intracellular signal were performed on the digital cells according to the pipeline[7].Each simulation used 1x10⁴ spins with Monte Carlo time step 20$$$\mu s$$$ [8] and intracellular diffusivity $$$2\times10^-9mm^2/s $$$ . For the dMRI sequences, G=56.6mT ,61.3mT $$$\delta=11.7ms ,13.2ms$$$., TE=78ms $$$\Delta$$$ varied from 15ms to 40ms .Thirty-two uniformly distributed gradient directions, including b0, were employed. $$$K_{total}' , K_S , K_N$$$ values were obtained from simulating signals from the full neuron model with neurite sticks (Fig. 1a), soma compartment only without sticks (Fig.1b), and randomly distributed neurite compartments (Fig.1c).
Results
Fig. 1d shows that both soma ($$$K_{SC}$$$ , green lines) and neurite ($$$K_{NC}$$$ , blue lines) compartments contribute to $$$K_{total}' $$$ across various soma volume fractions ($$$f_S$$$ ). Further, as demonstrated by the vertical purple dashed lines, $$$K_{SC}$$$ and $$$K_{NC}$$$ add up to $$$K_{total}'$$$ as expected for $$$\Delta=20ms$$$, verifying equation (6). $$$K_{SC}+K_{NC}>K_{total}'$$$ for $$$\Delta \geq20ms$$$, possibly due to the breakdown of the non-exchange assumption between compartments [8]. For each simulated $$$\Delta$$$ value, $$$K_{SC}$$$ increased with $$$f_S$$$ (Fig. 2b) and $$$K_{NC}$$$ increases with $$$f_N$$$ (Fig. 2d). We also quantified the effect of soma diameter on $$$K_S$$$ , the mean kurtosis from simulating dMRI signal from somas alone. Fig 3a-3b demonstrate a sharp increase in $$$K_S$$$ as soma diameter decreases to around the critical diameter (~10$$$\mu m$$$ ) at which most of the spins sense the cell membranes.. Fig. 3c shows that $$$D_S$$$ increases and approaches the actual diffusivity $$$2\times10^{-3}mm^2/s $$$(shown as dashed line) as soma diameter increases from $$$10\mu m$$$ to 100$$$\mu m$$$ .Discussion/Conclusion
We demonstrated the signal model and simulation of KINDS ((Kurtosis-based ImagiNg of Density of Somas in the cerebral cortex). For the first time, we showed that both soma and neurite compartments contribute significantly to mean diffusion kurtosis in cerebral cortex. Moreover, our quantification of soma and neurite contributions to mean kurtosis prove that compartmental diffusion kurtosis are robust indicators of soma/neurite densities and soma diameter. The presented work could facilitate estimating parameters of great clinical value such as soma density and average diameter. Acquisition of experimental data at multiple diffusion times for validating the estimated soma density and diameter from KINDS is under way.Acknowledgements
This study is funded by NIH MH092535, MH092535-S1 and HD086984.References
[1]. Jensen, J. H., Helpern, J. A., Ramani, A., Lu, H., & Kaczynski, K. (2005). Diffusional kurtosis imaging: the quantification of non‐gaussian water diffusion by means of magnetic resonance imaging. Magnetic Resonance in Medicine: An Official Journal of the International Society for Magnetic Resonance in Medicine, 53(6), 1432-1440.
[2]. Ouyang, M., Jeon, T., Sotiras, A., Peng, Q., Mishra, V., Halovanic, C. Davatzikos, H.Huang. (2019). Differential cortical microstructural maturation in the preterm human brain with diffusion kurtosis and tensor imaging. Proceedings of the National Academy of Sciences, 116(10), 4681-4688.
[3]. Austin Ouyang, Xinzeng Wang, Mihovil Pletikos, Nenad Sestan, and Hao Huang (2014) Histological Relationship with High-Resolution Diffusion Kurtosis Imaging in the Cerebral Cortex. ISMRM 2014
[4]. Hall, M. G., & Alexander, D. C. (2009). Convergence and parameter choice for Monte-Carlo simulations of diffusion MRI. IEEE transactions on medical imaging, 28(9), 1354-1364.
[5]. Einstein, A. (1905). Investigations on the Theory of the Brownian Movement. Ann. D. Phys., 17, 549.
[6]. Hess, R. (2007). The essential Blender: guide to 3D creation with the open source suite Blender. No Starch Press.
[7]. Palombo, M., Alexander, D. C., & Zhang, H. (2019). A generative model of realistic brain cells with application to numerical simulation of the diffusion-weighted MR signal. NeuroImage, 188, 391-402.
[8]. Palombo, M., Ianus, A., Nunes, D., Guerreri, M., Alexander, D. C., Shemesh, N., & Zhang, H. (2019). SANDI: a compartment-based model for non-invasive apparent soma and neurite imaging by diffusion MRI. arXiv preprint arXiv:1907.02832.
Figures
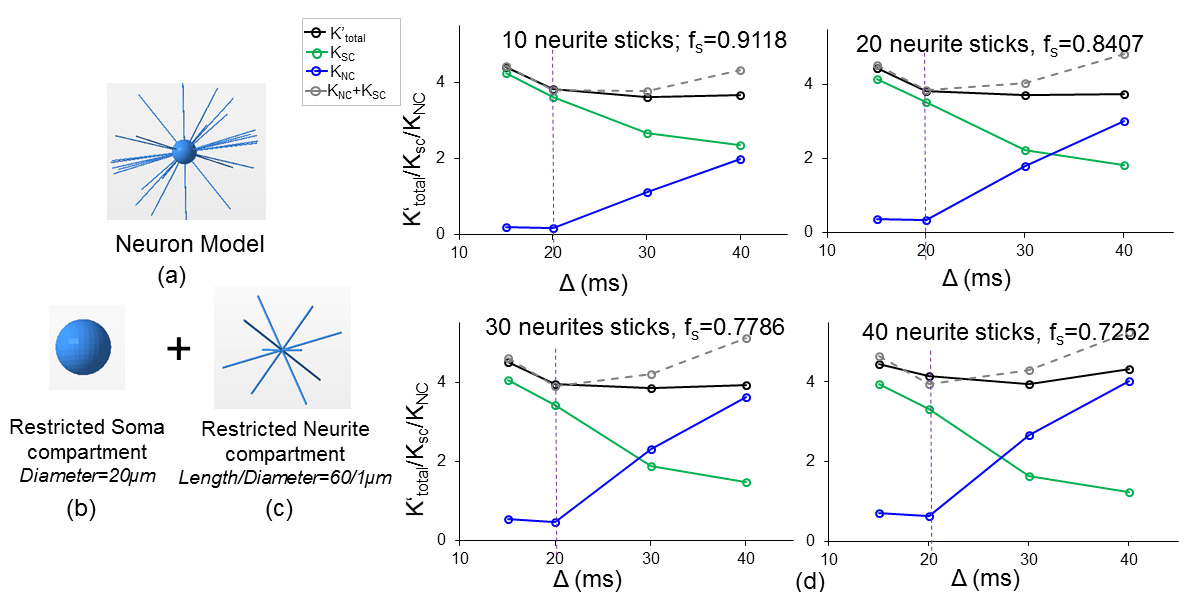
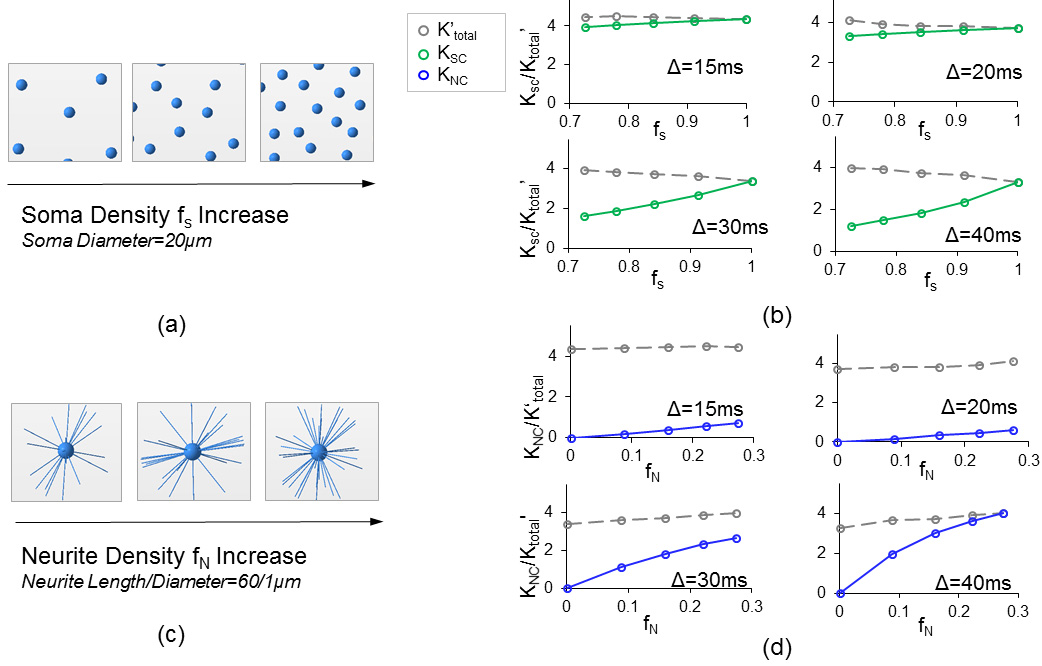
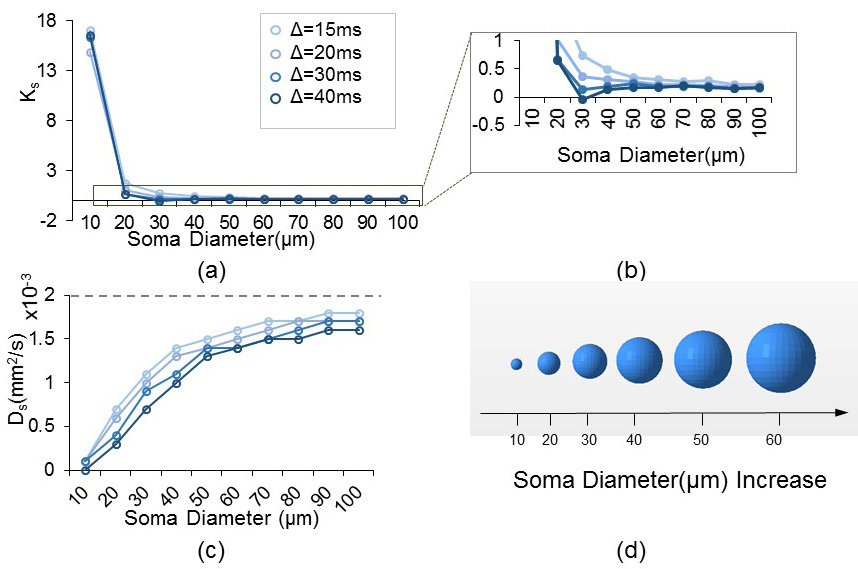
Figure 3. Effect of soma diameter dS on KS (mean apparent kurtosis when simulating diffusion MRI signal from somas only) and DS(mean apparent diffusivity in somas). (a), (b) demonstrates how KS depends on dS at various diffusion times. Notice a sharp increase in KS as dS decreases to the critical diameter (~10μm) for the relevant Δs. (c) demonstrates how DS depends on dS at different Δs. The gray dashed line represents the actual diffusivity ($$$2\times10^{-3}mm^2/s$$$) used in simulation,(d) illustrates soma models with increasing dS.